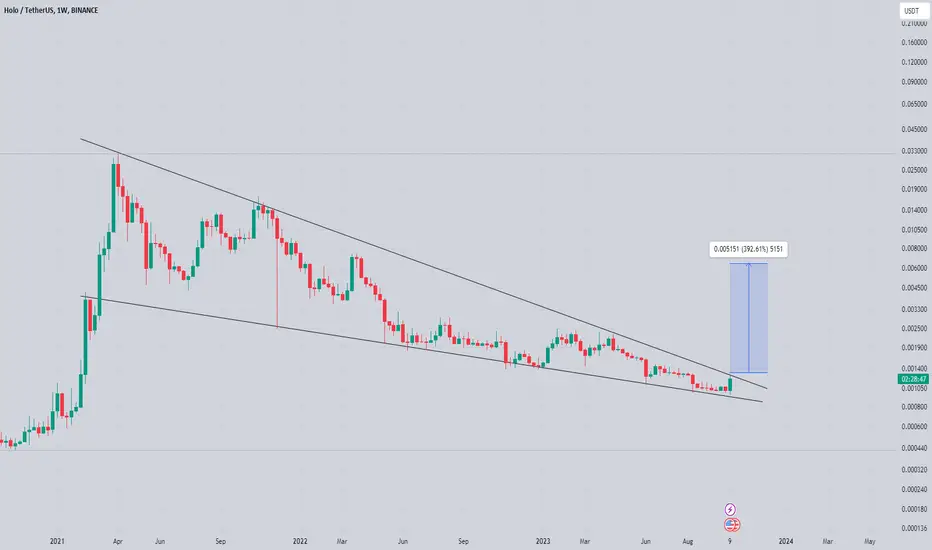
Hot broke out its huge triangleHOT broke out of its huge traingle and shows strong value. With upcomming releases from the team there is a huge potential to come! Frist step to break is 0.0023. after that HOT will fly!
HOTUSDT.P trade ideas

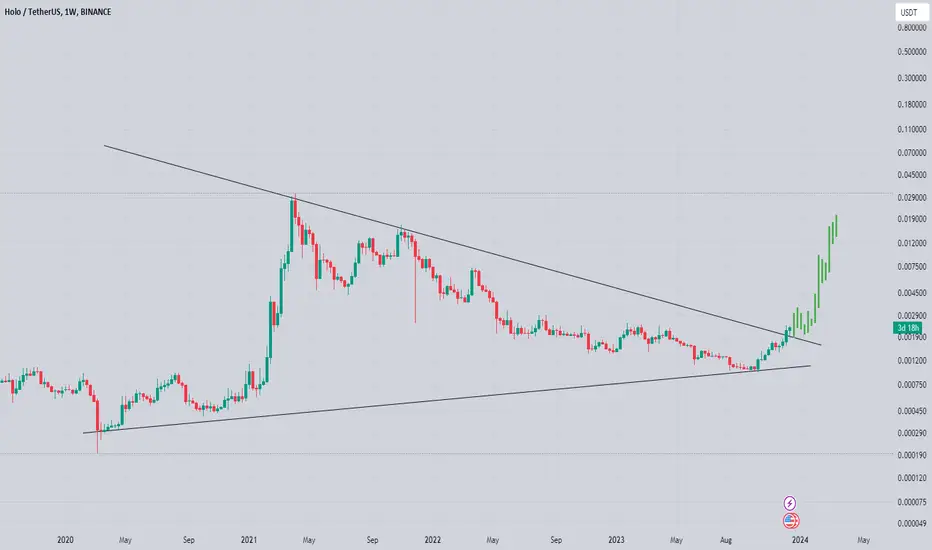
hot finally ready for massive recovery seems like has already bottomed out and preparing for massive bullish rally in midterm
symmetrical triangle breakout has already looking ready for massive bounce in coming weeks expecting 3 to 4x bullish wave in midterm
HOT/USDT Assessing Breakout Potential Above Resistance?👀🚀HOT💎 Paradisers, let's examine #HOTUSDT as it's currently showing an intriguing market behavior. The asset is in the process of challenging a significant resistance level, laying the groundwork for its next strategic move.
💎 Looking back at #HOLO recent journey, we've observed its adherence to a descending channel pattern, followed by a break above. Although LSE:HOT faced a rejection at the robust resistance level of $.0002369, it's gearing up for another breakout attempt. A successful breach of this level could significantly increase the likelihood of an upward trend.
💎 However, there's an important caveat to consider. If #HOT fails to penetrate this strong resistance, it may pivot towards a bullish resurgence from the key support level of $0.001761. Conversely, a decline below this support could indicate the onset of a downtrend, underscoring the need for prudent trading decisions. 🌴💰

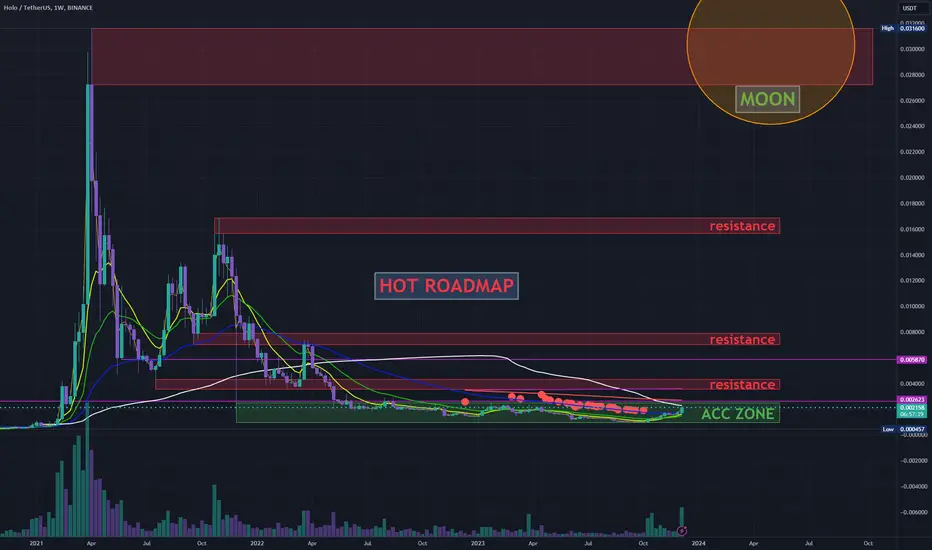
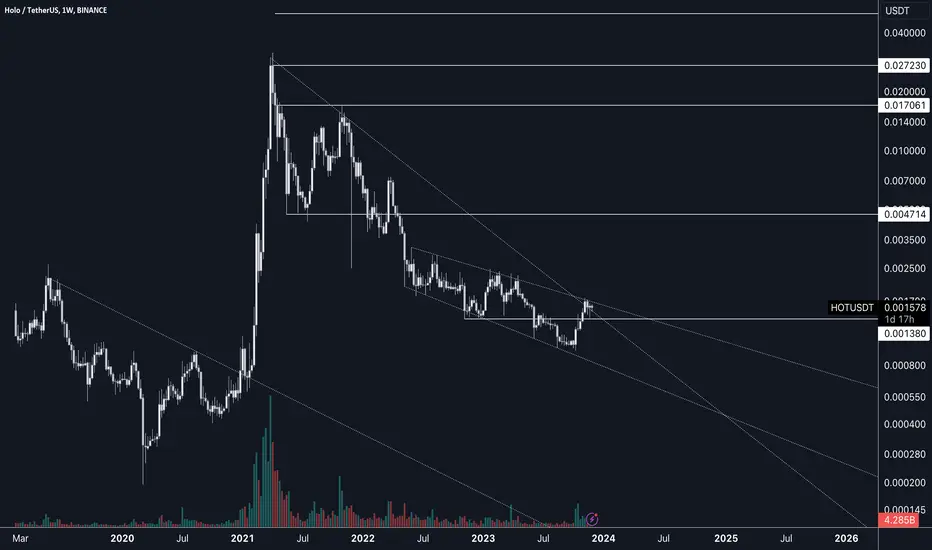
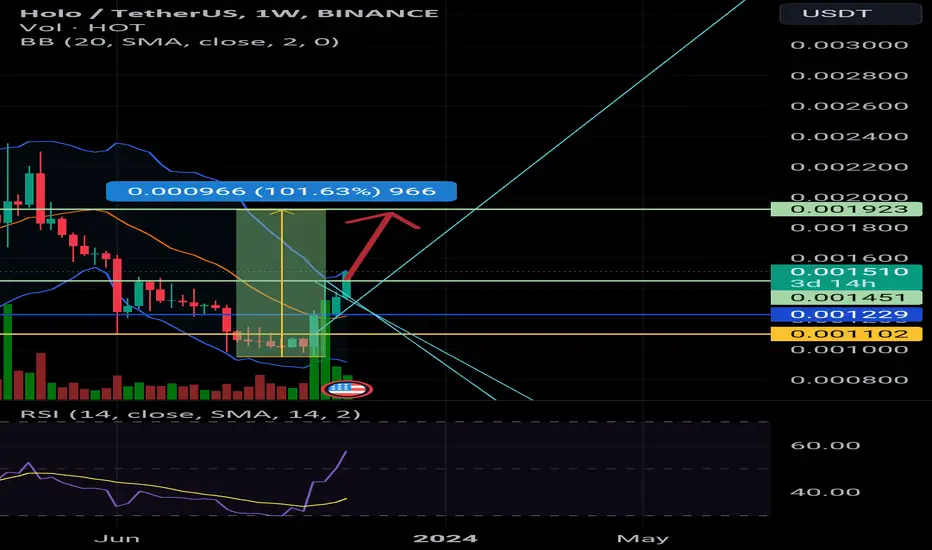
HOT Future RoadmapHOTUSDT Weekly Chart-
These are just my thoughts on areas of significance. I feel like we're still in an accumulation zone. If bullish sentiment continues, I think we exit this area soon.
Maybe dips on New Weekly candle (Monday), will provide acc area for next leg up, if/when momentum continues.
Key areas of resistance: (Areas to take profit, areas that will provide potential pullbacks for safer entries)
Market is in GREED mode right now so best to be waiting and watching for opportunities to present themselves.
My goal is to share my knowledge to help regular folks like myself trade safer, and transition into the 10% of Market winners.
Thanks for your time! Please like and follow me here for more crypto analysis.
**Not financial advice, just my 2 cents.
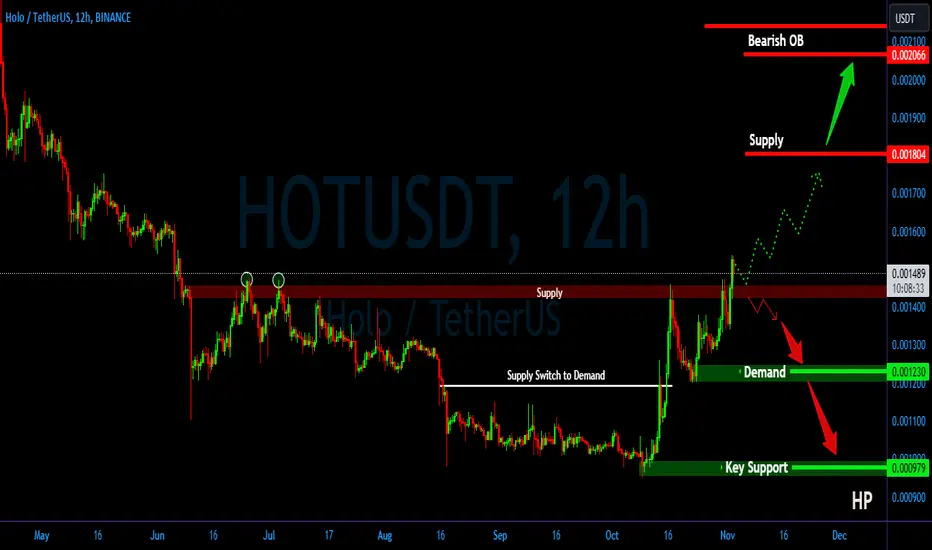
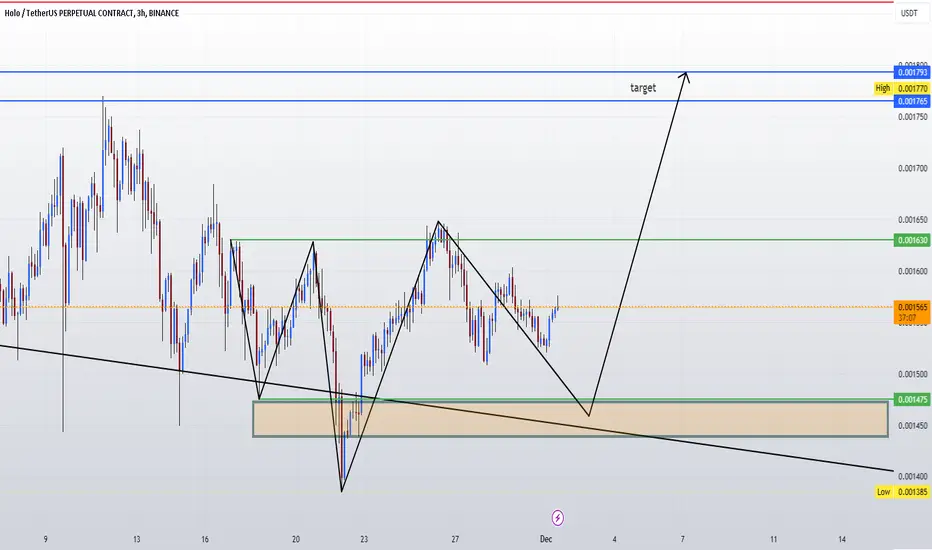
HOT/USDT Break the Key Area. Upward Momentum ???💎 HOT has indeed captured the market's attention with its recent breakout above a key supply level, signaling the potential for continued upward momentum. Presently, HOT may enter a retesting phase at the demand area, previously a supply zone, at $0.001460.
💎 A successful bounce from this level, Probability could see HOT's price move smoothly toward the targeted supply and bearish order block (OB) areas.
💎 However, should HOT fail to show bullish rejection during the retest at the demand area, it could indicate an inability to sustain higher prices, leading to a breakdown below this level. Such a scenario would suggest a false breakout, with HOT potentially entering a downward trend towards the next lower demand zone, and possibly retreating all the way back to the key support area.
HOTUSDT AGAIN1-Apply your own risk management.
2-Daily and Weekly Targets
3-Hunt the profits at any level you see convenient for you.
4-Raise Your SL to protect your profits
5-Use 6% Spot
6-Long it With 3% LEV3
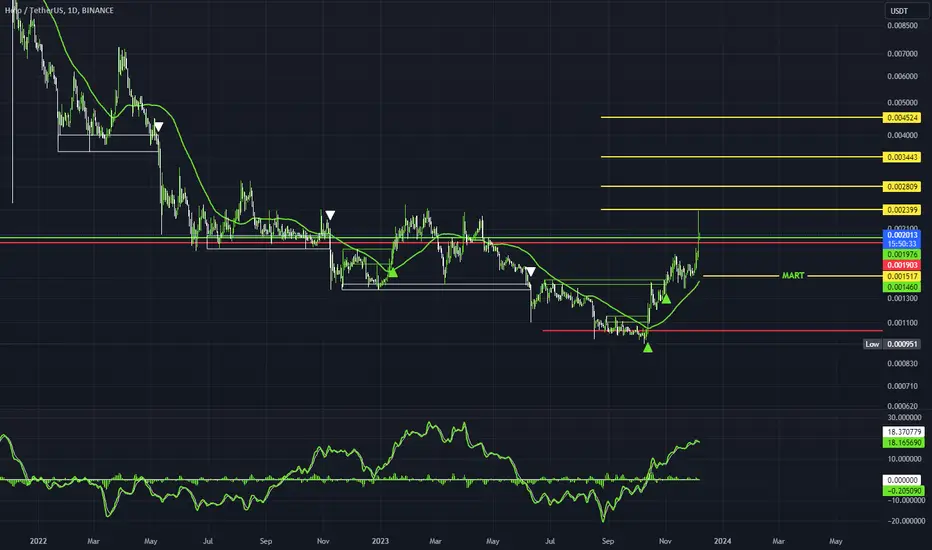
HotUsdt leave channelAfter the disaster of SBN, all related tokens and coins fell more severely, but now, little by little, with Solana, good projects are rising again.
Hat can now be prepared for a powerful move by exiting this downward channel of more than a year. Of course, the suggestion is for Yadel, not for futures, but you can use it for trades with your strategy.
I have tried to specify all possible goals for you in the short term and even after the halving.
Good luck
Entrypoint:
0.002010
0.001932
0.001698
Supports:
0.001530
0.001380
0.001190
0.000985
Resistances:
0.002185
0.002465
Targets:
0.002775
0.003707
0.004430
0.005375
0.006535
Midtime:
0.008612
0.011470
0.014387
0.020983
HODL:
0.033720
0.056446
0.082107
and:
0.131320
0.082107 Don't forget that all hold targets may not be available
#Hot#Hot/usdt
The price has been trading in a large bearish channel since July 2022
Recently, it broke a small bearish channel at the price of 0.001100.
It heads to the upper border of the large channel at 0.001900. First target
In the event that the large channel is broken, the price will head to the 0.002500 level.
as a second target at a rate of 120% of the current price.
All of this is supported by oversold conditions on the MACD indicator.

Holo (HOT)Holo been moving in a downtrend for a while. The horizontal area is where HOT might get attention again, buy volume increases, and thus a reversal happen. Also, there are two downtrend lines as HOT movements are more complex than others. Let's see what happens.
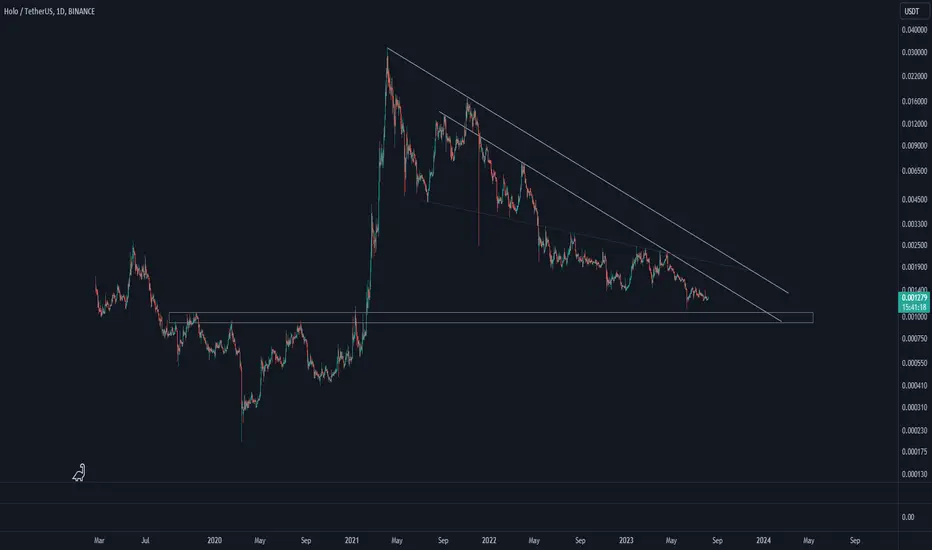
Holochain $HOT Fundamental and Technical play1. Prevailing Trend: The chart illustrates that HOT has been in a significant downtrend, marked by the descending trendline. This trendline is drawn by connecting the lower highs, which is a characteristic of a bearish market phase.
2. Recent Price Action: There's a visible break of the descending trendline, with the price moving above it. This breakout could be interpreted as a bullish signal, indicating a potential reversal of the downtrend.
3. Support and Resistance Levels: Horizontal lines on the chart likely represent key support and resistance areas. These are prices at which the asset has frequently reversed direction. The price is currently between two such levels, with the potential to move towards the upper resistance if the bullish momentum continues.
4. Volume Data: The volume appears relatively low compared to the volume seen during previous significant price movements. Sustained or increasing volume would be necessary to confirm a strong bullish reversal.
5. Potential for Retest: After a breakout, it's common for the price to retest the trendline from the other side. If the price retests the trendline and holds above it, it could serve as confirmation of the trend change.
6. Long-Term Trajectories: The chart extends into the future with the trendlines. If the current breakout is sustained, these lines could indicate potential long-term pathways for price action.
hotusdthotusdt may go for completing right shoulder where we have a bullish order block also . we can then have some upside in hotusdt .
invalidation will be below head
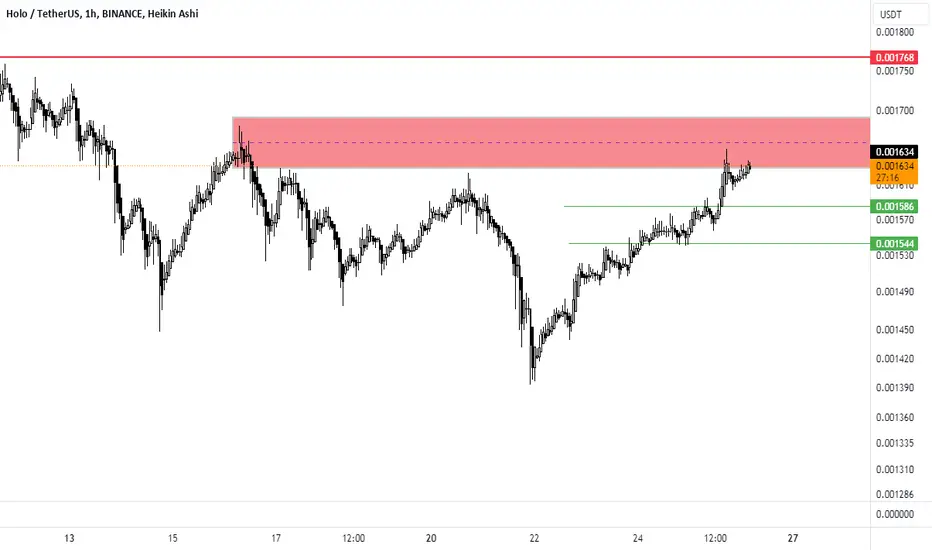
hotThere is a small resistance here
Break can touch the top line
By keeping the green lines of course
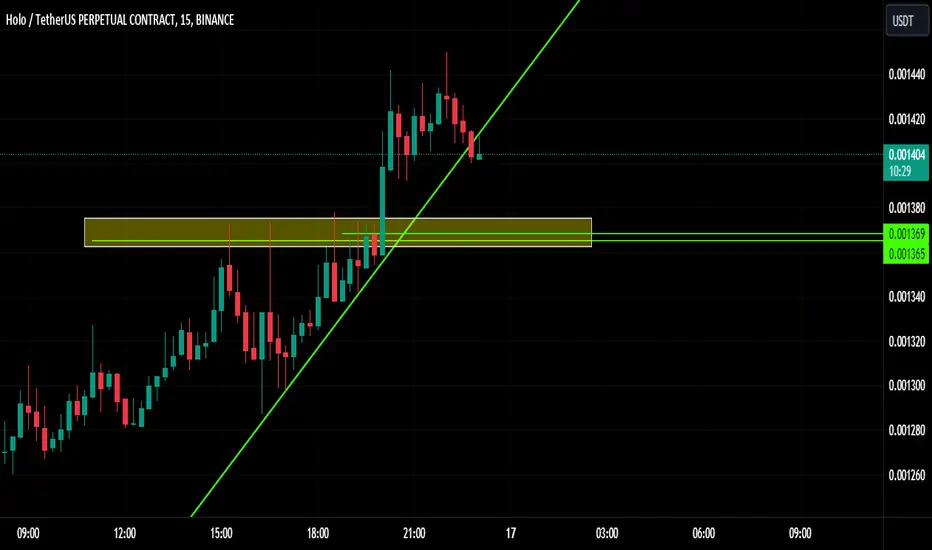
HOT 15min time frame HOT 15min time frame
5x leverage with multiple entries
enter at current price due to order block and fair value gap
lower entries 0.001503 / 0.001492
stop loss 0.001472
target 0.001620
This is for ENTERTAINMENT purpose Only.
Not Financial Advise
Always DYOR ( do your own research )

🌟💡 Holochain (HOT) Analysis! 🚀📈Hey Crypto Enthusiasts! 🌍👋
I've just spotted something HUGE on the charts for Holochain (HOT)! 📊🔍 There's a BIG bullish divergence 📈🐂 indicating that HOT might be gearing up for a major uptrend! 💥🚀
But what makes Holochain so special? 💬
1️⃣ Decentralized Applications (dApps) 🌐🔗: Unlike traditional blockchain, Holochain offers a framework for developing efficient and scalable dApps. This means faster and more secure applications! 🏎️💻
2️⃣ Energy Efficiency 🍃⚡: Holochain is designed to be more energy-efficient compared to traditional blockchain tech. This is not only good for the environment but also reduces costs! 🌱💚
3️⃣ Scalability 📊📈: With Holochain, each device on the network gets its own secure ledger. This unique approach allows for incredible scalability, handling more transactions as the network grows! 🌟🔝
4️⃣ User Autonomy 🚹🔄: Users have more control over their data and interactions. This is a big win for privacy and user empowerment! 🛡️🚀
So, what does this mean for HOT? 🤷♂️💥
The tech behind Holochain is not just innovative; it's revolutionary! 🔧🎉 With its unique approach to dApps, energy efficiency, scalability, and user autonomy, HOT is not just a token – it's a glimpse into the future of decentralized tech! 🌌🤖
Keep your eyes on HOT! 👀📈 This bullish divergence might just be the beginning of something BIG! 💹🎊
#Holochain #HOT #CryptoNews #BullishDivergence #FutureOfTech 🌐🎯💹🔥

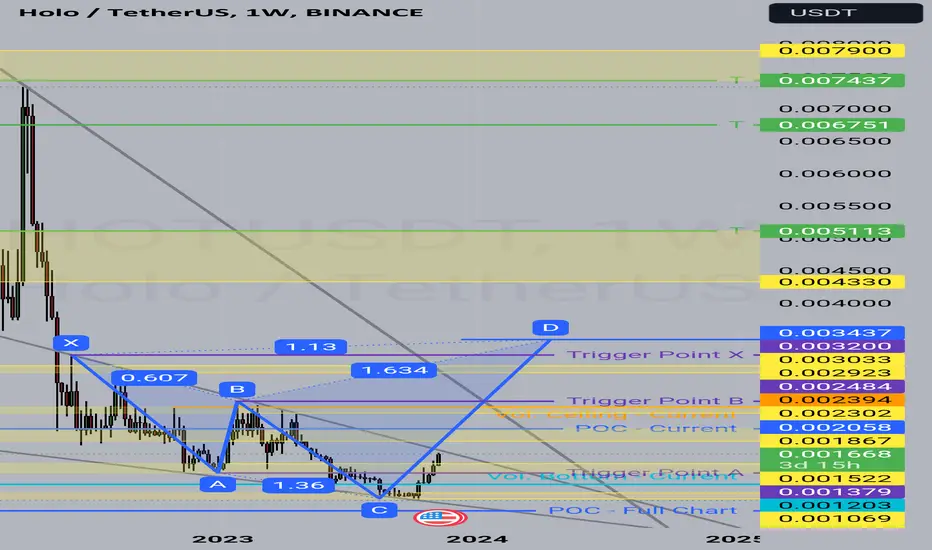
Hot 1w is bullish That's the total analysis for hot according the OB points, harmonic pattern and trends
It will soon breakout a main trend and it will give it a bullish move upward insha Allah
All the best guys!
HOT USDT - Bull RunThe Crypto Bull run is now going to begin, and as per technical analysis, the GALA will become a rocket soon.
There are some target on cards that will hit soon.
Buy Call: $0.001496
Target 1: $0.002500
Target 2: $0.003720
Stop Loss: $0.0000972
HOT NEW INCREASE VOLUMEThank you for reading our update. Please keep in mind that this is not trading advice.
HOT seems to build new unexpected volume

Holochain next resistance lineResume:
see the chart.
weekly report.
going to be 100%completed.
RIS very down, good for us.
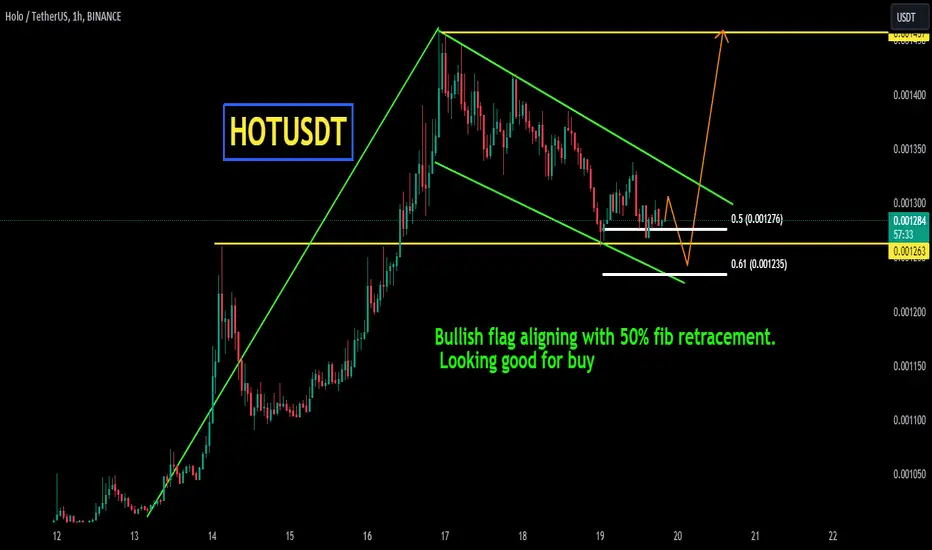
HOTUSDTHOTUSDT is in strong bullish trend.
As the market is consistently printing new HHs and HLs.
currently the market is being respected by inclining trendline and has also formed bullish flag pattern which is also being supported by inclining trendline.
These two to gather putting strong bullish confluence for the pair.
What you guys think of this idea?
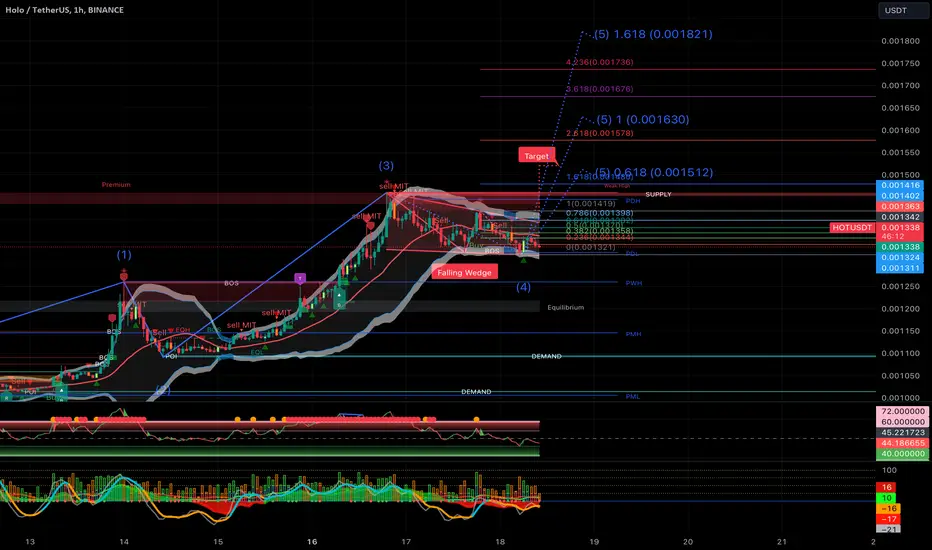
1H - HOT - Elliot WaveOn the 1H time frame Holochain looks bullish and seems to continue with the Elliot Wave to the 5th Wave, before a bigger correction will follow.
#HOTUSDT.P - QUICK SCALP SHORTShort Scalp for #HOTUSDT.P. A short scalp short to avoid boredom while waiting for my other positions -+
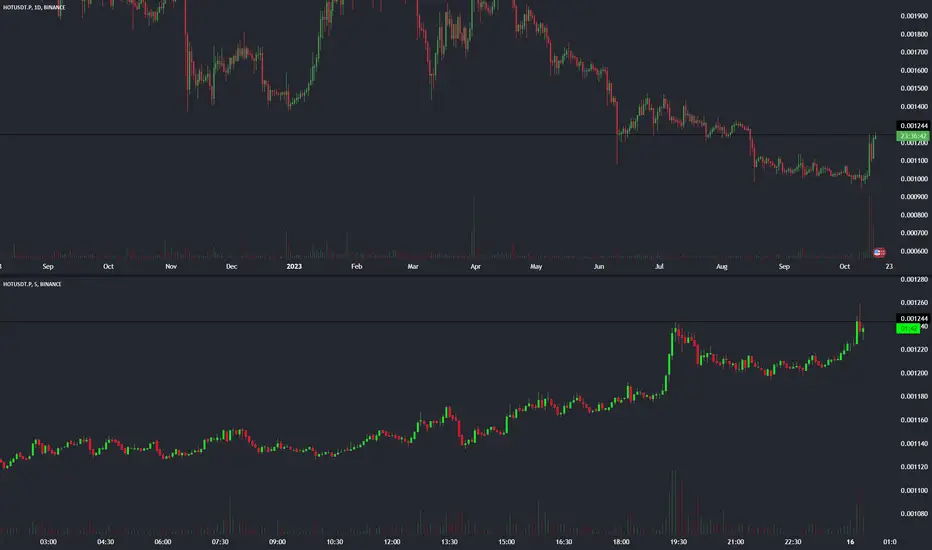
HOT │ 16.10.2023BINANCE:HOTUSDT.P
Signals for level breakout
bar/candles closure near the level;
bar/candles closure near its high/low;
close retest of the level;
accumulation of energy for level breakout;
a good approach to the level;
consolidation near the level;
there is no reaction to a strong instrument movement;
the instrument is being held from falling/rising in price;
there is a reserve of calculated ATR;
there is a reserve of technical ATR;
Trade Parameters
Open : 0.00125;
Stop loss : 0.00123;
Take profit :
0.00130;
0.00131;
0.00133;
Disclaimer
Every trader should make their trading decisions based on their own analysis and circumstances. The signals in this channel should be considered as an additional tool for your own consideration.
Follow me and receive high-quality cryptocurrency market analysis!
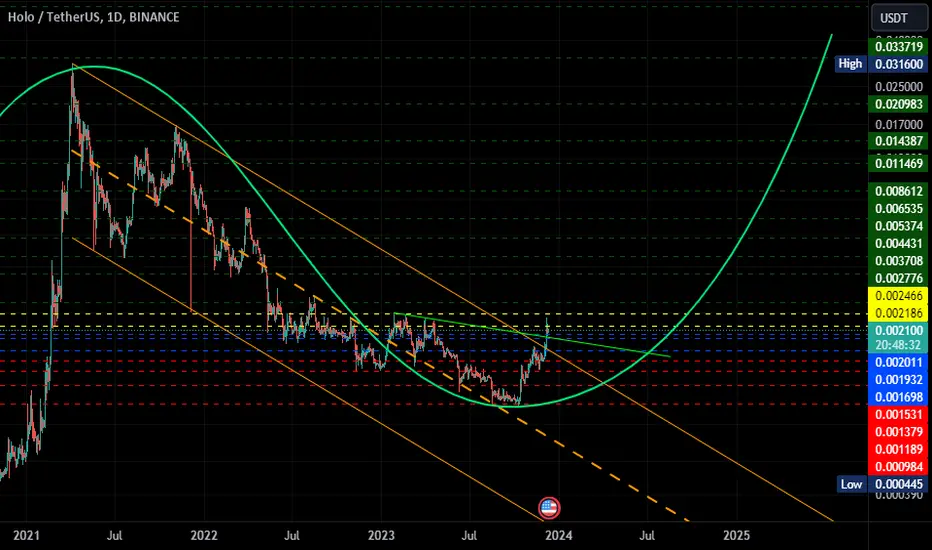
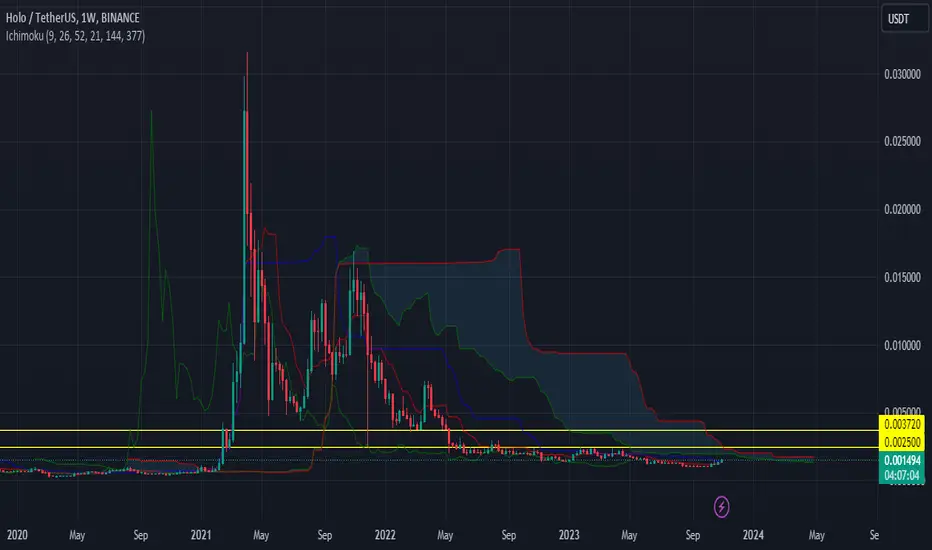
seems like hot getting ready for massive bullish wave in midtermseems like hot has already bottomed out and getting ready for massive really in midterm
formed falling wedge in weekly timeframe and approaching towards multi year trendline expecting breakout soon
incase of successful breakout expecting 3 to 45x bullish wave in midterm