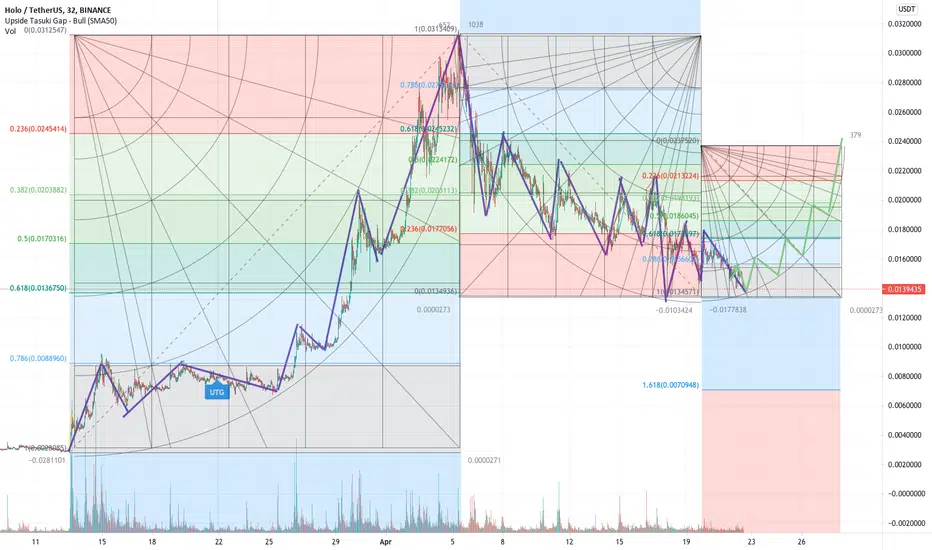
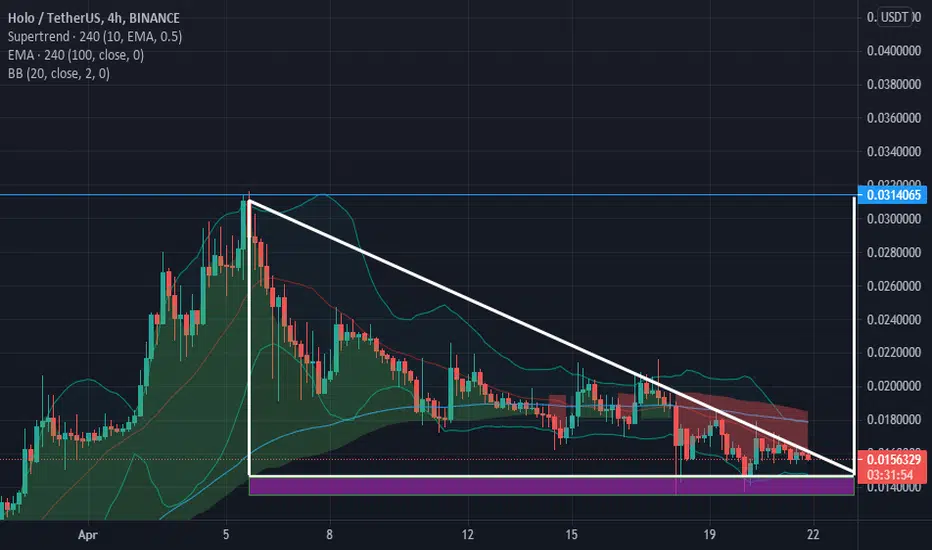
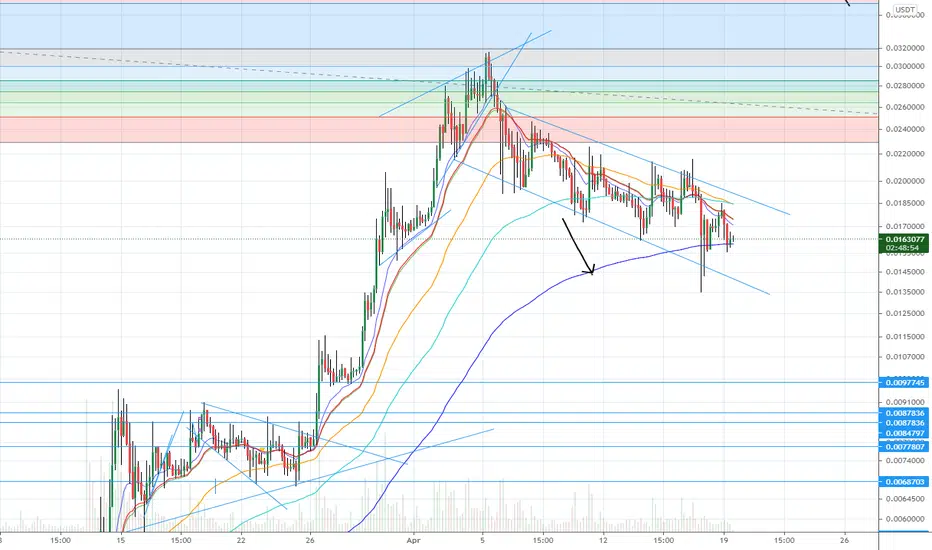
AGAIN WITH HOT! :)Hello everyone, this is the third idea I post on HOT. Last time I mentioned a few scenarios, and the one who played out we the GREEN LINE - BEAR SCENARIO. This led to forming a new line (NL in the chart/purple color) breaking the old one (OL). Still it remains in a downtrend, while in the general YTD, it has made massive a run. But where to now? Again I will mention to scenarios.
SCENARIO- The first scenario looks to test again the 0.0145 area, by making a push to the area there. The line to break now, for a confirmed full short time bull run is the red line (AREA TO BREAK in the chart). If it breaks that and it holds, we see a very huge run soon. If it gets rejected, it will try to consolidate in the areas in between, which is a good thing for trying again very soon. RSI indicates that this trend will probably come to an end, looking for a consolidation moment before another run. If the run begins, it will last 3-6 days, in need to break the ATH and forming a new one.
SECOND SCENARIO- Dependable on the volatility of the market, this scenario has to mentioned. If you are looking for a short term trade, you definitely need to put SL. In this scenario, (The yellow line in the chart) indicates a move to the 0.0086, where the last run started, looking to do a parabolic move again, which will lead to a new ATH. RSI indicated that too. But due to the volatility of the market in general, make sure that this does not close below the red line (MUST NOT CLOSE UNDER THE LINE in the chart) or that will indicate a quite big rejection. In short term trading, you have to be really careful with HOT, unless you are looking to fill your bags for the long term ride, there is nothing to worry as these things are very normal in the crypto market, what goes up, goes down hard. But soon it can go up hard again. So no worries.
Don't forget to be careful in general with the market. Trade with patience. If you have any comment, you can share it with me. Good luck. :)
HOTUSDT trade ideas

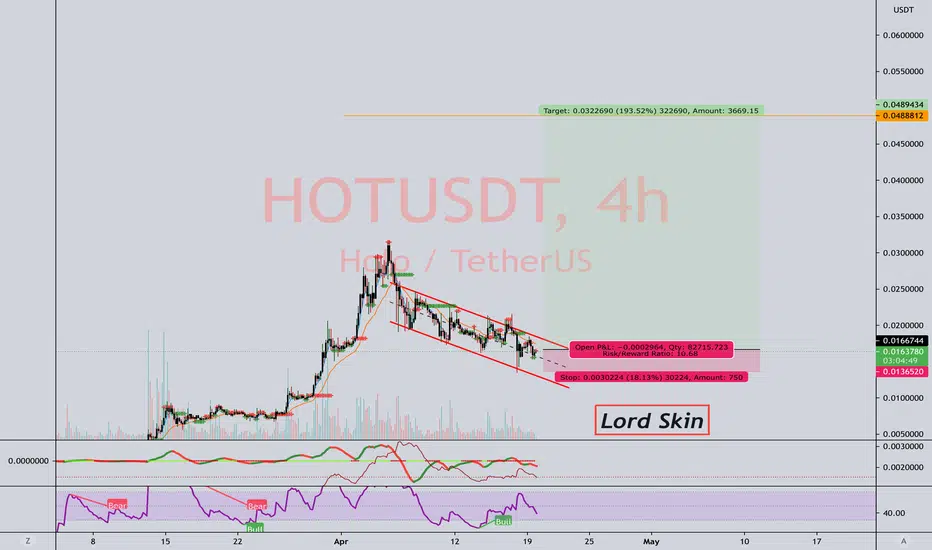
HOTUSDT - Long - Potential 12.42%HOTUSDT - Long - Potential 12.42%
Exchanges: Binance
Signal Type: Regular (Long)
Entry Zone:
0.0127571 - 0.0133900
Take-Profit Targets:
1) 0.0137717
2) 0.0149602
Stop Targets:
1) 0.0121193
Trailing Configuration:
Entry: Percentage (0.0%)

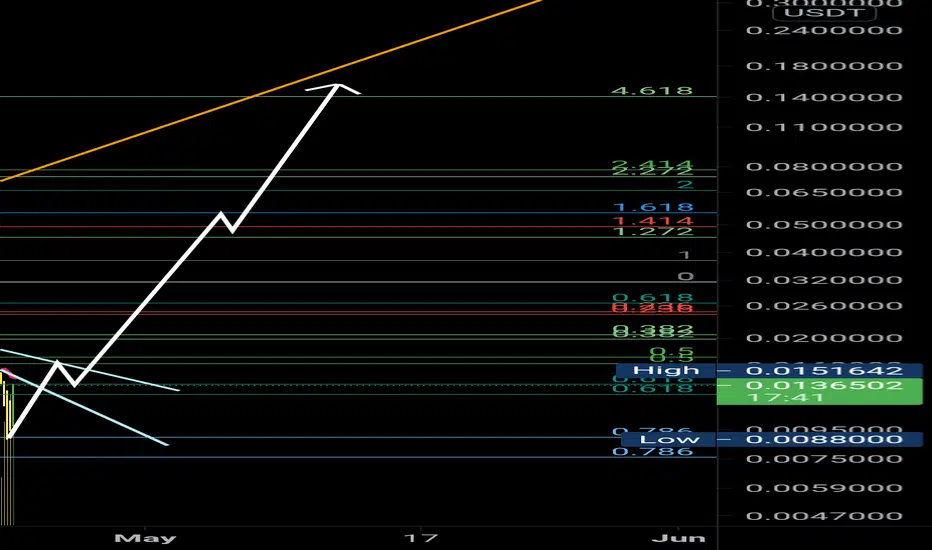
Hot usdt is very bullish If you want hold holo chain
Now is a best time for long
I hope we see 0.14 in 1~3 month

HOT AnalysisHot is testing the .618 retracement from the initial but run that started in mid march. I believe HOT will dip to .0135 before possibly moving back up to around the .024 level. If HOT dips below .618 level, bull run is over, if not, it will need to show strong momentum to break past .024 level.
HOT 4h Yönünü belli edecek şekilde gerçekleşecek olan hacimli kırılımdan sonra retest beklenip işlem açılabilir.
Yatırım tavsiyesi değildir, yatırım yapmadan önce yatırım danışmanınıza danışın.
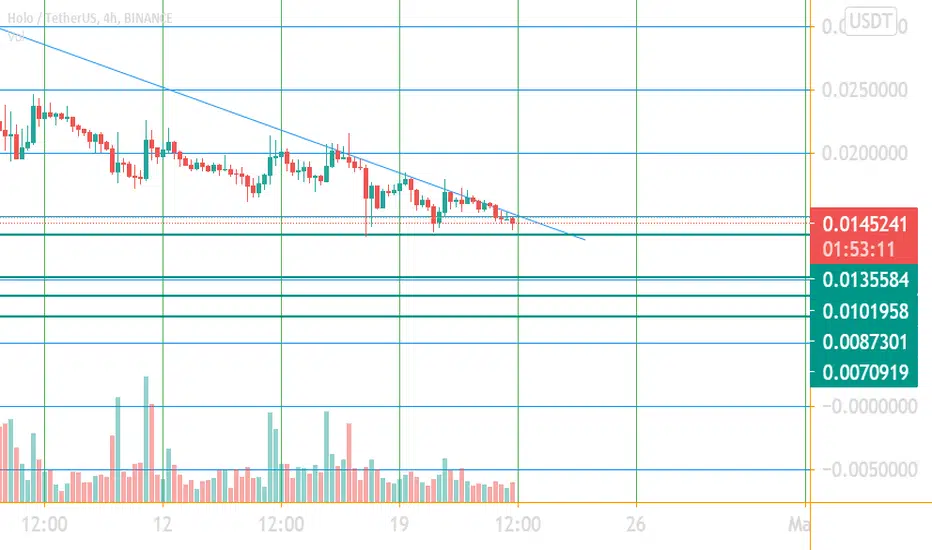
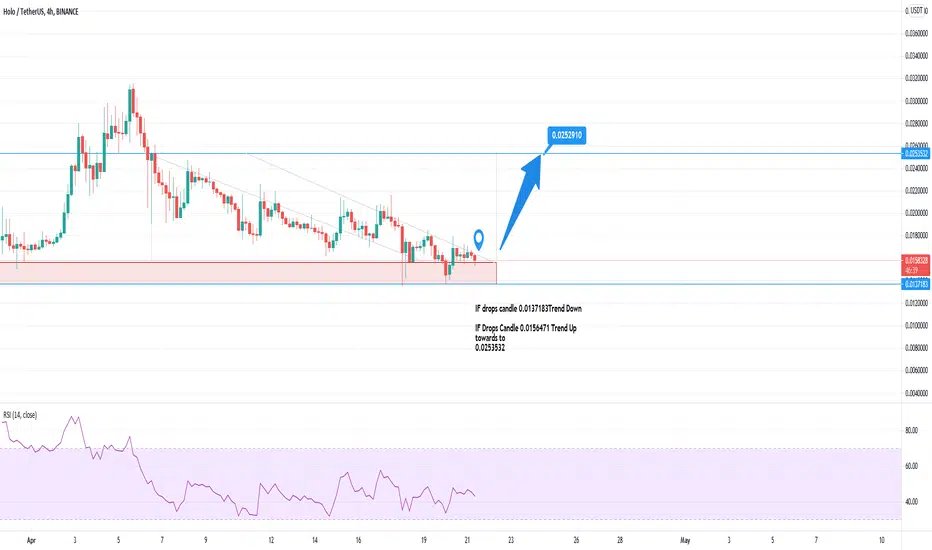
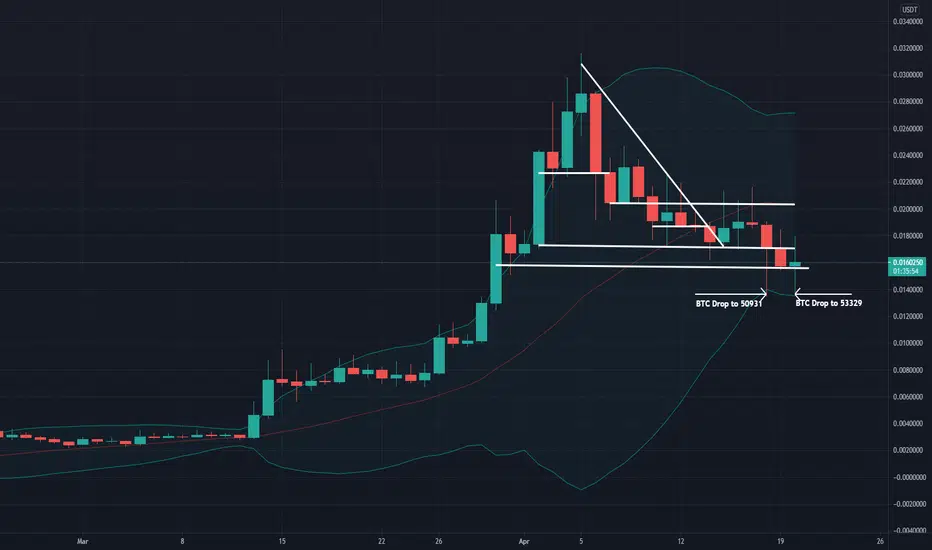
HOTUSDT about to break, depends onBTC closing in 8 to 12 hoursIF drops candle 0.0137183Trend Down
IF Drops Candle 0.0156471 Trend Up
towards to
0.0253532
All connected to BTC DO NOT FORGET.
Turkish.
Eğer son mumları trend üstüne bırakırsa 0.0156471 en son 0.0253532 görücek.
Eğer mum 0.0137183 altına kapanırsa trend altına kapatırsa trend aşşağı dönücekdir.
Hepsi BTC nin son 4 adet / 4 saatlik kapanışına bağlı olarak belli olucak.
NO BTCUP NO GAIN
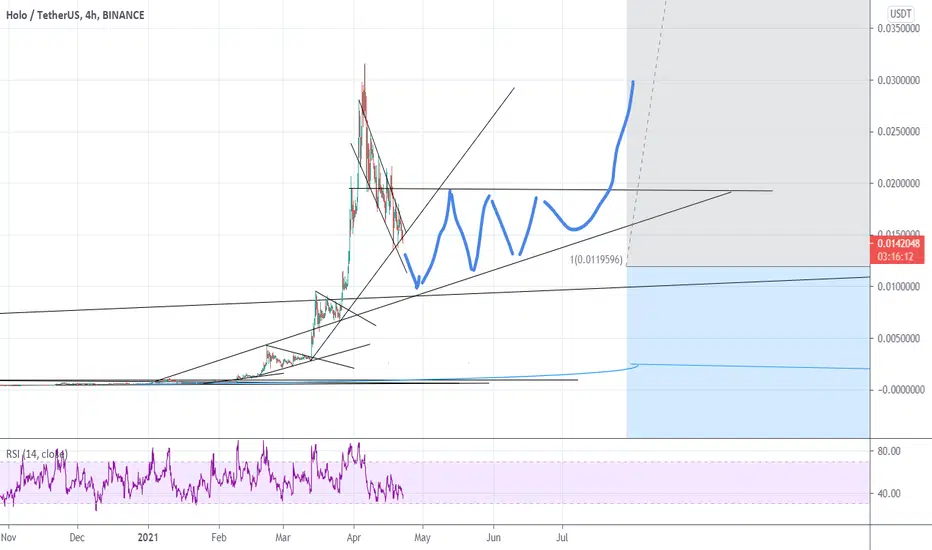
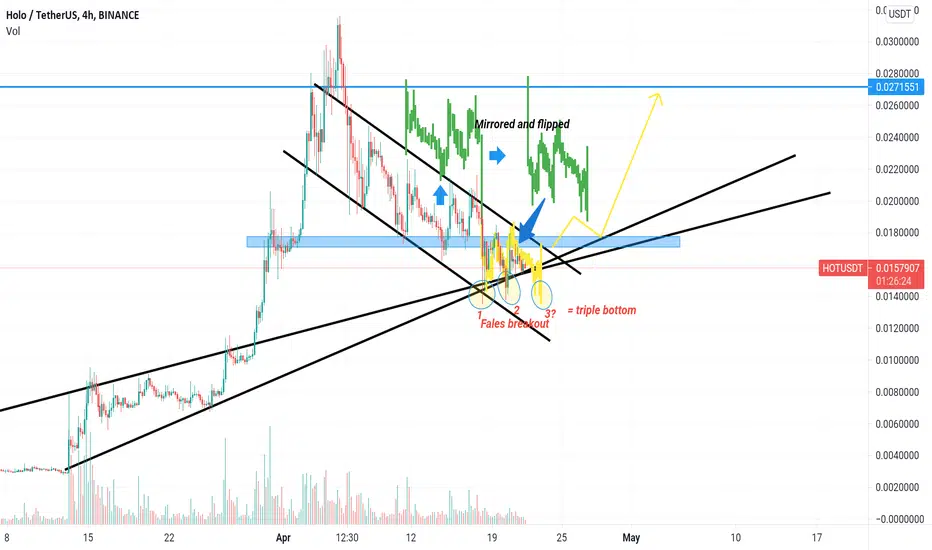
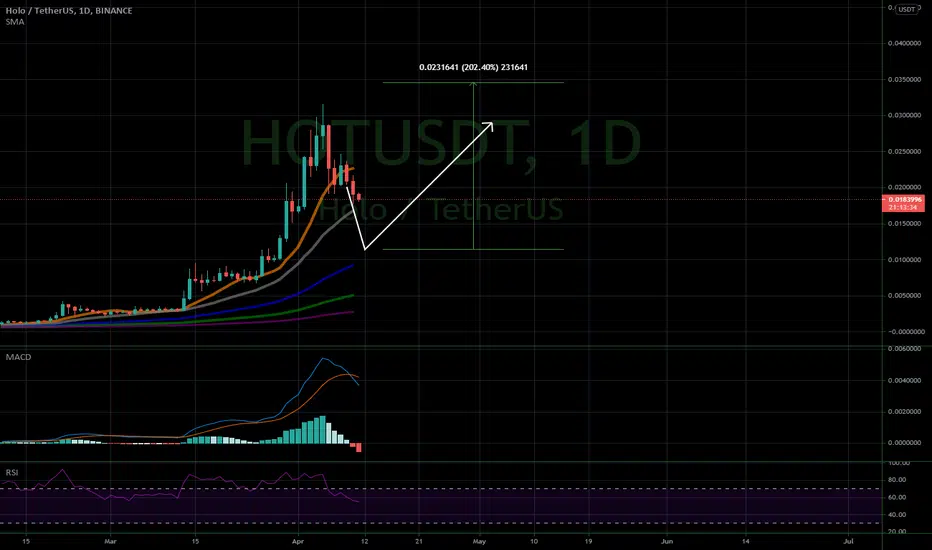
HOT / USDT bullish movement is about to happen.Hi every one
HOLO / TETHER
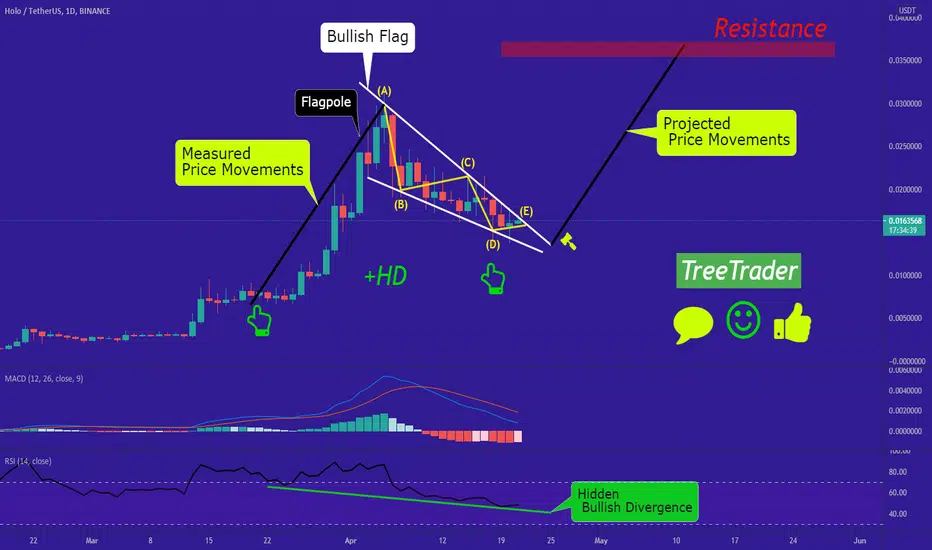
HOT/USDT has formed a bullish pennant with a Hidden bullish divergence on RSI indicator as well . the chance of bullish movement for HOT is pretty great ! after the Break out the Price can Increase as much as the flag pole!
Traders, if you liked this idea or have your opinion on it, write in the comments, We will be glad.
Things can change...
The markets are always changing and even with all these signals, the market changes tend to be strong and fast!!
Thank you for seeing idea .
Have a nice day and Good luck
HOT went trough four(!) support Zones!HOT went trough four support zones. It will be a hard journey up to three cents again, with many resistance zones (former support zones). If it rises i do not expect a quick comeback but one which will take several days. Momentum attracts new buyers - but the resistance zones (former support zones) are so close, that it will be hard to gain that momentum.
I would rather look at coins which were supported well during the BTC drop.
No financial advise!
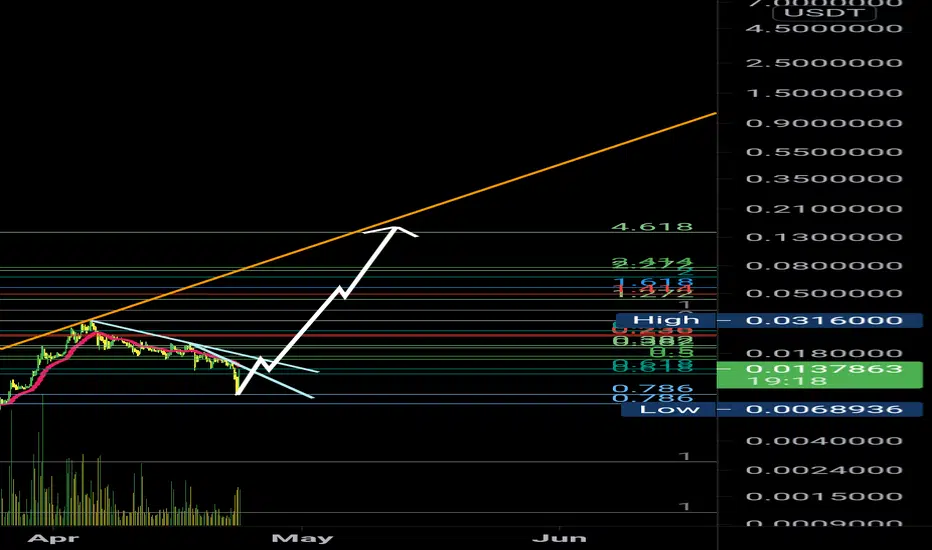
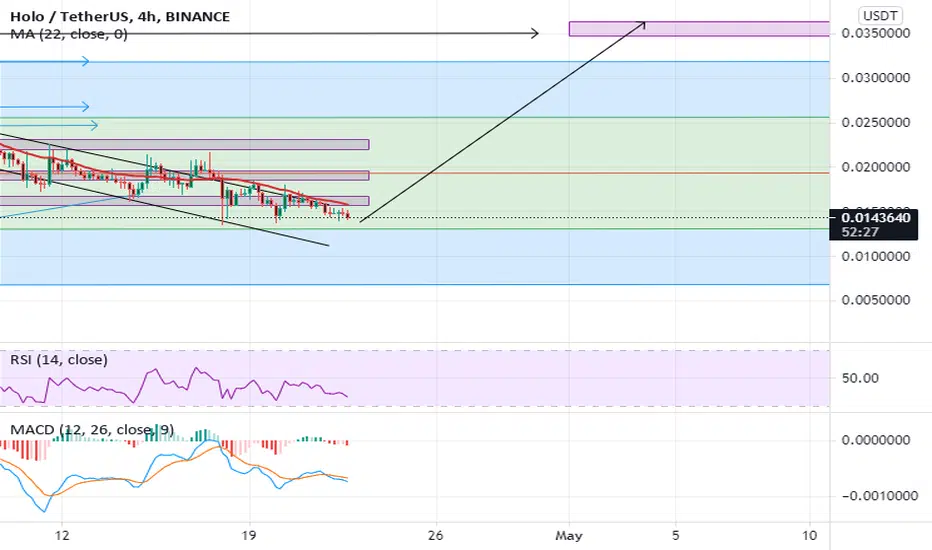
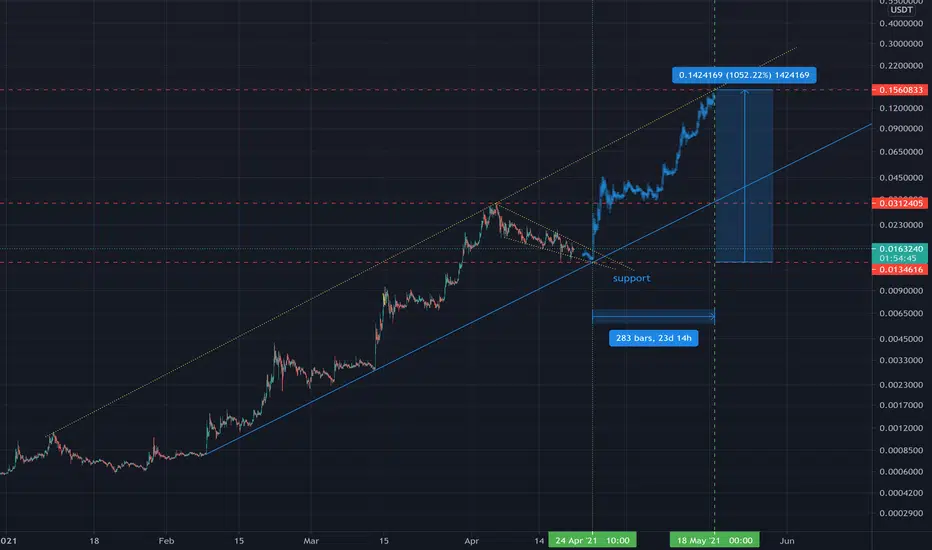
HOT could 10x On wider image saw HOT could potentially do a 10x from 0.014 to 0.15 in May. Coming days HOT might still drop down a few times to it major supports and them have a huge run up to 10x gains or even more.

HOT is hotHOT have bottomed and if you buy it for 15cents projected what it can reach it 40cents which is about 180% gains

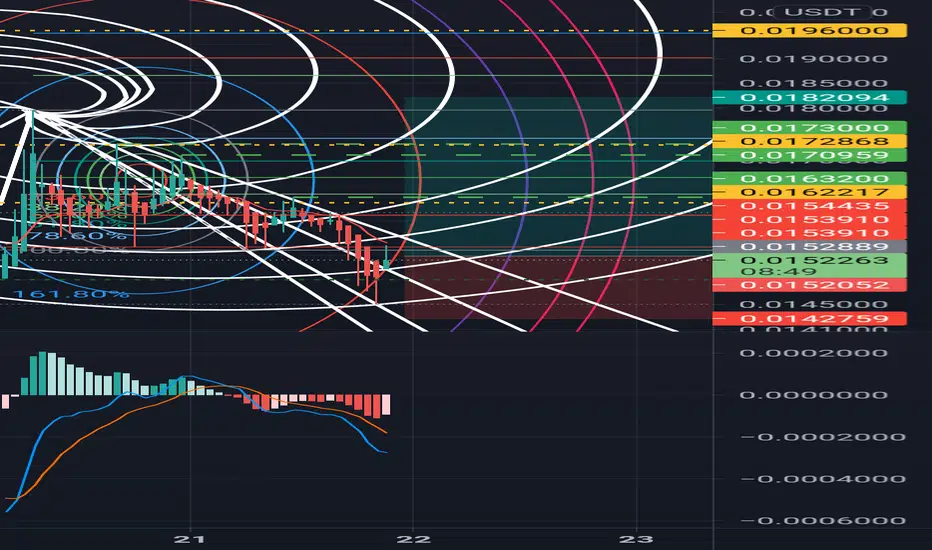
Crypto|HOT/USDT|LongLong HOT/USDT
Activation of the transaction only when the blue zone is fixed/broken.
The author recommends the use of anchoring fixed the blue zone, this variation is less risky.
If there is increased volatility in the market and the price is held for more than 2-3 minutes behind the activation zone after the breakdown, then the activation of the idea occurs at the prices behind the activation zone.
The idea is to work out the resistance level .
* Possible closing of a trade before reaching the take/stop zone. The author can close the deal for subjective reasons, this does not completely cancel the idea and is not a call to the same action, you can continue working out the idea according to your data, but without the support of the author.
+ Maybe right now we will go even lower, then it's okay, the idea is not activated and simply canceled.
+ ! - zone highlighted by the ellipse is a zone of increased resistance, in this area there is a possible reversal for a correction, please take this factor into account in this transaction.
The "forecast" tool is used for more noticeable display of % (for the place of the usual % scale) of the price change, I do not put the date and time of the transaction, only %.
Blue zones - activation zones.
Green zones - take zones.
Red zone - stop zone.
Working out the stop when the price returns to the level after activation + fixing in the red zone.
Orange arrow - the direction of take.
The red arrow - the direction of the stop.
SUM PNL: This parameter displays the total % of all closed ideas of the "new" format (according to the author) for this sector at the time of publication of the idea. The calculation is very "clumsy" just the sum of the profits of all the ideas, based on this indicator, you can more accurately assess the risks when working with my ideas of this sector. I present you the construction of the idea, you can use it yourself as you like based on your subjective view and risks, the calculation of the PNL indicator is carried out only on transactions that the author closed on TV in manual mode or by take.
P.S Please use RM (risk management) and MM (money management) if you decide to use my ideas, there will always be unprofitable ideas, this will definitely happen, the goal of the system is that there will be more profitable ideas at a distance.

HOTUSDT (How far are we going to go ? )This is just an idea on how far we drop. I don't currently see a sign of reversal just yet and I feel like the 50 day SMA (blue line) could be a good bounce for us. Let me know your thoughts..
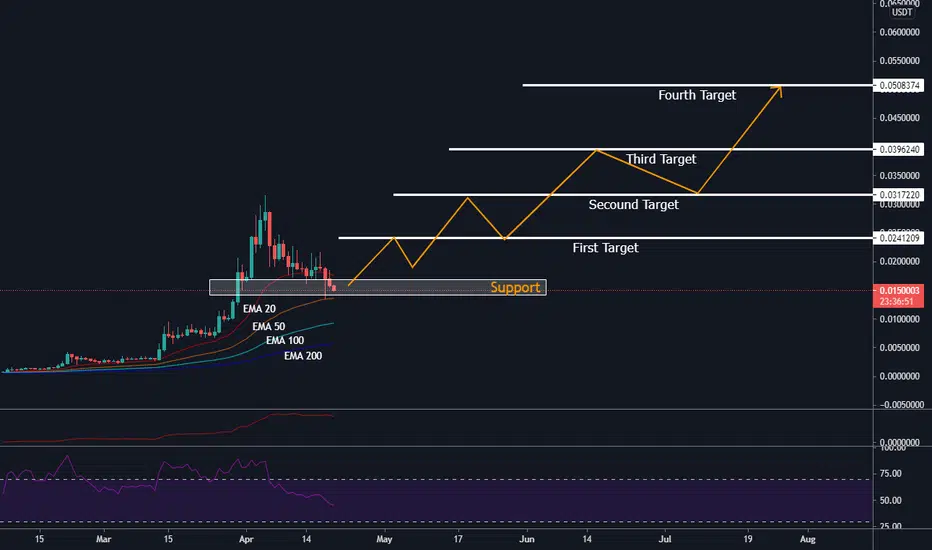
Hot On A Strong Support Level On The Daily I think HOT will continue up after this pullback and now we are on a good strong support level
Reasons why I enter this trade :
1-Good Support Level
2-Good pull back spot on the Ribonacci Retracement
3-Price does not break the moving average of 50 or 100
This is not investment advice, this is my personal opinion, and I am in this trade
Share your idea with me on the comment section
Thank you Guys
BINANCE:HOTUSDT
This is HOTHolochain, compare to the price of DOGE, is significantly undervalued. Remember to consult your financial advisor before investing in Cryptocurrency.