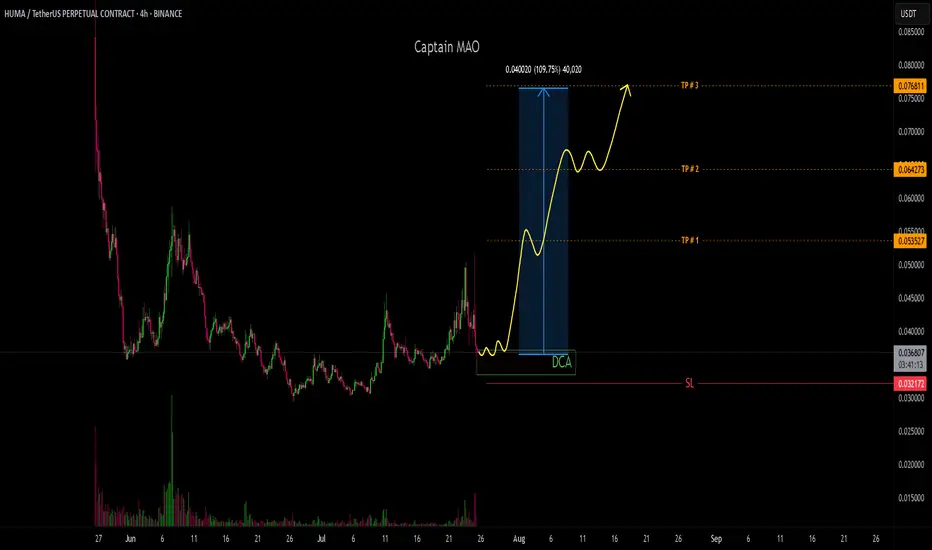
HUMA/USDT +100%The $0.03 zone has acted as a key reversal point for HUMA/USDT, marking the bottom of a significant trend shift. Since then, the price has been printing higher highs (HH) and higher lows (HL) a clear indication of a strong bullish structure in development.
After reaching a local top at $0.05 price is now undergoing a healthy correction, offering a potential buy opportunity within the green box zone. This pullback could act as a springboard for the next impulsive leg toward the $0.07–$0.077 target zone.
HUMAUSDT.P trade ideas
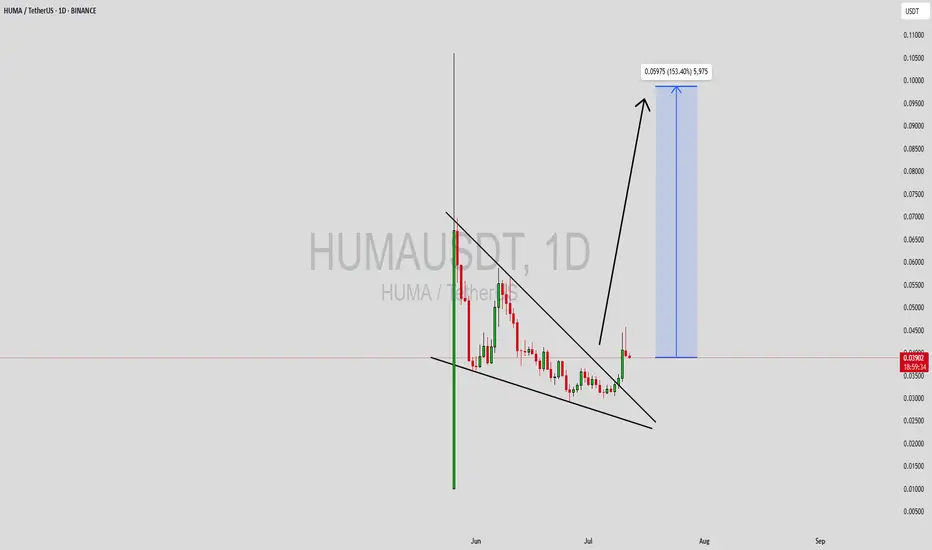
Is it a time fore HUMA? 50% profit - 0.05 USD TargetThe analysis of the HUMAUSDT chart on Binance highlights several key points. The current price is around 0.032764 USD, close to a local low. A clear downtrend is visible since the July peak, but recent days suggest a potential rebound, which could mark the start of an upward movement.
A suggested rise to 0.05 USD (approximately 52% from the current level) is feasible if the price breaks through the resistance around 0.037 USD and stays above the moving average (e.g., 50-day, as shown on the chart). The increase could be supported by rising volume and positive oscillator signals (e.g., RSI above 30, indicating an exit from oversold conditions). A key support level is at 0.03 USD – a drop below this could invalidate the bullish scenario.
I recommend monitoring the breakout above resistance and confirming the trend. For more detailed data, I can perform a DeepSearch to check current market sentiment.
HUMAUSDT Forming Falling WedgeHUMAUSDT is displaying a promising falling wedge pattern, which is widely recognized by traders as a powerful bullish reversal setup. This pattern suggests that the coin may be nearing the end of its consolidation phase, setting the stage for a potential breakout with significant upside. Backed by good trading volume, this scenario looks increasingly likely, with price targets pointing to an impressive gain potential of 140% to 150% in the medium term.
The Huma project is steadily gaining traction among crypto investors due to its innovative use cases and expanding community. As the DeFi ecosystem evolves, projects like Huma that focus on human-centric decentralized solutions are getting more recognition. With growing investor confidence, HUMAUSDT could become one of the standout performers in the altcoin market, especially if the current technical structure plays out as expected.
From a technical perspective, the falling wedge pattern is characterized by descending resistance and support lines converging towards a breakout point. When price finally breaches the upper trendline with convincing volume, it often sparks a rapid upward move as short positions get squeezed and new buyers jump in. Traders should watch for a daily close above resistance and monitor volume levels to validate the breakout.
✅ Show your support by hitting the like button and
✅ Leaving a comment below! (What is You opinion about this Coin)
Your feedback and engagement keep me inspired to share more insightful market analysis with you!
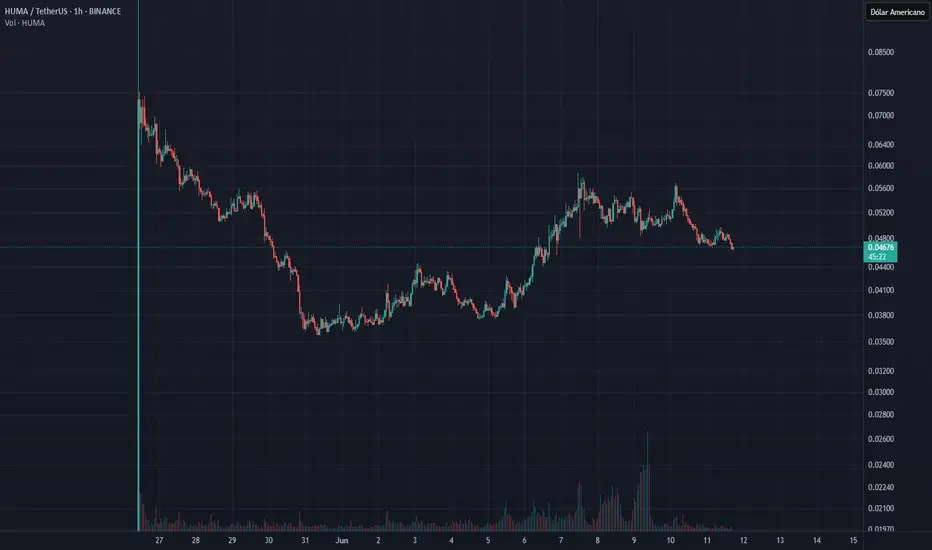
Humanity begins to grow at a tremendous rate.we see if an STC is formed then we open a buy position but if it breaks the support then a possible sell but first we watch the next candlestick which will be

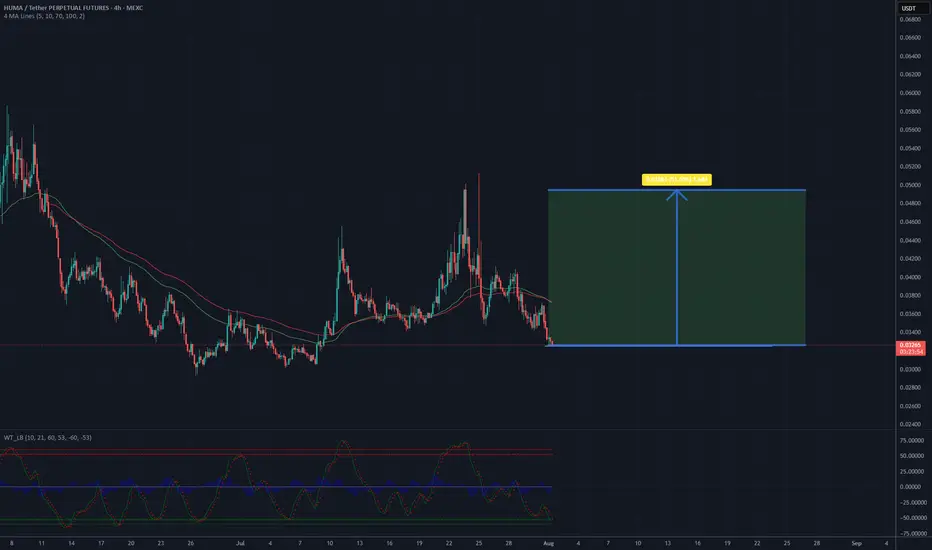
potential entry pointWe're observing a price correction that's currently heading towards the bottom of the wedge pattern. This movement indicates a potential entry point or buying area for investors, specifically between 0.042 and 0.03835.
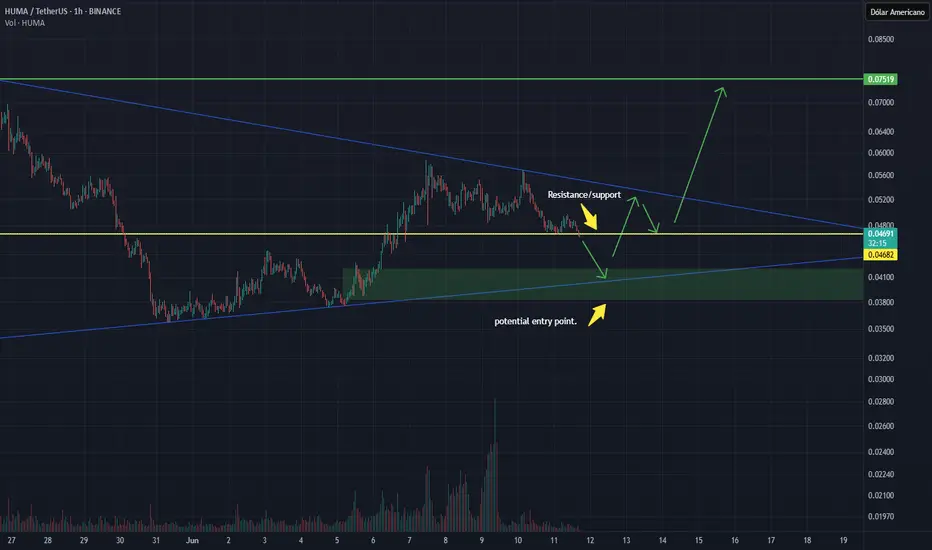
potential entry point.We're observing a price correction that's currently heading towards the bottom of the wedge pattern. This movement indicates a potential entry point or buying area for investors, specifically between 0.042 and 0.03835.