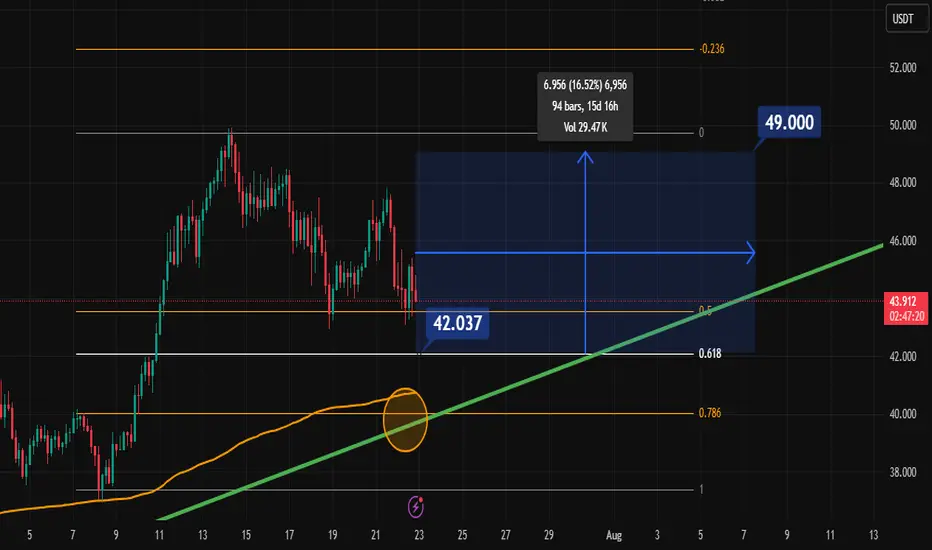
Lingrid | HYPEUSDT Potential Continuation After PullbackKUCOIN:HYPEUSDT is bouncing from a higher low near the 42.070 zone after breaking a descending flag pattern. Price action remains above the ascending support trendline while pressing into a key structure retest. As long as GETTEX:HYPE stays above 42, a bullish leg toward the 49.700 resistance rem
Related pairs

Hypecoin short to $41.139Just now opened up a short position on hypecoin. Aiming for new lows around $41.139
Price is high on weekly tf and seems to be in a correction phase of the market. Lower tf likely to dump down to facilitate this.
Sl: $44.665
Tp1: $42.061
tp2: $41.139

HYPEUSDT Potential Continuation After Pullback
HYPEUSDT
is bouncing from a higher low near the 42.070 zone after breaking a descending flag pattern. Price action remains above the ascending support trendline while pressing into a key structure retest. As long as
HYPE
stays above 42, a bullish leg toward the 49.700 resistance remains likely.

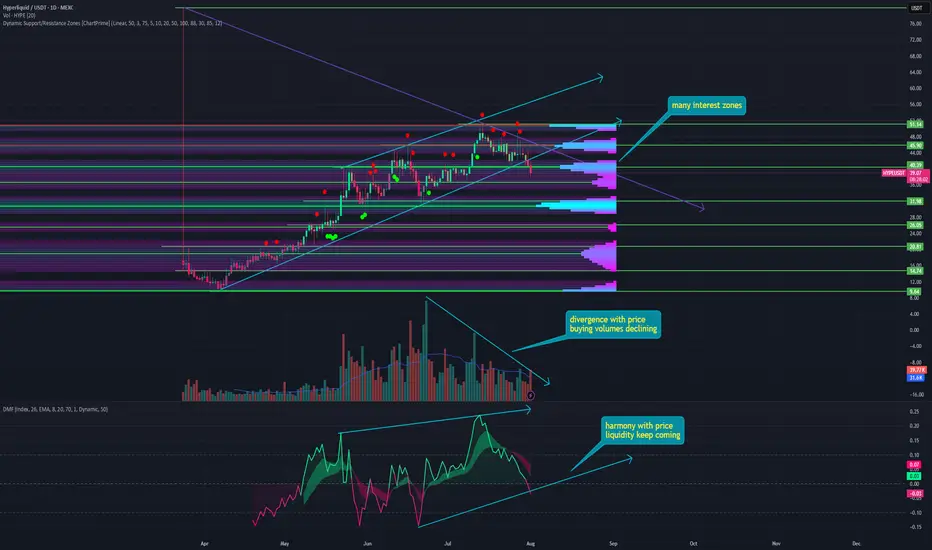
HYPE/USDT Is moving sideways in a tight consolidation rangeHYPE/USDT is moving sideways in a tight consolidation range between $41.00–$45.90. Moderate whale activity is evident from on-chain data, alongside ecosystem factors like TVL at ~$800M and a 54% fee revenue allocation program, but broader market sentiment (e.g., Bitcoin correlation) adds caution.
K

HYPE/USDT: "A++" Long Setup - A Perfect Storm of ConfluenceHello traders,
This analysis covers what I consider to be an "A++" high-probability long setup on HYPE/USDT, viewed on the 9H timeframe. It is rare to see this many powerful technical factors align at once, signaling a potential major bottom and the start of a new bullish leg.
1. Trend & Context

HYPE - a major correction can be expected One of the most interesting tokens of the HYPE cycle. It initially fell to zero, then rebounded and began to set new all-time highs one after another. During corrections, it even outperformed Bitcoin.
But all good things come to an end sooner or later, and for HYPE, the time has probably come to c
Is $Hype worth the hype?Ascending Channel:
- The price has been moving inside a rising (bullish) channel since mid-April 2025.
- If this channel holds as support, the price may bounce upward again, continuing the uptrend.
- If it breaks below the channel, this could signal a trend reversal or deeper correction.
Tips
- Tre

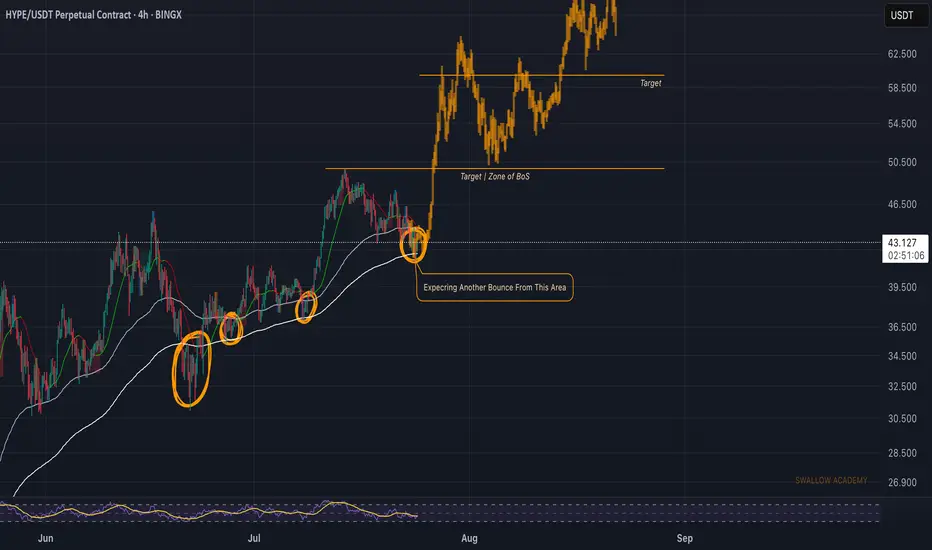
Hyperliquid (HYPE): 200EMA Has Been Holding Trend Very WellHYPE has been respecting that 200 EMA on the 4-hour timeframe pretty well, and once again we have fallen back to that EMA.
We are looking for some kind of BOS on smaller timeframes, which would give us a good buying opportunity and potentially form a new local high on the current timeframe.
Swal
Watch Hyperliquid Surge 18% to $46 Key Resistance LevelHello,✌
let’s dive into a full analysis of the upcoming price potential for Hyperliquid 🔍📈.
KUCOIN:HYPEUSDT is trading within a reliable daily ascending channel and is currently near its lower boundary, where a strong daily support zone has formed. This setup suggests a potential upside of at
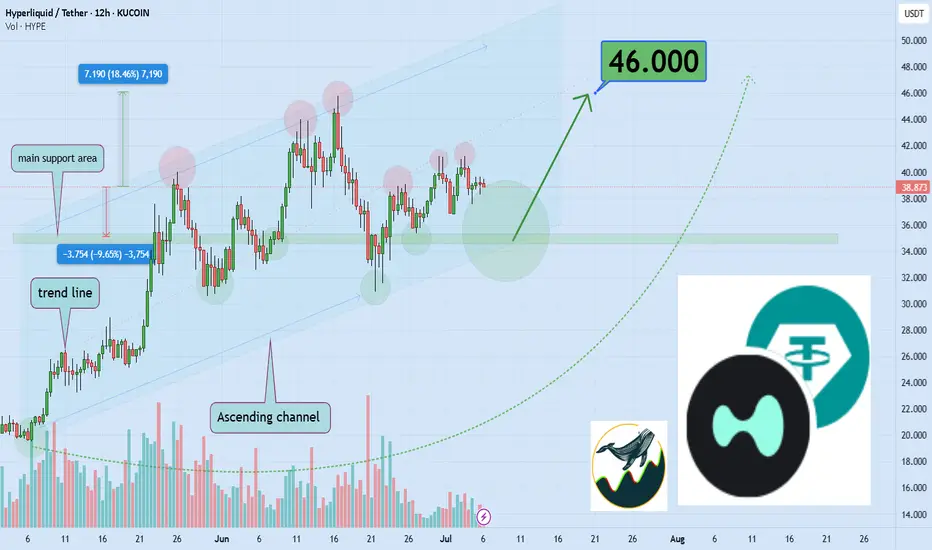
Does Hype Pump from 42 to 49 before August?Well, I have my SPOT chips on that.
I wanna hold on to that in the next 15 days. That is Untill 7th August.
See all ideas
Summarizing what the indicators are suggesting.
Oscillators
Neutral
SellBuy
Strong sellStrong buy
Strong sellSellNeutralBuyStrong buy
Oscillators
Neutral
SellBuy
Strong sellStrong buy
Strong sellSellNeutralBuyStrong buy
Summary
Neutral
SellBuy
Strong sellStrong buy
Strong sellSellNeutralBuyStrong buy
Summary
Neutral
SellBuy
Strong sellStrong buy
Strong sellSellNeutralBuyStrong buy
Summary
Neutral
SellBuy
Strong sellStrong buy
Strong sellSellNeutralBuyStrong buy
Moving Averages
Neutral
SellBuy
Strong sellStrong buy
Strong sellSellNeutralBuyStrong buy
Moving Averages
Neutral
SellBuy
Strong sellStrong buy
Strong sellSellNeutralBuyStrong buy
Displays a symbol's price movements over previous years to identify recurring trends.
Frequently Asked Questions
The current price of Hyperliquid / Tether (HYPE) is 38.223 USDT — it has fallen −7.60% in the past 24 hours. Try placing this info into the context by checking out what coins are also gaining and losing at the moment and seeing HYPE price chart.
Hyperliquid / Tether price has fallen by −10.35% over the last week, its month performance shows a 2.39% increase, and as for the last year, Hyperliquid / Tether has increased by 282.23%. See more dynamics on HYPE price chart.
Keep track of coins' changes with our Crypto Coins Heatmap.
Keep track of coins' changes with our Crypto Coins Heatmap.
Hyperliquid / Tether (HYPE) reached its highest price on Jul 14, 2025 — it amounted to 49.878 USDT. Find more insights on the HYPE price chart.
See the list of crypto gainers and choose what best fits your strategy.
See the list of crypto gainers and choose what best fits your strategy.
Hyperliquid / Tether (HYPE) reached the lowest price of 9.298 USDT on Apr 7, 2025. View more Hyperliquid / Tether dynamics on the price chart.
See the list of crypto losers to find unexpected opportunities.
See the list of crypto losers to find unexpected opportunities.
The safest choice when buying HYPE is to go to a well-known crypto exchange. Some of the popular names are Binance, Coinbase, Kraken. But you'll have to find a reliable broker and create an account first. You can trade HYPE right from TradingView charts — just choose a broker and connect to your account.
Hyperliquid / Tether (HYPE) is just as reliable as any other crypto asset — this corner of the world market is highly volatile. Today, for instance, Hyperliquid / Tether is estimated as 4.08% volatile. The only thing it means is that you must prepare and examine all available information before making a decision. And if you're not sure about Hyperliquid / Tether, you can find more inspiration in our curated watchlists.
You can discuss Hyperliquid / Tether (HYPE) with other users in our public chats, Minds or in the comments to Ideas.