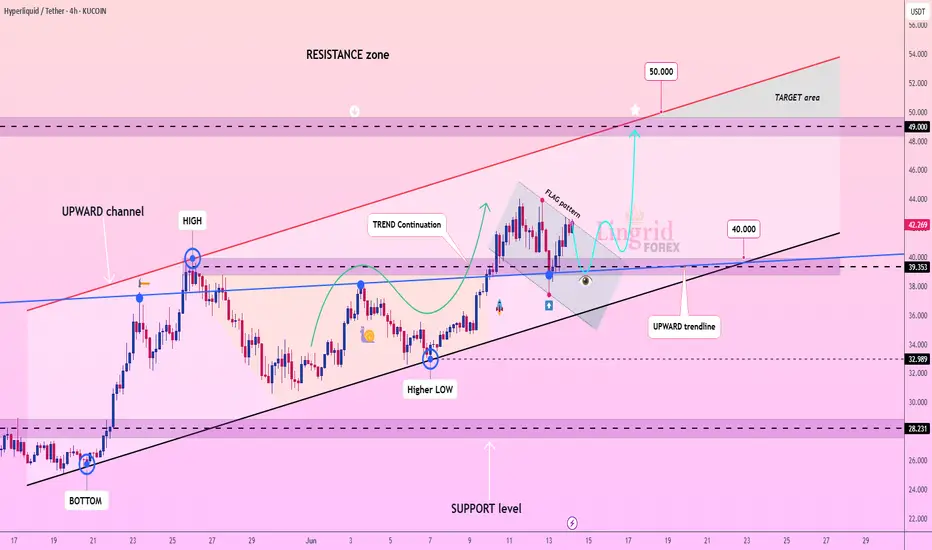
Lingrid | HYPEUSDT bullish Momentum Continuation LikelyKUCOIN:HYPEUSDT is consolidating after a breakout and forming a flag pattern, riding an established upward channel. Price has consistently respected the dynamic support from the trendline and the key horizontal level near 40.00. The recent higher low suggests momentum is intact for a bullish contin
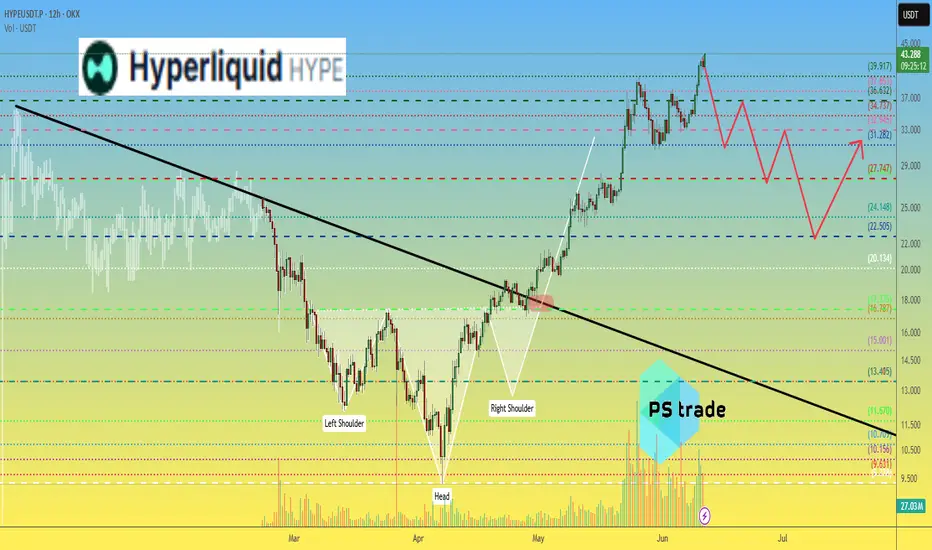
Hyperliquid Correction Exposed, $16.6-$22.5 Range To Be TestedAfter a strong rise there is always a strong correction and I will call this normal market behavior.
Hyperliquid entered the TOP20 altcoins by market capitalization and now sits at #11. Amazing feat.
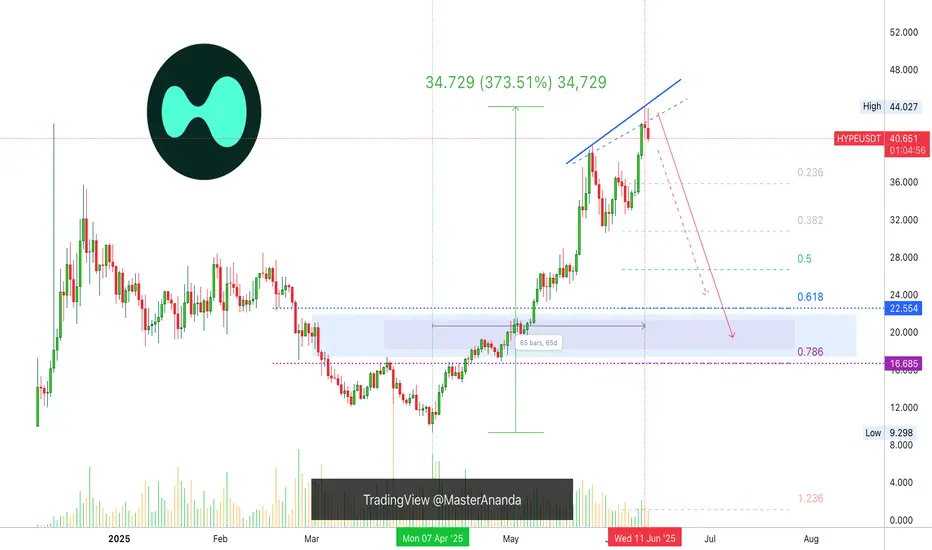
In a matter of 65 days, between 7-April and 11-June, HYPEUSDT grew a very nice 373%.
A correction
$HYPE - Short-term OutlookKUCOIN:HYPEUSDT | 4h
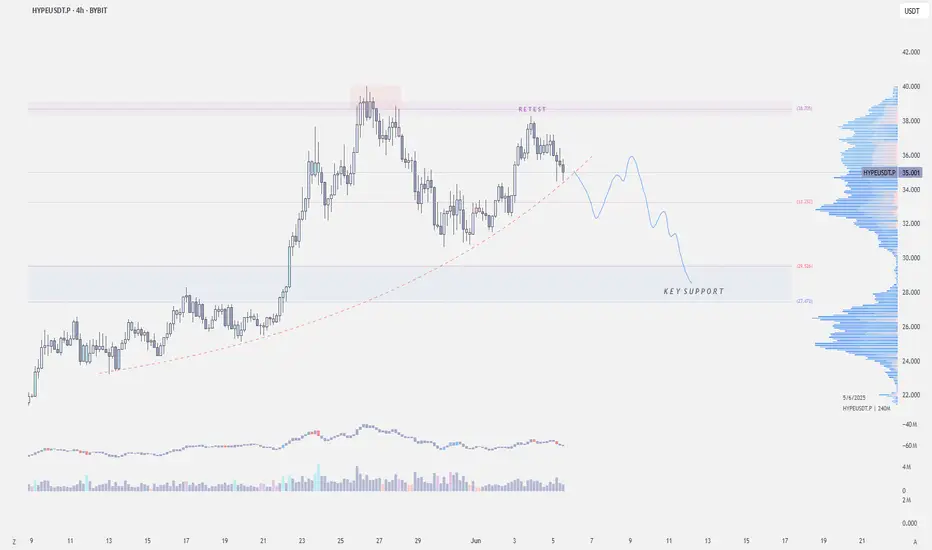
Price already retested the supply zone at $38
Local support is around $32, however, not sure if we'll get a bounce at this level.
If CRYPTOCAP:BTC sweeps the 100k-99k lows, KUCOIN:HYPEUSDT could revisit $30–27 range
Hyperliquid HYPE price analysis🧐 This idea regarding the price of #HYPE is based more on our "intuition", as the project's tokenomics are excellent:
there will be no major coin unlocks this year, and 97% of the commission income of the #hyperliquid exchange will be directed towards the repurchase of its own token.
🤖 We previous
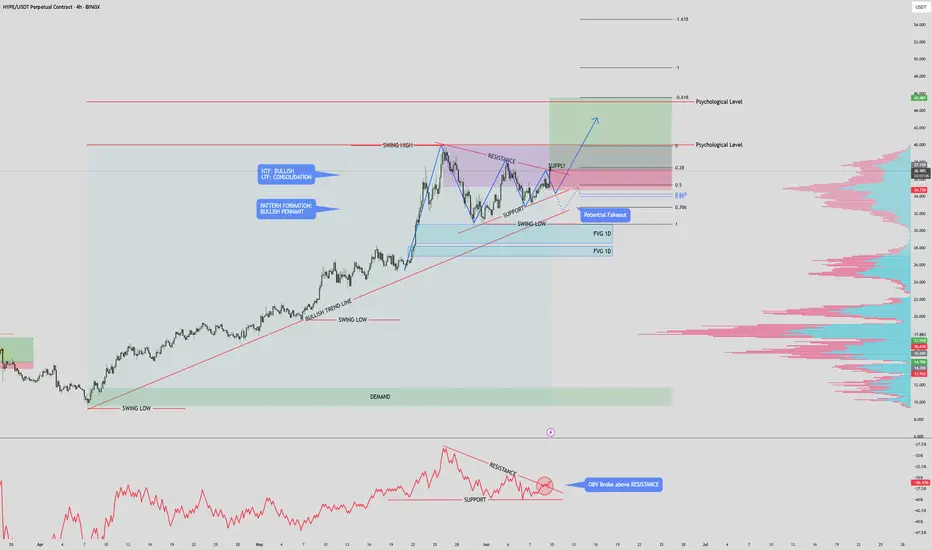
HYPE/USDT – 4H Chart Analysis PUMP TO $50??HYPE/USDT – 4H Chart Analysis
Volume (OBV Indicator):
The On-Balance Volume (OBV) has broken above its local resistance level, indicating a notable increase in bullish volume inflow. This supports the current upward momentum.
Market Structure:
High Time Frame (HTF): Still bullish.
Lower Time
HYPE can it keep us hyped ?Mastering Zones: Your Quick Trading Guide!
Remember the core logic:
🔵 Blue Zone:
PUMPS FROM BLUE (Look for buys!)
DUMPS IF BREAKS BLUE (Consider sells/exit longs!)
🔴 Red Zone:
DUMPS FROM RED (Look for sells!)
PUMPS IF BREAKS RED (Consider buys/enter longs!)
Apply this to your charts for clear sign
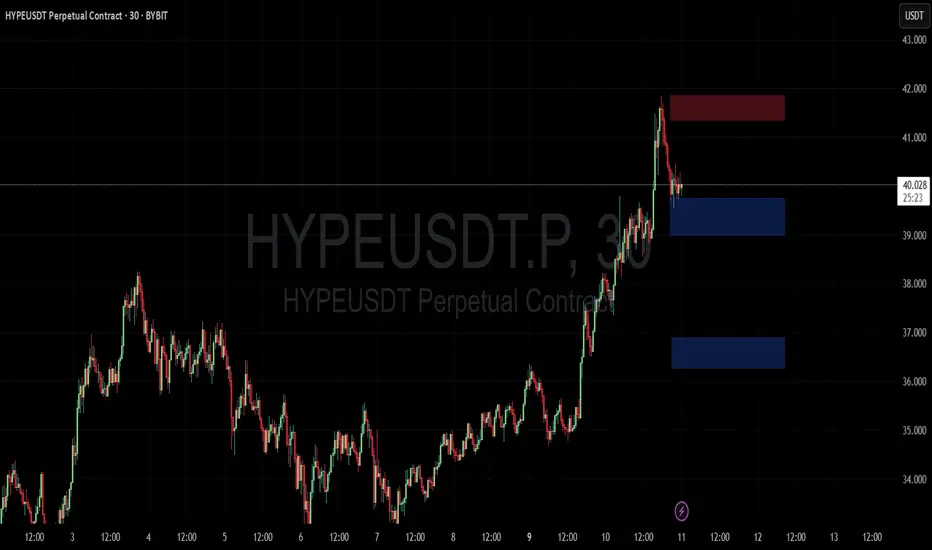
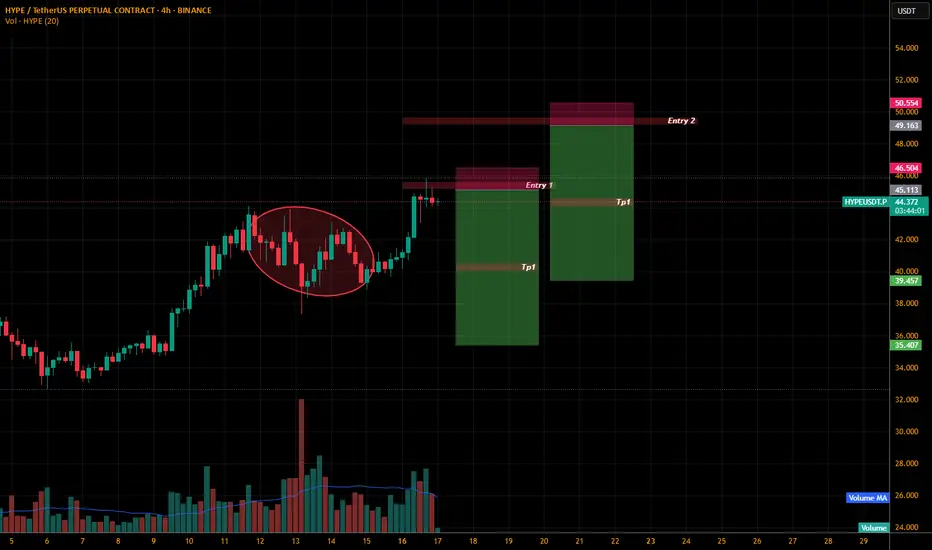
Hypeusdt.pLets wait to short it.
If the current level shows some bearish candles and retest we can short from entry 1 else entry 2
Tp1 has been marked for both of the trades.
DYOR
HYPE/USDT – Symmetrical Triangle BreakoutHYPE/USDT – Symmetrical Triangle Breakout
HYPEUSDT has broken out of a symmetrical triangle pattern, which often signals a strong upcoming move. If the breakout holds above the structure with consistent volume, we could see a continuation toward higher targets.
Symmetrical triangles are neutral pa
Hype's path to $55BYBIT:HYPEUSDT.P is currently forming a wedge shape pattern, is it indicating that it will break out and follow Path A, the blue path? I'm not so sure, I am sure we'll hit $55 either way.
If we take the red path, Path B, we'll come down to some heaviy support which could give us the fuel needed t

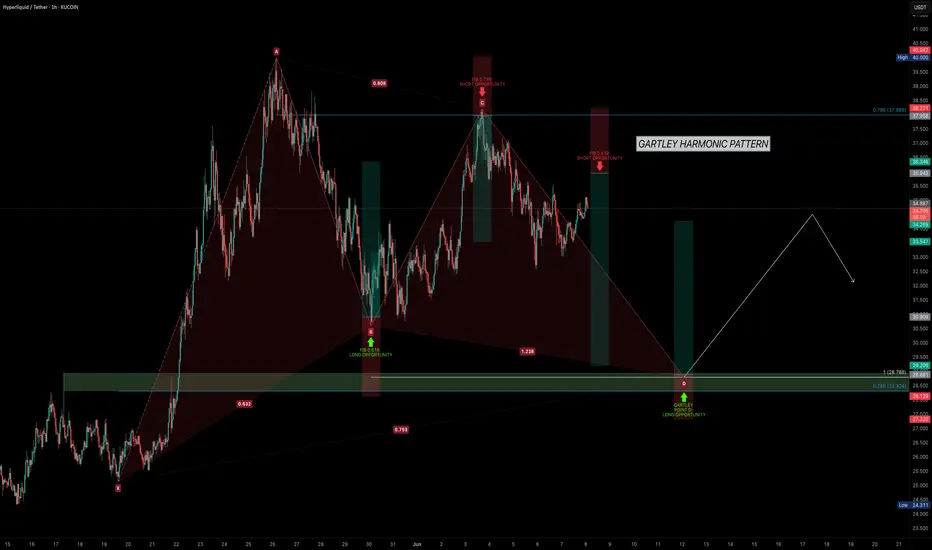
HYPE Precision Trading — Pattern, Patience, ProfitHYPE has shown strong performance since early April, maintaining a clear uptrend. Currently, the market is consolidating in a range between $30 and $40 and it’s setting up for something interesting. Let’s break it down and map the next high-probability trade setup.
Potential Gartley Harmonic Patte
See all ideas
Summarizing what the indicators are suggesting.
Oscillators
Neutral
SellBuy
Strong sellStrong buy
Strong sellSellNeutralBuyStrong buy
Oscillators
Neutral
SellBuy
Strong sellStrong buy
Strong sellSellNeutralBuyStrong buy
Summary
Neutral
SellBuy
Strong sellStrong buy
Strong sellSellNeutralBuyStrong buy
Summary
Neutral
SellBuy
Strong sellStrong buy
Strong sellSellNeutralBuyStrong buy
Summary
Neutral
SellBuy
Strong sellStrong buy
Strong sellSellNeutralBuyStrong buy
Moving Averages
Neutral
SellBuy
Strong sellStrong buy
Strong sellSellNeutralBuyStrong buy
Moving Averages
Neutral
SellBuy
Strong sellStrong buy
Strong sellSellNeutralBuyStrong buy
Displays a symbol's price movements over previous years to identify recurring trends.