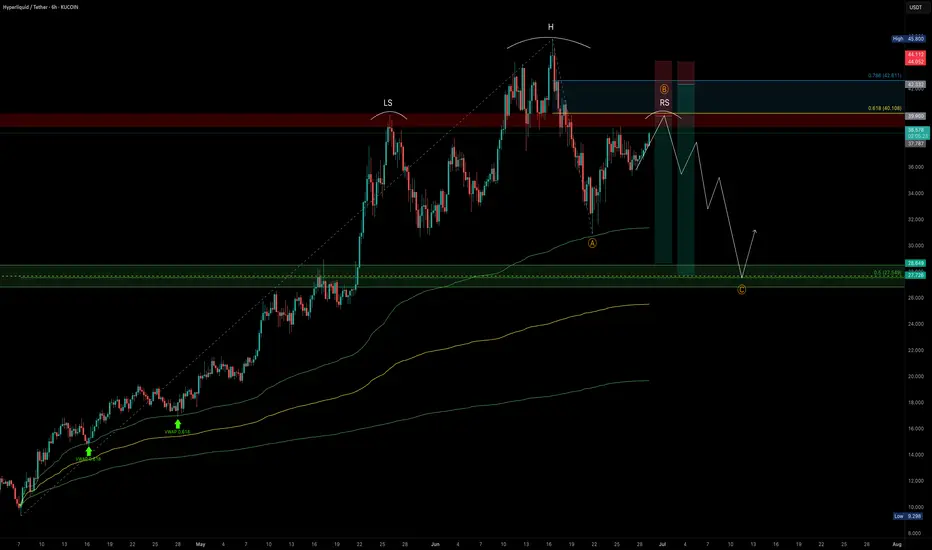
HYPE — How to Combine Fibonacci, VWAP and Market StructureAfter an explosive +392% rally in just 70 days — from $9.298 to a peak of $45.8 — HYPE has entered a consolidation range as expected. Structurally, this appears to be a 5-wave impulse now transitioning into a corrective ABC pattern. Based on current structure, we may now be forming wave B.
What’s
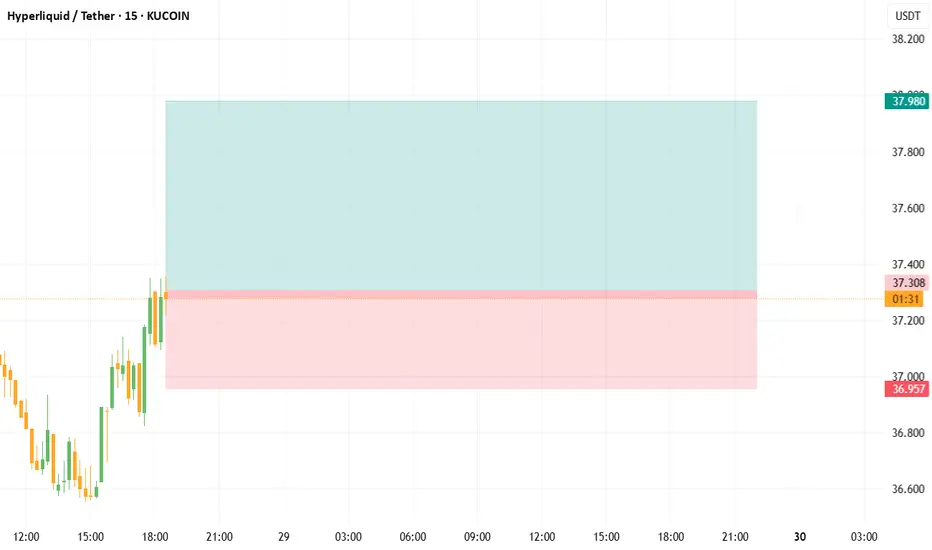
HYPE/USDT 15-minute high win scalping signals are as follows- Signal: LONG
- Entry: 37.260 ~ 37.360
- Take Profit: 37.680, 37.980
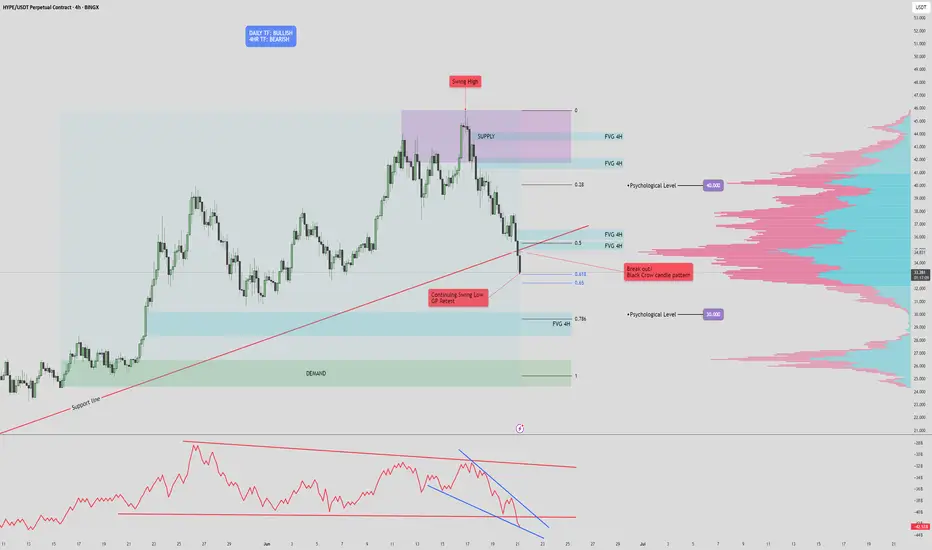
HYPE/USDT Technical Analysis (4H Chart)🔍 HYPE/USDT Technical Analysis (4H Chart)
High Time Frame (Daily): Bullish
Despite recent pullbacks, the overall trend remains bullish on the daily timeframe. However, current price action suggests a potential fakeout or legitimate breakdown, as we test key structural and volume-based supports
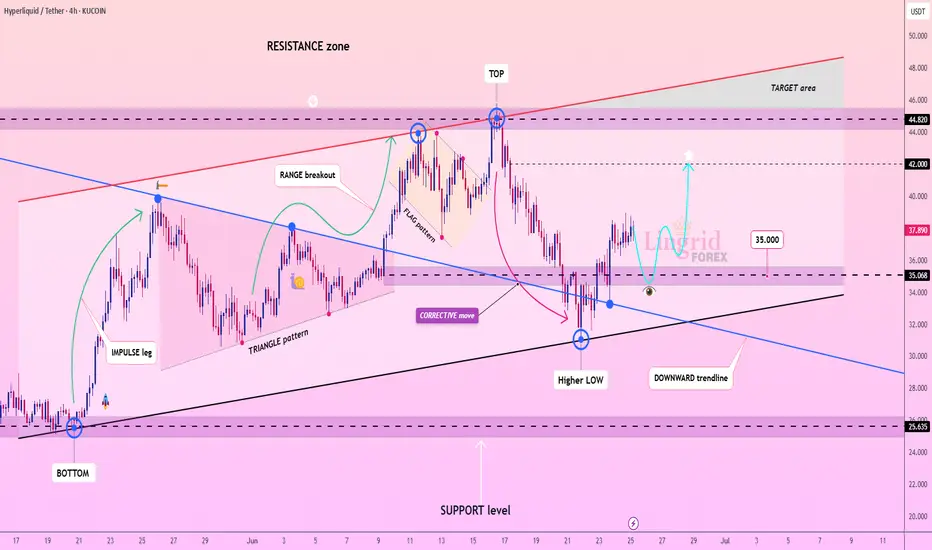
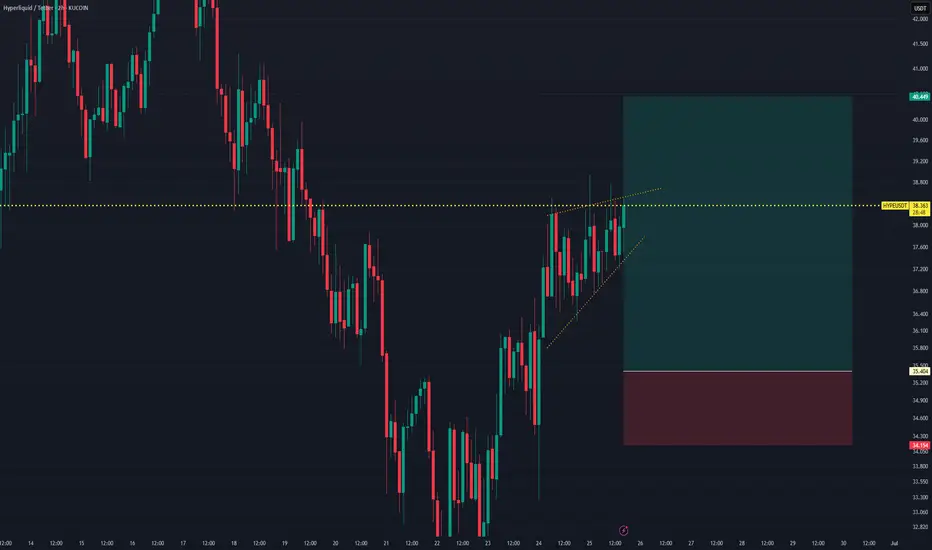
Lingrid | HYPEUSDT potential Long After Correction in the MarketKUCOIN:HYPEUSDT is attempting to recover from a corrective dip, forming a higher low above the upward trendline and stabilizing near the 35.0 support zone. Price is currently testing a minor resistance and may confirm a bullish reversal if the structure builds a higher high above 38.5. A breakout
HYPEUSDT Long Setup After Bullish CompressionHYPEUSDT has formed a bullish ascending triangle — a price pattern suggesting an upward breakout. Price action shows tight compression with higher lows, indicating aggressive buyers stepping in.
The current long position is taken from a pullback entry at $35.404, just above the ascending support. T
HYPE’s Triangle Is Tightening! Get Ready for What’s NextYello, Paradisers! Are you watching what #HYPE is doing while the rest of the market barely holds on? We've been talking about this for a while, some altcoins are setting up for their next big move, and HYPE just might be leading the pack.
💎While the broader crypto market remains in a corrective or

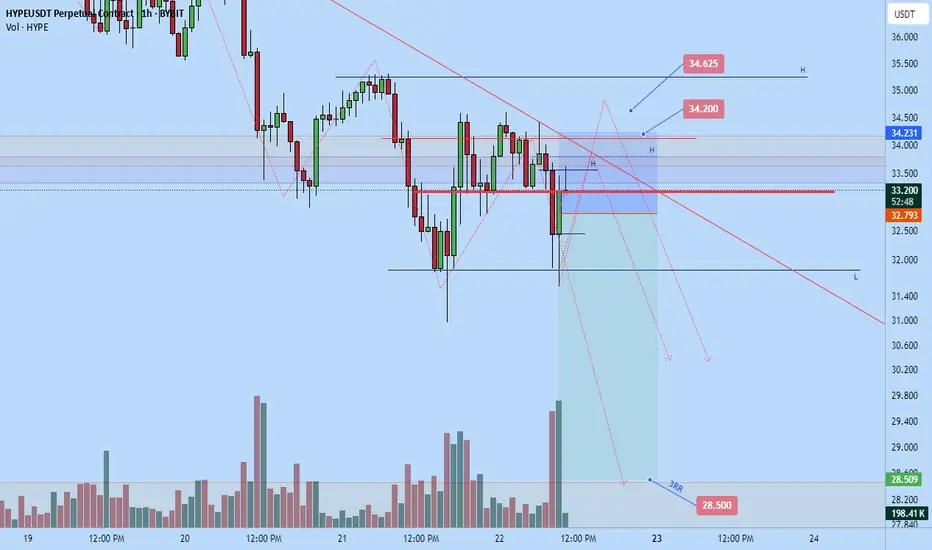
Hypecoin short to $28.5Hypecoin been non correlating with btc more so than other altcoins, pumping while btc is dumping and doing its own thing. Though It seems to be quite high structurally on the weekly timeframe and likely to continue dumping some more to the down side around $28.5 prior monthly resistance for a retest
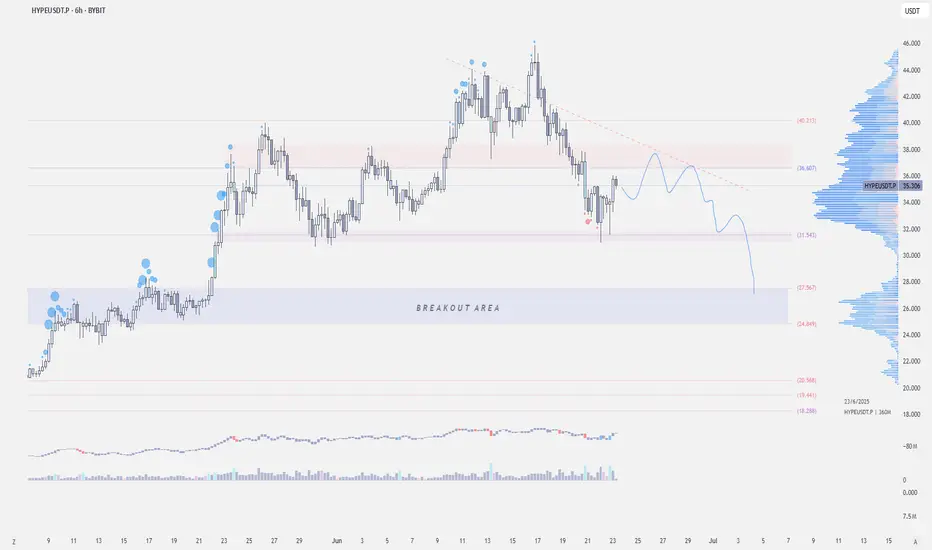
$HYPEUSDT - LTF OutlookKUCOIN:HYPEUSDT | 6h
$30 is holding for now, but if it can’t get back above $37.5–$38 soon, we might see it trading back to the $27–24 breakout zone
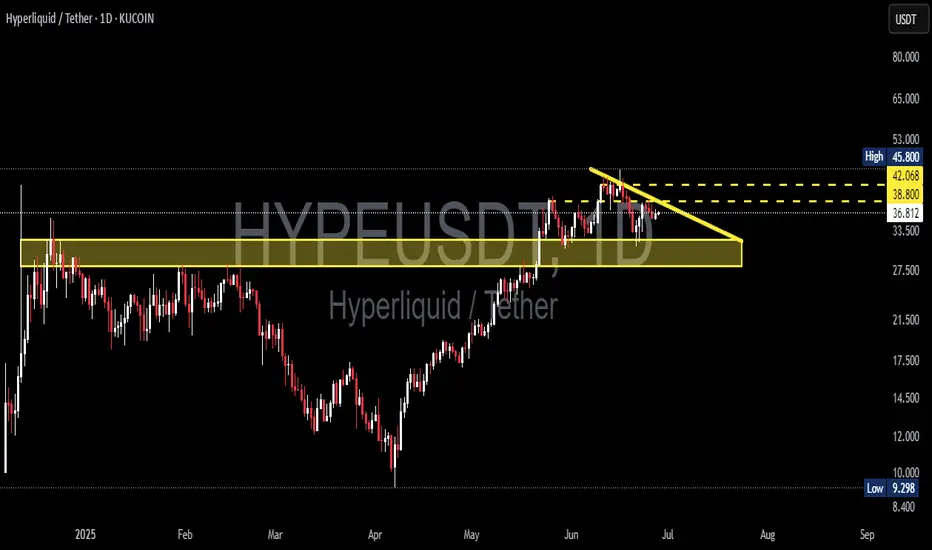
HYPE/USDT Ready for a Breakout? Watch These Key LevelsAnalysis Description:
The HYPE/USDT pair is currently forming a descending triangle pattern on the 1D timeframe — a classic technical setup that often signals a strong upcoming price move, either upward or downward.
🔶 Strong Support Block:
The yellow horizontal zone between 33.500 – 36.785 USDT rep
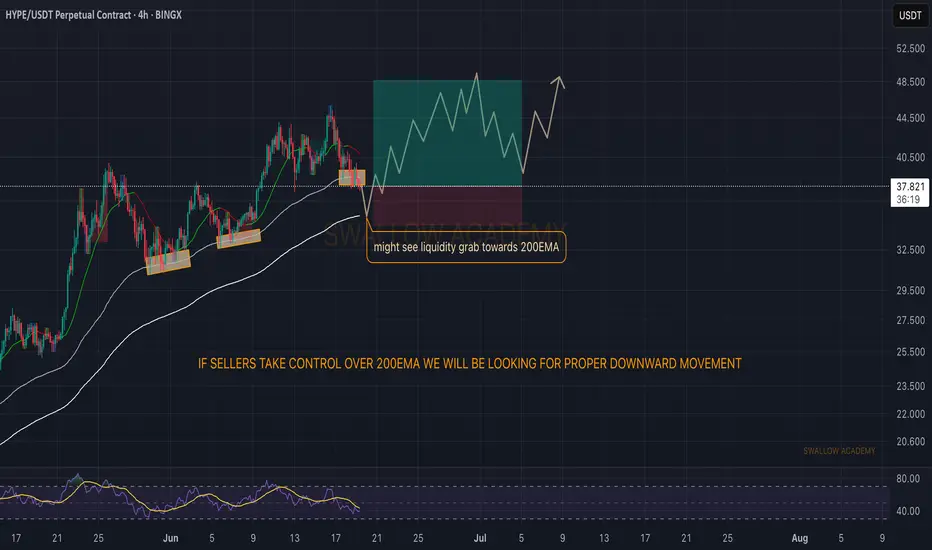
Hyperliquid (HYPE): Good Buying Opportunity or Great Dump ?Hyperliquid coin has been gliding the EMAs too smoothly, where we are seeing strong buyside dominance. Just like last time we are going to keep an eye on EMAs (Specially the 200) for any possible breakdowns that might trigger bigger movement to lower zones, but while price stays above that EMA we ar
See all ideas
Summarizing what the indicators are suggesting.
Oscillators
Neutral
SellBuy
Strong sellStrong buy
Strong sellSellNeutralBuyStrong buy
Oscillators
Neutral
SellBuy
Strong sellStrong buy
Strong sellSellNeutralBuyStrong buy
Summary
Neutral
SellBuy
Strong sellStrong buy
Strong sellSellNeutralBuyStrong buy
Summary
Neutral
SellBuy
Strong sellStrong buy
Strong sellSellNeutralBuyStrong buy
Summary
Neutral
SellBuy
Strong sellStrong buy
Strong sellSellNeutralBuyStrong buy
Moving Averages
Neutral
SellBuy
Strong sellStrong buy
Strong sellSellNeutralBuyStrong buy
Moving Averages
Neutral
SellBuy
Strong sellStrong buy
Strong sellSellNeutralBuyStrong buy
Displays a symbol's price movements over previous years to identify recurring trends.