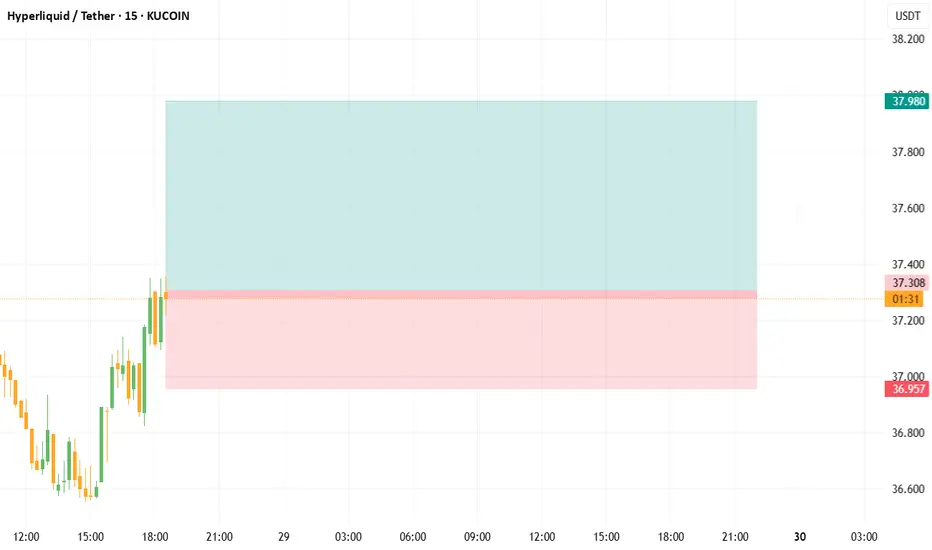
HYPE/USDT 15-minute high win scalping signals are as follows- Signal: LONG
- Entry: 37.260 ~ 37.360
- Take Profit: 37.680, 37.980
HYPEUSDT.P trade ideas
HYPE/USDT Technical Analysis (4H Chart)🔍 HYPE/USDT Technical Analysis (4H Chart)
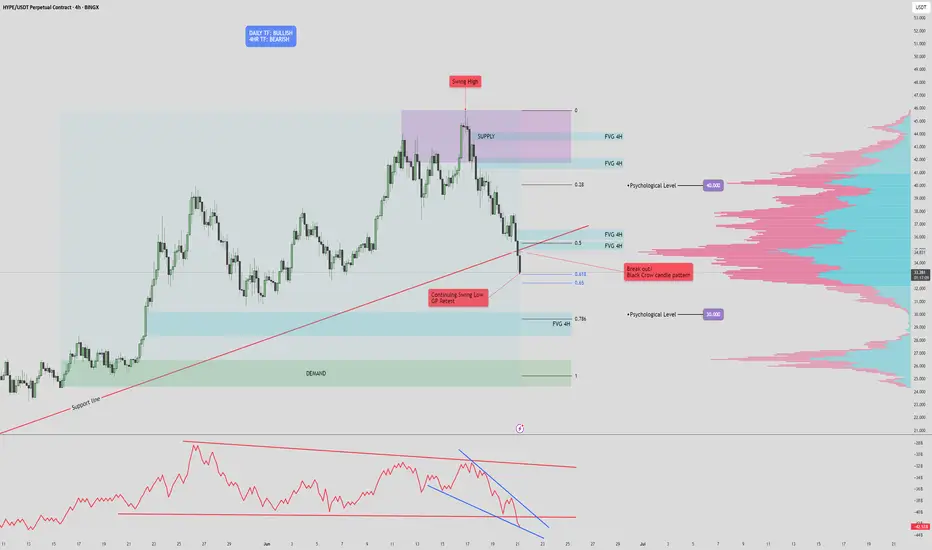
High Time Frame (Daily): Bullish
Despite recent pullbacks, the overall trend remains bullish on the daily timeframe. However, current price action suggests a potential fakeout or legitimate breakdown, as we test key structural and volume-based supports.
Short-Term Time Frame (4H): Bearish
The 4-hour chart displays clear bearish pressure, confirmed by the Three Black Crows candlestick pattern. This signals sustained selling interest and supports the current downward move.
🧱 Key Zones
Supply Zone: $41.7 – $45.9
Strong resistance marked by prior selling pressure and overlapping FVGs.
Demand Zone: $24.4 – $26.3
Historical area of buying support, aligned with a low-volume node and an unfilled FVG.
📏 Fair Value Gaps (FVGs)
Above Price:
Four 4H FVGs act as upside inefficiencies, offering targets in a bullish recovery:
~$34.9
~$36.6
~$37.8
~$40.0 (psychological level & POC cluster)
Below Price:
One major 4H FVG remains unfilled, directly above the demand zone.
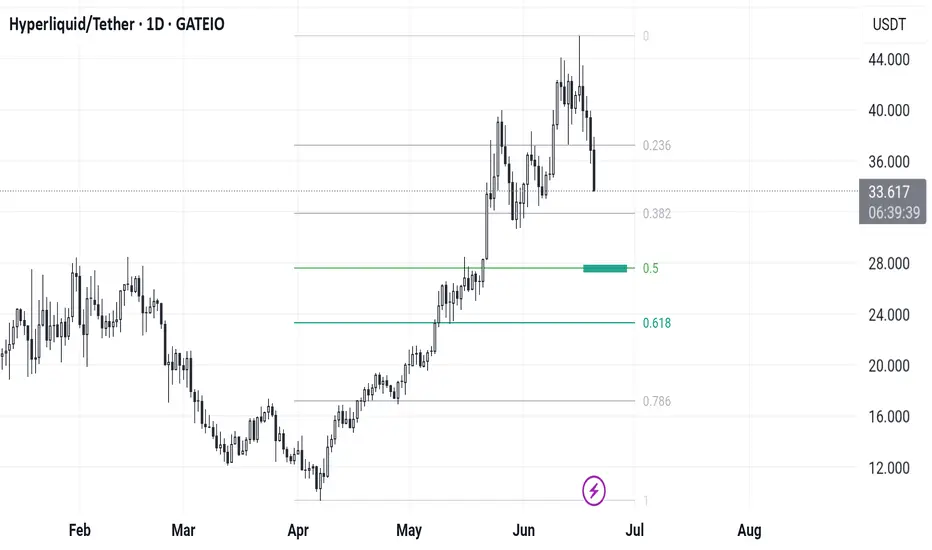
📐 Fibonacci Analysis
Price is testing the Golden Pocket (0.618–0.65) from the recent swing low to high.
A clean break below this area (with confirmation) targets the unfilled FVG around $30, and potentially the demand zone ($24.4–$26.3).
📉 Volume Profile Insight
Volume is clustered around $34–$37, indicating strong past market participation.
Very low volume between $29–$30, creating a volume void — if price loses support at the FVG and golden pocket, it could rapidly drop into the demand zone.
🔻 OBV Analysis (Volume Momentum)
OBV has broken below a larger rising wedge, confirming bearish divergence.
A falling wedge is now forming within OBV.
Break below this wedge: Confirms further price breakdown.
Reclaim of the larger wedge trendline: Suggests potential bullish reversal.
✅ Trade Scenarios
🔺 Bullish Scenario
Trigger: Bullish reversal pattern at the golden pocket (e.g., double bottom, falling wedge, inverse H&S) + OBV recovery.
Entry: Upon confirmation around $32.5.
Targets:
$34.9 (FVG)
$36.6 (FVG)
$37.8 (FVG)
$40.0 (psychological)
Stop: Below $30 or recent swing low (tight below FVG).
🔻 Bearish Scenario
Trigger : Confirmed breakdown of golden pocket & 4H FVG with OBV falling wedge breakdown.
Entry : Below $32.5 with confirmation (e.g., retest or strong momentum candle).
Targets:
$30.0 (psychological level)
$28.5 (FVG zone)
$26.3 → $24.4 (Demand zone)
Stop : Above golden pocket resistance (~$33.8–$34.2).
📝 Conclusion: The market is at a pivotal point. A confirmed break below $32.5 could accelerate selling due to the volume gap, while a strong bullish reaction from the golden pocket could drive a recovery toward $40. Always wait for confirmation before entering either scenario.
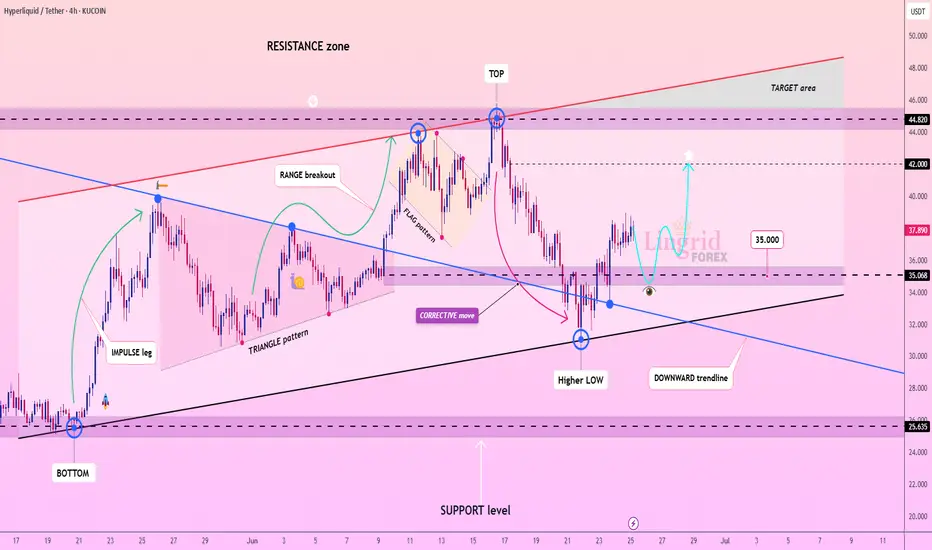
Lingrid | HYPEUSDT potential Long After Correction in the MarketKUCOIN:HYPEUSDT is attempting to recover from a corrective dip, forming a higher low above the upward trendline and stabilizing near the 35.0 support zone. Price is currently testing a minor resistance and may confirm a bullish reversal if the structure builds a higher high above 38.5. A breakout toward the 42.0 level aligns with the projection, possibly extending into the 44.8 target area.
📈 Key Levels
Buy zone: 35.0 – 36.0
Sell trigger: break below 35.0
Target: 42.0 – 44.8
Buy trigger: bullish breakout from local structure
💡 Risks
Rejection below 38.5 may lead to further downside
Broad resistance near 42.0 could stall momentum
A breakdown of trendline support would invalidate the bullish setup
If this idea resonates with you or you have your own opinion, traders, hit the comments. I’m excited to read your thoughts!
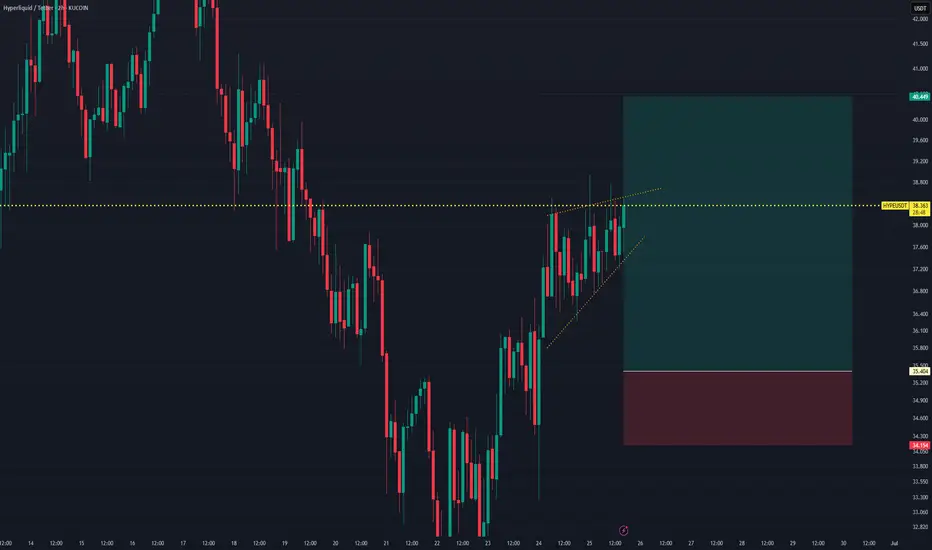
HYPEUSDT Long Setup After Bullish CompressionHYPEUSDT has formed a bullish ascending triangle — a price pattern suggesting an upward breakout. Price action shows tight compression with higher lows, indicating aggressive buyers stepping in.
The current long position is taken from a pullback entry at $35.404, just above the ascending support. The trade targets a breakout move toward $40.449, aligned with previous highs and psychological resistance.
Trade Setup:
- Entry: $35.404
- Stop Loss: $34.154
- Take Profit: $40.449
- Risk:Reward Ratio: 1:4.04
This setup anticipates a breakout continuation. A strong bullish candle above $38.30 could serve as confirmation. A break below the ascending structure would invalidate the trade.
Bias: Bullish breakout continuation
Trigger: Ascending triangle formation with compression toward resistance
Invalidation: Break below $34.154 (structure low)
HYPE’s Triangle Is Tightening! Get Ready for What’s NextYello, Paradisers! Are you watching what #HYPE is doing while the rest of the market barely holds on? We've been talking about this for a while, some altcoins are setting up for their next big move, and HYPE just might be leading the pack.
💎While the broader crypto market remains in a corrective or consolidative phase, HYPE has quietly maintained strength, pushing above a critical support/resistance zone and now forming a converging triangle pattern, a classic setup for explosive movement.
💎#HYPEUSDT is in a sideways consolidation phase. Price action is calm on the surface, but what’s actually unfolding is a textbook build-up. The next move could be a retest of the EMA-50, which sits near the 31.480 level. That zone also aligns with a moderate support area, making it a solid demand zone for bulls to reload and re-accumulate.
💎Even if HYPE slides lower into the 30.00 to 28.00 strong support region, it wouldn’t damage the structure. In fact, such a move would shake out late longs and weak hands, further strengthening the overall foundation. A drop into that zone should not be seen as failure, but rather as a potential springboard for the next impulsive wave.
💎The key to watch remains the descending resistance at the 37.20 level. Once this is broken with volume and conviction, the price is likely to push toward 40.05—a moderate resistance. But don’t get it twisted. That’s not where the bulls are aiming to stop. The structure, momentum, and higher-timeframe alignment all suggest this isn’t the final destination. Bulls are likely targeting the $47–$50 range, an area that isn’t just technical, it’s psychological mark as well.
Paradisers, strive for consistency, not quick profits. Treat the market as a businessman, not as a gambler.
MyCryptoParadise
iFeel the success🌴

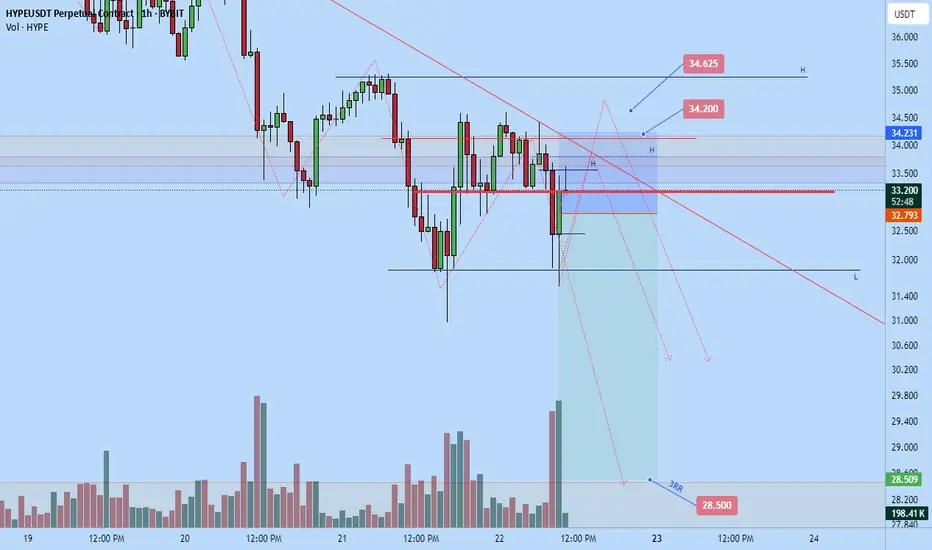
Hypecoin short to $28.5Hypecoin been non correlating with btc more so than other altcoins, pumping while btc is dumping and doing its own thing. Though It seems to be quite high structurally on the weekly timeframe and likely to continue dumping some more to the down side around $28.5 prior monthly resistance for a retest. There I anticipate enough demand might come in to drive the price back up.
I hopped in around $32.79 area in anticipation that the current 4hr candle will wick back down. It has pushed up a bit more than anticipated quite quickly since entry which isn't particularly good but still have 1hr before 4hr candle close- Next hr will decide if we really going down or the move will get delayed and invalidated soon.
If you're just seeing this you have better entry and can use better invalidation with stop around $34.8 for a more conservative position.
On personal account my stop is at $34.62 area
On another its at $34.2
Time sensitive
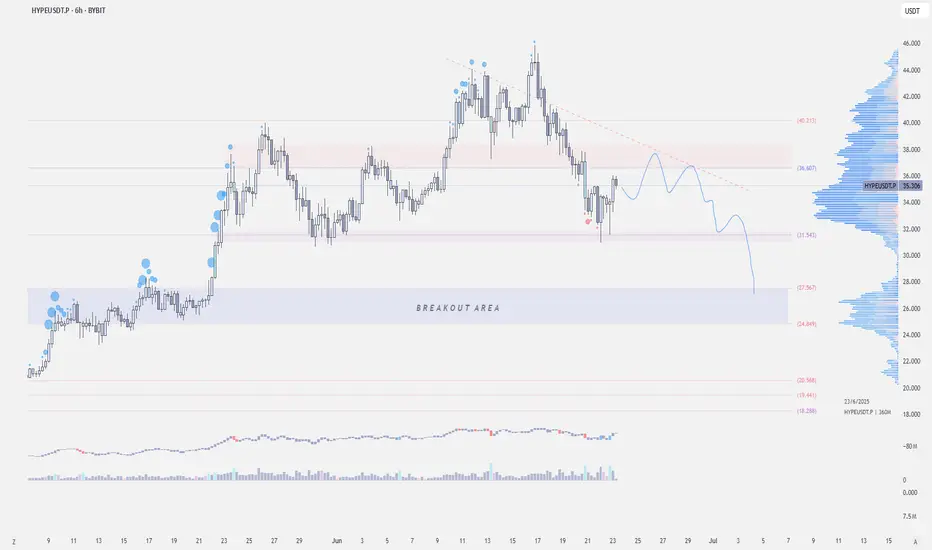
$HYPEUSDT - LTF OutlookKUCOIN:HYPEUSDT | 6h
$30 is holding for now, but if it can’t get back above $37.5–$38 soon, we might see it trading back to the $27–24 breakout zone
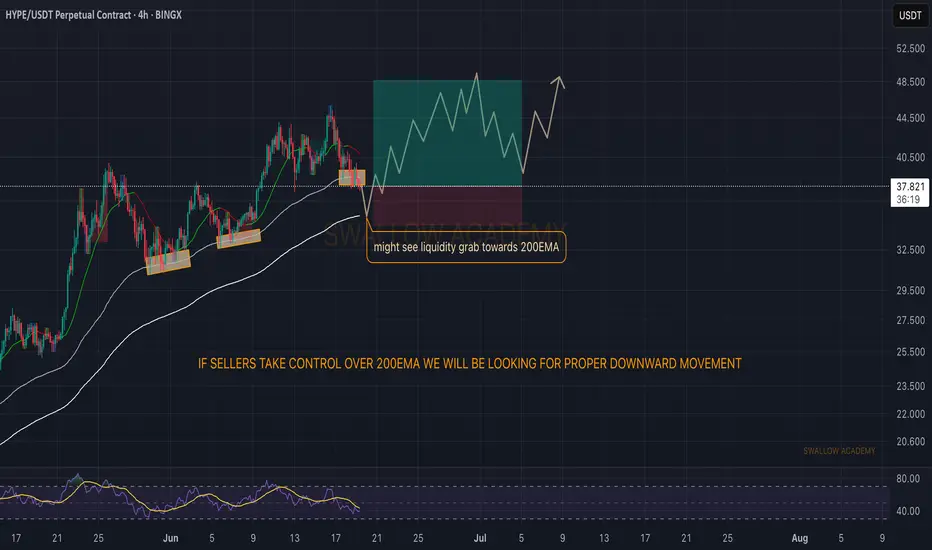
Hyperliquid (HYPE): Good Buying Opportunity or Great Dump ?Hyperliquid coin has been gliding the EMAs too smoothly, where we are seeing strong buyside dominance. Just like last time we are going to keep an eye on EMAs (Specially the 200) for any possible breakdowns that might trigger bigger movement to lower zones, but while price stays above that EMA we are looking for further movement to upper zones, just like previouse times.
Swallow Academy
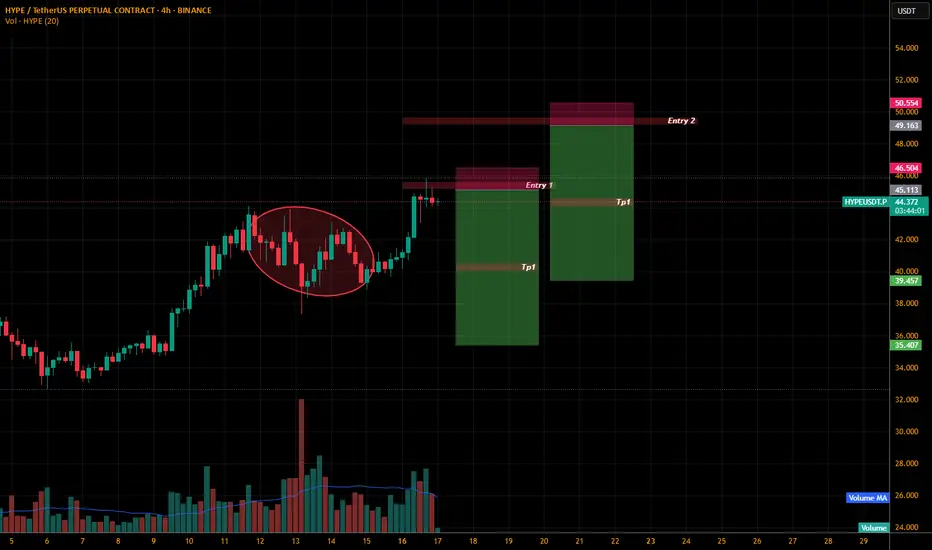
Hypeusdt.pLets wait to short it.
If the current level shows some bearish candles and retest we can short from entry 1 else entry 2
Tp1 has been marked for both of the trades.
DYOR
Hype's path to $55BYBIT:HYPEUSDT.P is currently forming a wedge shape pattern, is it indicating that it will break out and follow Path A, the blue path? I'm not so sure, I am sure we'll hit $55 either way.
If we take the red path, Path B, we'll come down to some heaviy support which could give us the fuel needed to get to $55
Out of all of the oscillators I was using, all except the chop zone on the daily mind you, were in bearish mode. So logically one would choose the red Path B right?
I can't wait to see how this plays out, shall we dip some and buy some more BYBIT:HYPEUSDT.P on Path B or experience more of a continuation of the current trendline to $55?
Let me know what you think in the comments, that'ls all for today, let's go HYPE!!! straight to $55!

Where Is The Real HypeThis latest crypto cycle has been the hardest to navigate for even the most experienced crypto traders. No real Altcoin season has transpired, maybe best reflected by the fact that over 2 years into it, Ethereum still has not seen a new All-Time-High. That is not to say that there have not been winners. Hyperliquid, the 'decentralized' perpetuals exchange has taken the market by storm. The word 'decentralized' is in inverted commas as the extent of decentralization for the platform is debatable but starting with UX and product first, and arguably bringing in decentralization later, has so far proven to be winning strategy. The performance of the project's native token HYPE has been one of the few bright lights in this market.
HYPE, the token, launched in what is an immaculate conception in crypto terms: no VCs who got in at better price levels, an airdrop that heavily rewarded the community, revenue-driven token buybacks. The project is a case-study on how to succeed in today's crypto world. Perpetuals trading is one of the core use-cases for crypto. Enabling perpetuals trading for jurisdictions where it is banned for retail via 'decentralization' is regulatory arbitrage at its best. Luckily, regulation-wise, the stars seem to have aligned. At the same time, crypto traders have been overwhelmed by large supplies of tokens dumped on the market at unfavorable terms for retail investors. Non-crypto retail on the other hand has been burned one too many times by mingling in our industry and has so far stayed out. Consequently, the vast majority of crypto tokens has simply not gone anywhere in this cycle so far.
Where non-crypto retail funds go becomes visible when looking at the performance of various stock indices, pennystocks and even crypto-related stocks including Microstrategy. Even despite economic uncertainty and war, stocks are at all-time highs. On the institutional side, funds and tradfi have been playing the crypto-leverage game via instruments they are familiar with. We have spoken about Michael Saylor's strategy of borrowing funds to buy more Bitcoin many times in this newsletter previously. Other companies have copied the Microstrategy playbook in increasing numbers. 151 publicly traded companies now hold Bitcoin.
Meanwhile, the less 'degen' side of tradfi has focused its attention on stablecoins. The so-called 'GENIUS' Act to regulate stablecoins has just passed the US Senate with bi-partisan support. The performance of Circle's stock after its recent IPO is the best example for the growing Tradfi excitement over Stablecoins. A 5x return in a little over a week may remind crypto traders of happier days. It is certainly not the norm in Tradfi world. Stripe, the Fintech giant, has been acquiring crypto infra players including Bridge and Privy. Shopify has enabled stablecoin payments. Adoption comes slowly, then all at once.
As the worlds of crypto and Tradfi continue to merge, opportunities for traders will continue to present themselves. We may be facing a quieter period in crypto markets right now. But the lessons of HYPE's immaculate conception are being studied by teams and founders around the industry. Inevitably, the possibilities of permission-less onchain finance will sooner or later lure back the traders. Until then, good luck looking for the next hype.
$HYPE - Attention Extreme reached. Now it is over.RSI divergence. On weekly + 3D
+ 3d gravestone.
Good short setting up, back to $20/.

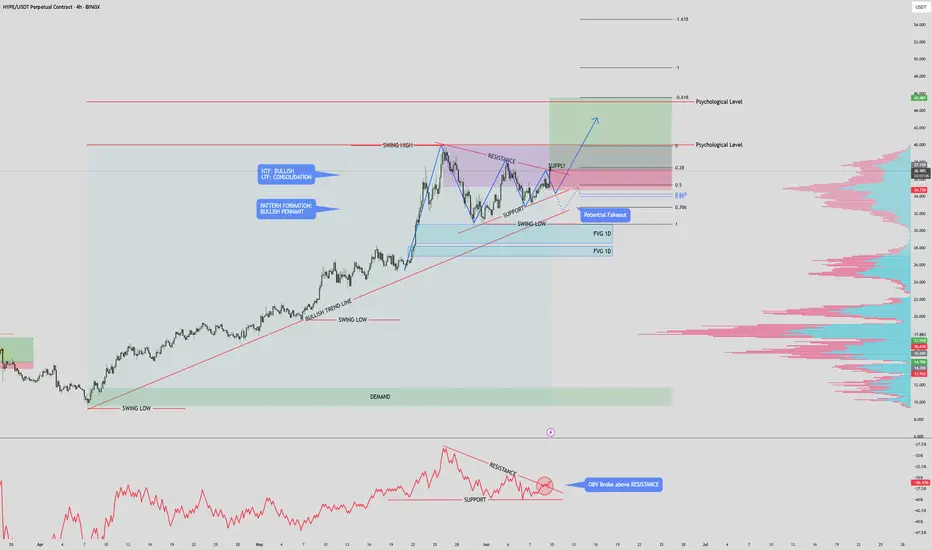
HYPE/USDT – 4H Chart Analysis PUMP TO $50??HYPE/USDT – 4H Chart Analysis
Volume (OBV Indicator):
The On-Balance Volume (OBV) has broken above its local resistance level, indicating a notable increase in bullish volume inflow. This supports the current upward momentum.
Market Structure:
High Time Frame (HTF): Still bullish.
Lower Time Frame (LTF): Currently consolidating within a bullish pennant pattern.
Price has recently closed just above the pennant’s resistance line, suggesting a potential breakout and continuation of the bullish trend.
Key Zones & Levels:
Supply Zone: Price is currently testing this zone. A successful hold and breakout above the previous swing high would confirm bullish continuation.
Fair Value Gaps (FVGs):
A small FVG exists just beneath current price between key support/resistance levels. This may act as a short-term magnet for price (potential retracement).
Two larger FVGs on the 1D time frame lie below the current support and prior swing low. If price moves into these levels, it would likely be a liquidity sweep, trap, or fakeout scenario.
Psychological Levels: $40.00 and $45.00 are the next logical upside targets if bullish momentum continues beyond the swing high.
Trade Setup:
Entry: At the 0.28 Fibonacci retracement level.
Stop Loss: Just below the 0.5 Fibonacci level.
Take Profit (Partial): At the 0.618 Fibonacci extension, aligning with a psychological resistance zone.
Summary:
The breakout from the bullish pennant, combined with increasing volume (OBV breakout), suggests strong bullish momentum. As long as price holds above the pennant and key support, continuation toward $40–$45 remains the probable scenario. Any dip into the lower FVGs would likely be a liquidity event rather than a trend reversal.
(NOTE: This is not financial advice, it is recommended to always (DYOR) (Do Your Own Research)
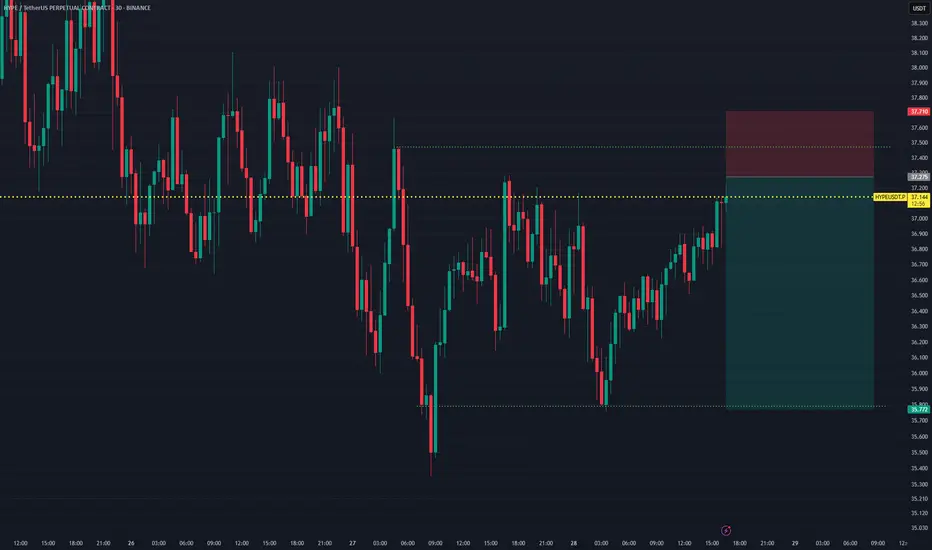
HYPEUSDT Short Triggered from ResistanceHYPEUSDT is showing signs of exhaustion near the 37.275 resistance level — an area where price has repeatedly failed to break higher. A short setup is in play, anticipating a rejection from this zone with downside potential toward key support.
Stop loss is placed above the previous swing high to protect against false breakouts, while take profit targets a clean support zone near recent consolidation.
🧩 Trade Setup:
- Entry: 37.275
- Stop Loss: 37.710
- Take Profit: 35.772
🔢 Risk:Reward Ratio:
- Risk: 37.710 − 37.275 = 0.435
- Reward: 37.275 − 35.772 = 1.503
- Risk:Reward: 1 : 3.45 ✅
🧠 Market Bias:
Short-term bearish reversal from resistance
📍 Setup Context:
-Price retesting major resistance zone
-Loss of momentum in uptrend
-Strong support level below
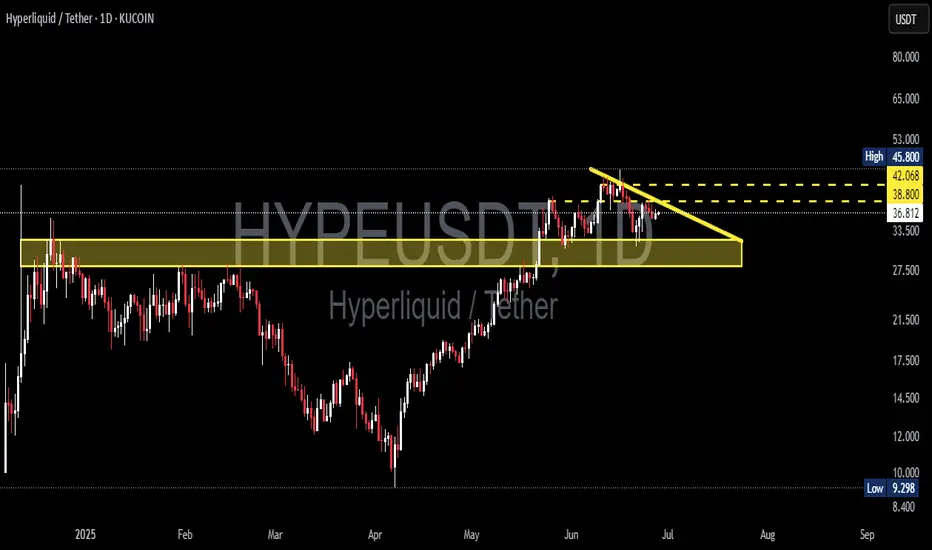
HYPE/USDT Ready for a Breakout? Watch These Key LevelsAnalysis Description:
The HYPE/USDT pair is currently forming a descending triangle pattern on the 1D timeframe — a classic technical setup that often signals a strong upcoming price move, either upward or downward.
🔶 Strong Support Block:
The yellow horizontal zone between 33.500 – 36.785 USDT represents a solid support area where price has repeatedly bounced with strong volume. This zone is ideal for monitoring buy-back opportunities if price pulls back.
📉 Descending Resistance Line:
A descending trendline has been acting as dynamic resistance. A breakout above this line could trigger a significant bullish continuation.
🎯 Upside Targets (If Breakout Occurs):
Target 1: 38.800 USDT (minor resistance)
Target 2: 42.068 USDT (mid-range target)
Target 3: 45.800 USDT (major resistance / previous high)
📌 Trading Strategy:
Conservative Entry: Buy on support re-test within the 33.500 – 36.785 USDT zone.
Aggressive Entry: Buy after a confirmed daily breakout above the descending trendline.
Stop Loss: Below the support block, around 33.000 USDT.
💡 Additional Note:
Watch for increased volume during the breakout — this would validate the move and confirm strong momentum. If the breakout fails, expect further sideways consolidation within the current range.
#HYPE #HYPEUSDT #AltcoinBreakout #CryptoChart #TechnicalAnalysis #CryptoTrading #DescendingTriangle #BullishSetup #CryptoCommunity
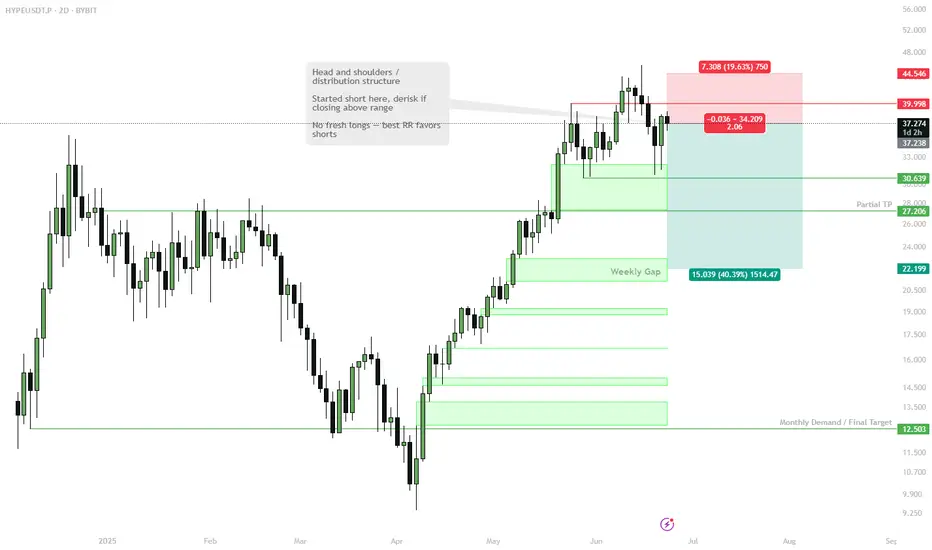
HYPE: Distribution Zone — Best RR for Shorts?🎯 KUCOIN:HYPEUSDT Trading Plan:
Active Short Scenario:
Entry: $37–$45 zone
Invalidation: Daily closes above $45.8 (cut/derisk)
Partial TP: $27.5 (0.5 retrace), $22 (weekly gap), $13 (monthly demand)
No Longs:
Avoid opening fresh longs in this structure/zone
Wait for reclaim and closes above $45.8 for any long bias
🔔 Triggers & Confirmations:
Add on weakness/rejection at highs
Derisk or close if daily closes above range
🚨 Risk Warning:
Strong squeeze risk if range high breaks
Be disciplined with stops
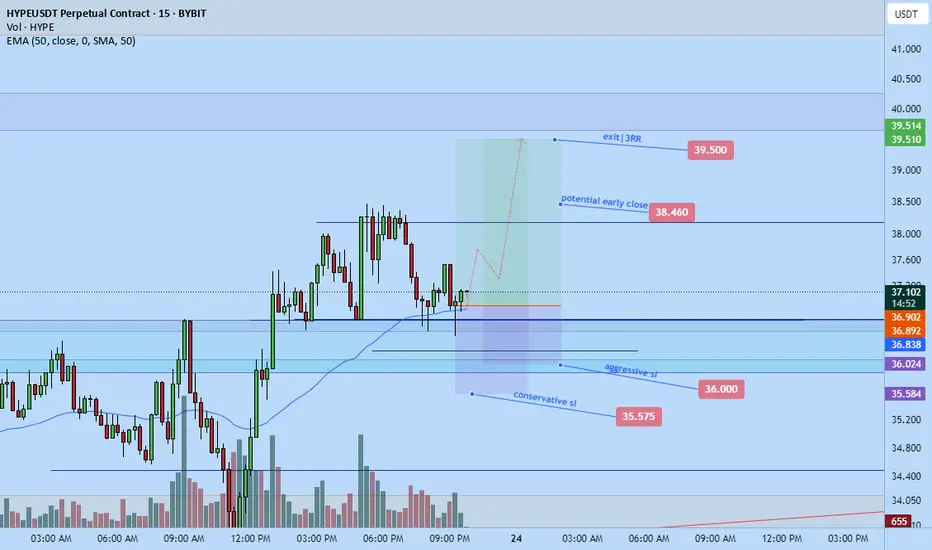
Hypeusdt longOpened a long position on hypeusdt a while ago.
Stop: $36-35.575 area
Tp: $39.5
2-3RR depending on the stoploss you you chose
HYPE Long-short-Long planHYPE is good for the short-term long-position at this moment, as it could go as far as 40 from 34.18 to form a Second shoulder.
But it will not sustain over there, and will come down to 22.
There could be another possibility that it may come between 28-29 and form shoulder 2, and then come back to 22.
I will only enter a long position when it takes support from 28 or 22.
Future traders may see short opportunities near 40-41. You will have to wait for price rejection at 40-41.
If it fails these 2 support areas, then I will look for 15-16.
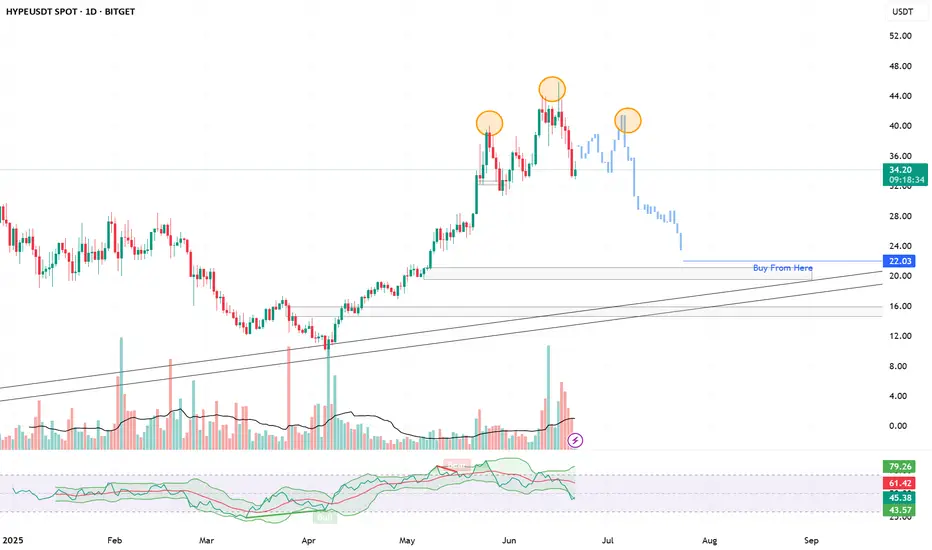
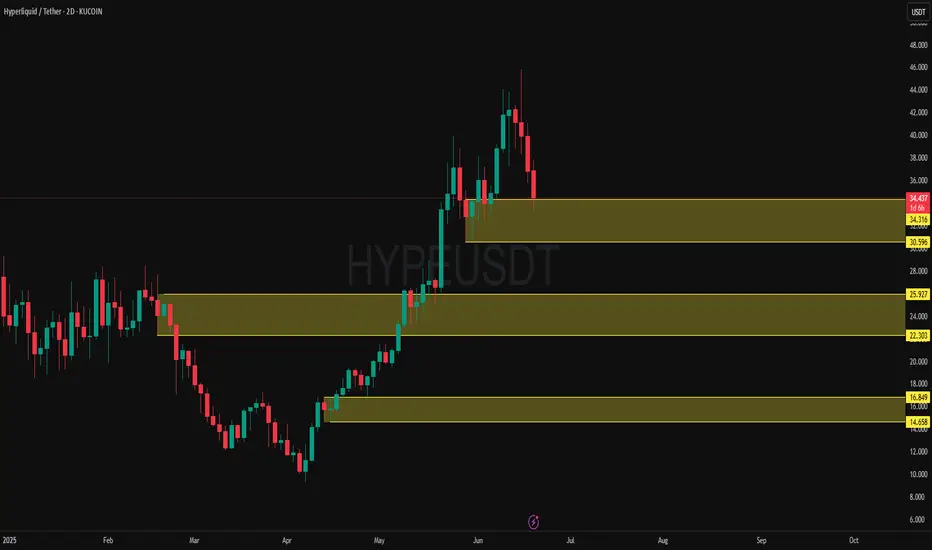
HYPE/USDT: Analyzing Major Buying Levels & Current RetracementPrice Action and Trend:
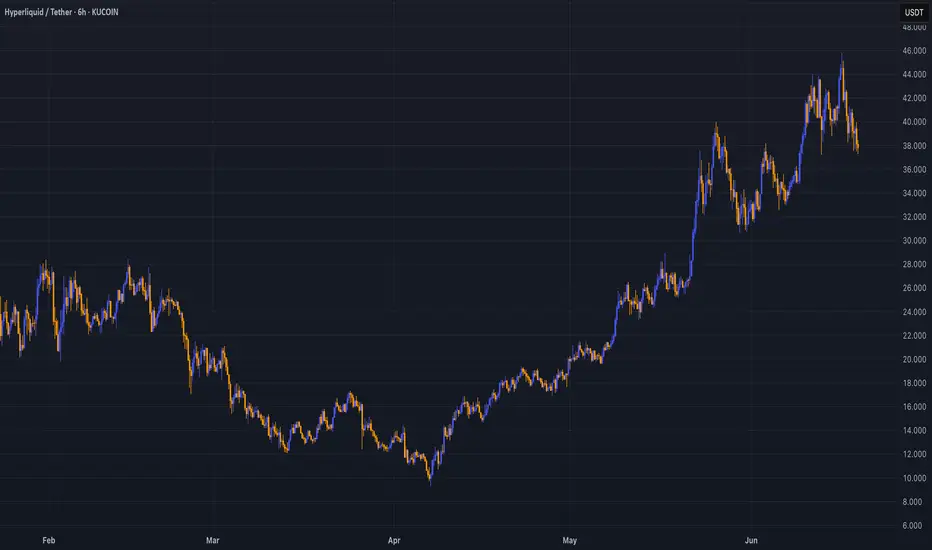
Since late 2024, HYPE/USDT has exhibited a volatile but generally upward-biased trend, particularly from April 2025 onwards. The initial period in late 2024 and early 2025 showed significant volatility with rapid pumps and dumps, characteristic of a nascent or highly speculative asset. A notable downtrend occurred from late February to mid-April 2025, reaching a low around the $12-$13 range. Following this, there's been a strong uptrend, with price breaking out of previous resistance levels and establishing new highs in May and June 2025, peaking near $40-$42. Currently, the price is undergoing a significant retracement from its recent highs.
Major Buying Levels (Yellow Zones):
The yellow zones on the chart clearly delineate significant demand (buying) levels:
Lowest Zone ($14.658 - $16.849) : This zone served as a strong accumulation area in late April and early May 2025. Price found substantial support here after the preceding downtrend, indicating a strong influx of buyers. This zone represents a foundational demand level where strong buying interest emerged, leading to the subsequent upward impulse.
Middle Zone ($22.303 - $25.927) : After the initial rally from the lowest zone, price consolidated and then retested this middle zone in late May 2025. The swift bounce from this area confirms its role as a significant demand zone, where buyers stepped in to prevent further declines and propel the price higher. This zone likely represents a point where early buyers took profits, and new demand entered, or previous buyers added to their positions.
Highest Zone ($30.596 - $34.316) : This most recent yellow zone became active in June 2025. After breaking through earlier resistance, price retraced into this area following its peak. The current price is hovering around the upper boundary of this zone ($34.316), indicating that buyers are attempting to defend this level. This zone signifies a crucial area where previous resistance may have flipped into support, attracting new buying interest. Its ability to hold will be critical for the continuation of the uptrend.
Supply Zones:
While not explicitly highlighted in yellow, several supply zones are evident where selling pressure intensified:
Around $27-$28 (Late 2024/Early 2025): Multiple wicks and rejections around this price range in late 2024 and early 2025 suggest a strong supply area. Price struggled to sustain above this level on several occasions, leading to pullbacks.
Around $30-$31 (Early 2025): Similar to the above, this area acted as resistance, causing price to reverse downwards after attempts to break higher.
The recent peak around $40-$42 (June 2025): This is the most significant recent supply zone. The sharp rejection from this area, marked by the long upper wick and subsequent bearish candles, indicates strong selling pressure at these elevated prices. This suggests profit-taking by earlier buyers and/or new shorting interest.
Current Price Position:
The current price of HYPE/USDT is approximately $34.345, which is at the upper boundary of the highest major buying level (yellow zone: $30.596 - $34.316). This indicates that the price has retraced significantly from its recent peak and is currently testing a crucial demand zone. The reaction at this level will be paramount in determining the immediate future direction.
Potential Future Scenarios:
Bullish Scenario: If the highest yellow zone ($30.596 - $34.316) holds as strong support, and buying pressure re-emerges, HYPE/USDT could consolidate within this zone before attempting another rally towards the recent highs ($40-$42) and potentially breaking above them. A strong bounce from this level would confirm renewed buyer confidence.
Bearish Scenario: If the current demand zone ($30.596 - $34.316) fails to hold, indicating a lack of buying interest at these levels, HYPE/USDT could see further downside. The next potential support levels would then be the middle yellow zone ($22.303 - $25.927). A break below the current zone would signal a shift in market sentiment and potentially the beginning of a deeper correction.
Key Observations:
Clear Demand Zone Effectiveness: The yellow zones have historically served as effective demand zones, leading to significant bounces and upward movements. This reinforces their importance as areas where institutional or significant retail buying has occurred.
Volatility and Wicks: The presence of long wicks (both upper and lower) indicates periods of significant price discovery and battle between buyers and sellers, especially around key levels.
Breakout and Retest Pattern: The price has shown a tendency to break out of resistance, then retest those levels (which often flip to support) before continuing its move, as seen with the middle yellow zone.
Recent Pullback: The current pullback from the highs around $40-$42 suggests profit-taking and the encounter of a strong supply zone. The ability of buyers to absorb this selling pressure at the current demand level will be a key determinant of future price action.
In summary, HYPE/USDT is at a critical juncture, testing a major buying level. The market's reaction to this demand zone will dictate whether the recent bullish momentum can be sustained or if a deeper correction is on the horizon.
HYPE/USDT ANALYSIS Currently waiting for price of HYPE to get to the green zone for potential LONG opportunities
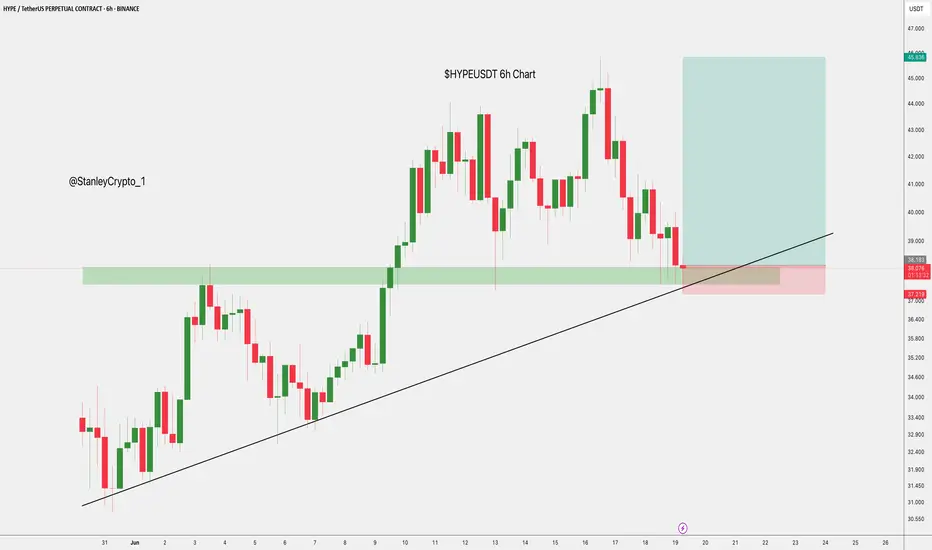
$HYPEUSDT Long Setup 6H Chart$HYPE/USDT – Long Setup (6H Chart)
- Entry Zone: $37.8 – $38.2
- Target: $45.8
- Stop Loss: $37.2
Price is bouncing off strong demand and an ascending trendline.
If support holds, we expect a bullish continuation
Break below $37.2 invalidates the setup.
DYRO, NFA
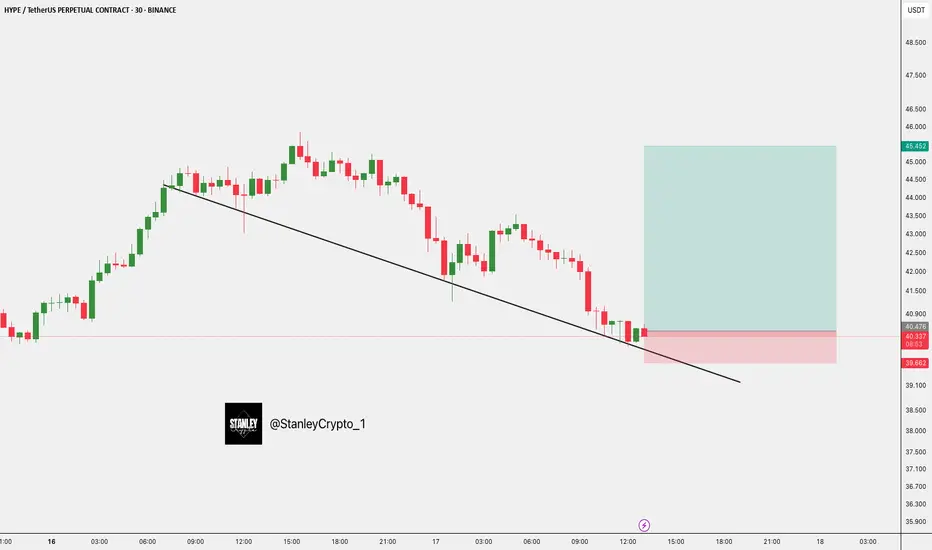
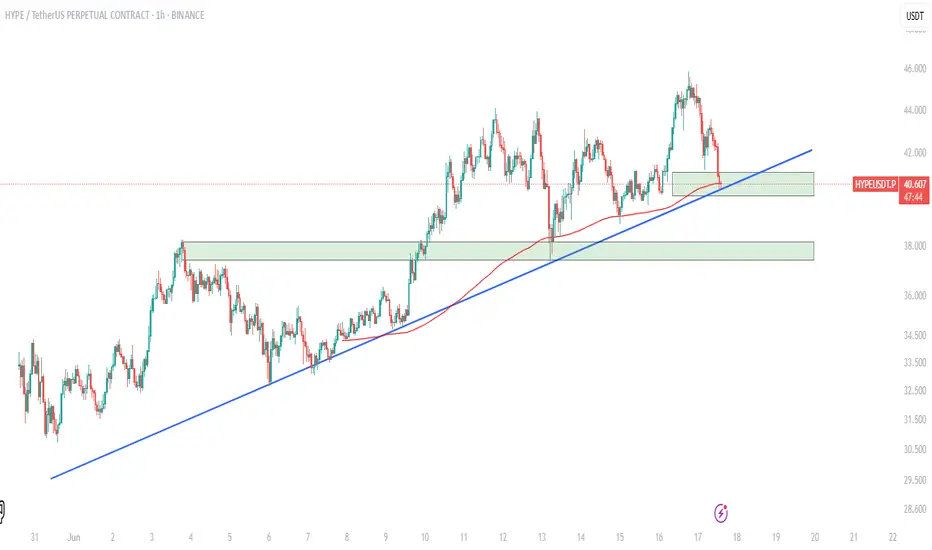
$HYPE Trade!!GETTEX:HYPE is testing the crucial support zone at $40.0–$40.5, right along the ascending trendline and 200 EMA on the hourly chart.
If this zone holds, we could see a rebound toward the $44.5–$46.0 resistance area.
However, a breakdown below $40.0 might trigger further downside toward the next major support at $38.0–$37.4.
Monitor closely—this zone will decide the next move.