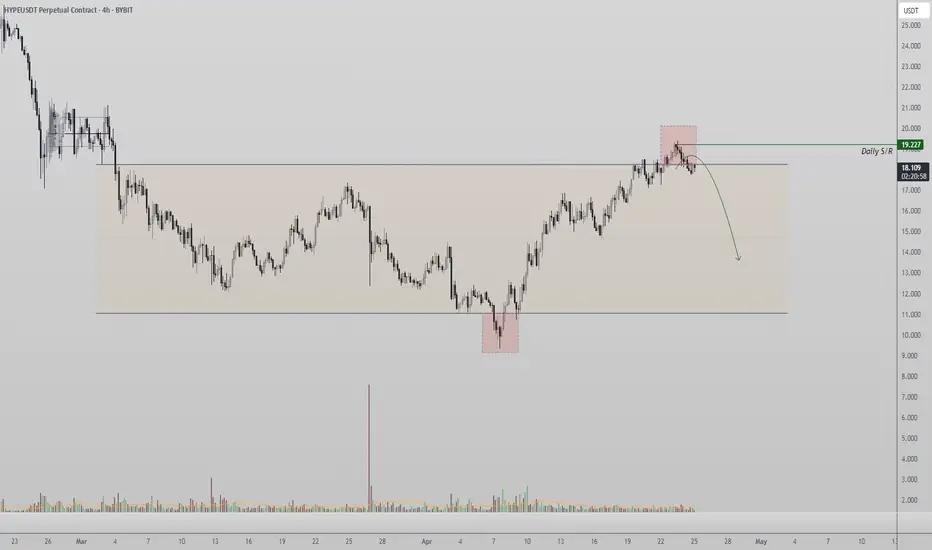
SHORT $HYPEI love Hyperliquid, but everything that goes up eventually comes down.
Great SHORT opportunity in GETTEX:HYPE to buy later on SPOT in that same zone using the short profits.
Hyperliquid
HYPEUSDT.P trade ideas
HYPEUSDT Market Analysis: Leading Crypto Performance and TradingHYPEUSDT Emerges as Top Performer in Current Crypto Cycle
HYPEUSDT has established itself as one of the leading assets in the current crypto cycle, demonstrating exceptional strength that has caught the attention of traders and analysts alike. The cryptocurrency has recently achieved a significant milestone by breaking through its long-term resistance level, marking what appears to be a potential major sign of strength in the broader market context.
Technical Breakthrough Signals Bullish Momentum
The recent price action in HYPEUSDT represents more than just a typical breakout. This cryptocurrency has positioned itself as one of the best outperformers in the crypto space, with its chart pattern showing clear signs of sustained upward momentum. The asset is currently making new highs, a development that reinforces the bullish sentiment surrounding this particular trading pair.
At the current resistance level, market dynamics are playing out as expected. There’s typically some form of supply that enters the market when prices reach these critical levels, and HYPEUSDT is no exception to this pattern. However, the way the asset is accelerating to the upside suggests strong underlying demand that’s overpowering the selling pressure.
Chart Pattern Analysis Reveals Strategic Opportunities
The technical formation visible on the HYPEUSDT chart shows an apex formation that has been followed by a quick resolution to the upside. This type of pattern often indicates decisive market sentiment and can signal the beginning of more substantial price movements.
Current market action shows some supply entering at these elevated levels, evidenced by the supply tail. This development would make consolidation at the current level a logical next step, potentially creating a “major making up action.”
Consolidation Phase Could Present Secondary Entry Point
The potential consolidation at the current resistance-turned-support level could present a second entry point for traders looking to participate in this campaign. This scenario is particularly attractive for those who may have missed the initial breakout or are looking to add to existing positions with better risk management parameters.
Risk Management and Trading Strategy
From a risk management perspective, maintaining appropriate stop-loss levels is crucial in the current environment. The best strategy in the current market environment appears to be following the established trend rather than trying to anticipate reversals or corrections.
Market Outlook and Implications
HYPEUSDT’s ability to break through long-term resistance and maintain momentum above these levels suggests that the overall crypto cycle may be entering a phase where the asset can achieve sustained outperformance.
The combination of technical strength, volume confirmation, and strategic positioning makes HYPEUSDT a cryptocurrency worth monitoring closely. As the consolidation phase potentially unfolds, traders and investors will be watching for signs of continuation or reversal that could influence broader market positioning and sentiment in the cryptocurrency space.
HYPE going to take Previous Day High Hype shifted bullish with a inverted Head and Shoulders pattern after sweeping Monday Low.
Is now retesting the support to try and take Mondays High.
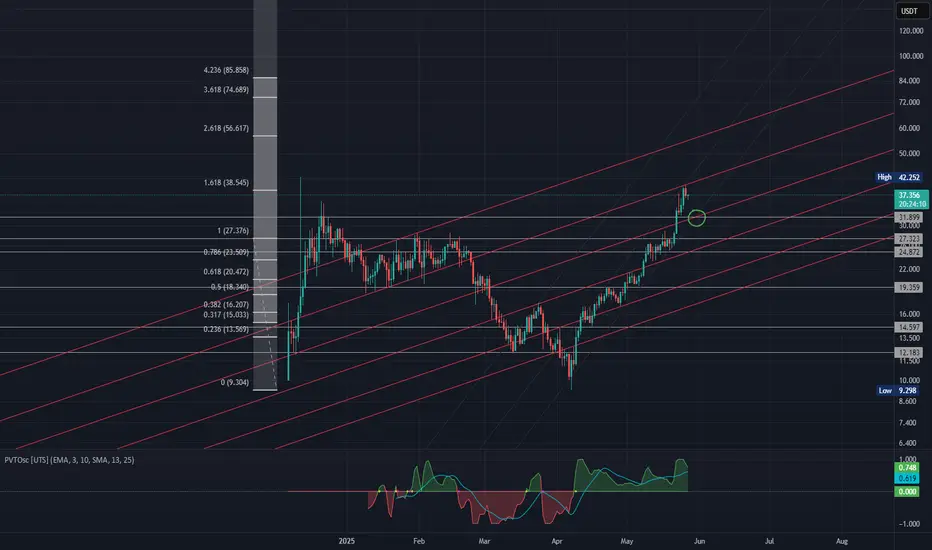
$HYPE peak for now but new highs coming soon3ple resistance with LT & ST trend and 1.618 Fib.
Looking for support on lower LT & ST trendline
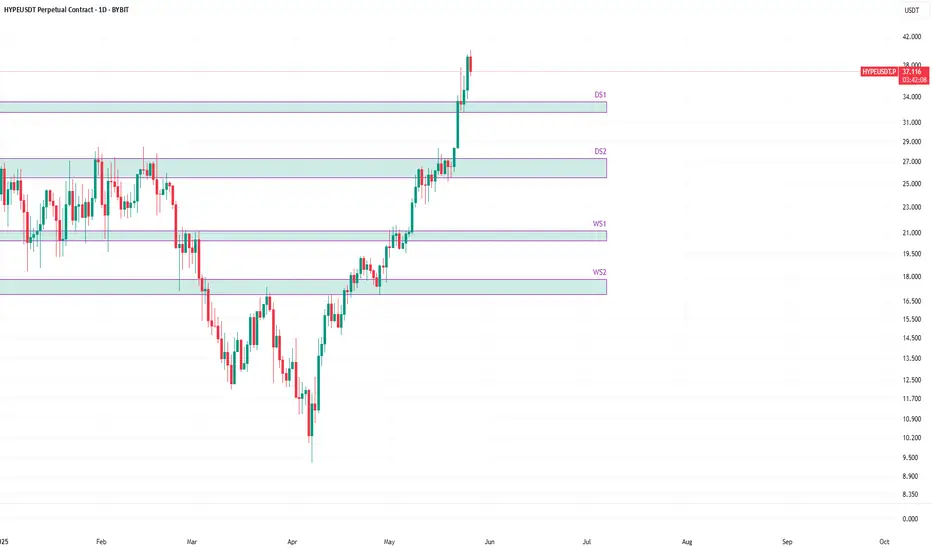
HYPEUSDT relevant support zonesDo not have much to say about it.
This is trending very well.
Supports are marked on the chart. As it lands on a support, it provides a long trade opportunity.
The lower the support zone on the chart, the price hits, stronger bounce and higher probability for a long trade it presents.
I will load heavy on spot if it hits any of the weekly support, specially WS2 in future.
The Wrong Door, The Wrong Trade, and the Right Mindset✍️ Coach Miranda Miner
In life, and especially in trading, we are often taught to push through — to stick it out, to “just HODL,” or to wait for the market to turn in our favor. But let me tell you this, KaMiranda: there is wisdom not only in perseverance, but in the courage to walk away.
The image above says: “Better to admit you walked through the wrong door than spend your life in the wrong room.”
And I couldn’t agree more — especially as a trader.
How many times have we held onto a losing trade because we were too proud to admit we entered at the wrong time? How often do we let our ego and fear of being wrong cost us more — not just in capital, but in peace of mind? In trading, just like in life, the door you choose matters. But what matters more is your ability to recognize when you’ve entered the wrong one.
Many traders are trapped in the “wrong room” — a room filled with overleveraging, poor risk management, and emotional decision-making. Some stay because of sunk cost. “Sayang eh, baka bumalik.” Some stay because of ego. “Ayokong mali ako.” And others stay because they don’t know there’s another door out — a better one.
But here’s the truth, KaMiranda: there’s no shame in admitting you made a mistake. The shame is in staying stuck in the wrong trade, the wrong mindset, or the wrong system just to save face. That’s not strength. That’s stubbornness disguised as grit.
I’ve been there. I’ve held onto positions I should’ve cut. I’ve sat in rooms I should’ve left long ago — whether in trading, career, or even personal choices. And every time I found the courage to say, “This isn’t for me,” I didn’t lose. I grew.
In trading, cutting losses is a sign of maturity. It’s not a loss — it’s protection. Just like walking out of the wrong room doesn’t mean failure, it means you’re now free to find the right one.
The market doesn’t owe you anything. But you owe it to yourself to trade with clarity, not pride. To be honest with yourself, not attached to being right. Remember: “It’s better to be out of a trade wishing you were in, than in a trade wishing you were out.”
So here’s your reminder today:
If you’ve walked into the wrong trade, the wrong mindset, the wrong crowd — it’s okay. Admit it. Exit gracefully. Then reset, learn, and walk through the door that aligns with your goals, your discipline, and your future.
Because real traders don’t just chart the market — they chart their growth.
Let’s go, KaMiranda. Open the right door.
– Coach Miranda Miner
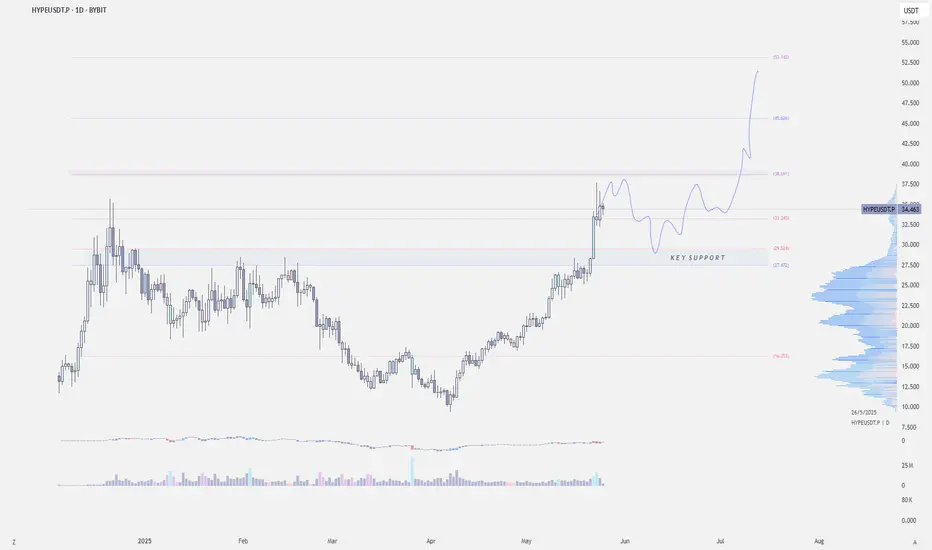
$HYPE - Key SupportKUCOIN:HYPEUSDT | 1D
Price has swept the high and is now entering price discovery.
The key zone to watch now is the $27–$30 range — previously a resistance cluster.
A successful support flip of $27–$30 would confirm strength and likely open up upside targets to $50-$54
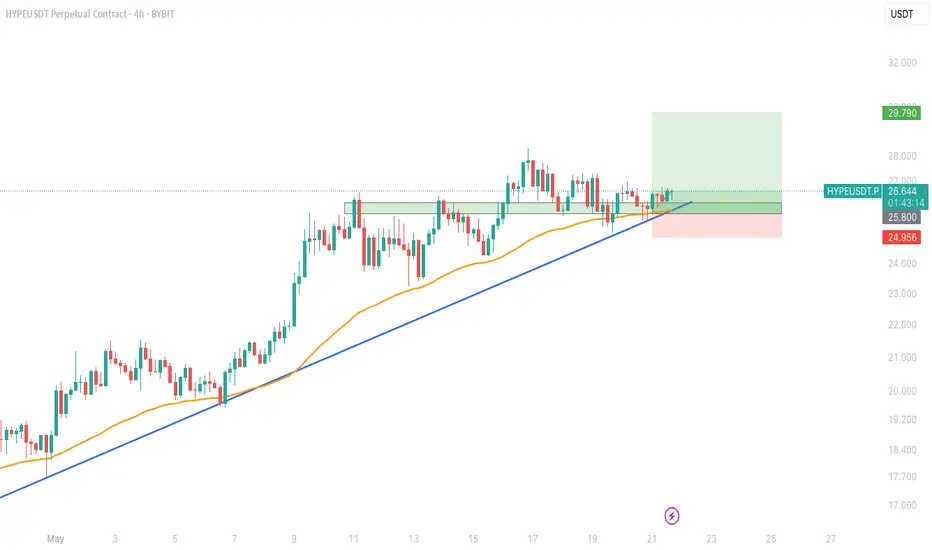
$HYPEUSDT long trade set-up!GETTEX:HYPE is currently holding strong above both the ascending trendline and the 50 EMA, bouncing off a key support zone.
🔹 Support retest looks successful
🔹 As long as the trendline holds, bullish continuation is likely
🎯 Targets:
TP: $29.79
🛑 Stop-loss: $24.95 (below trendline & support)
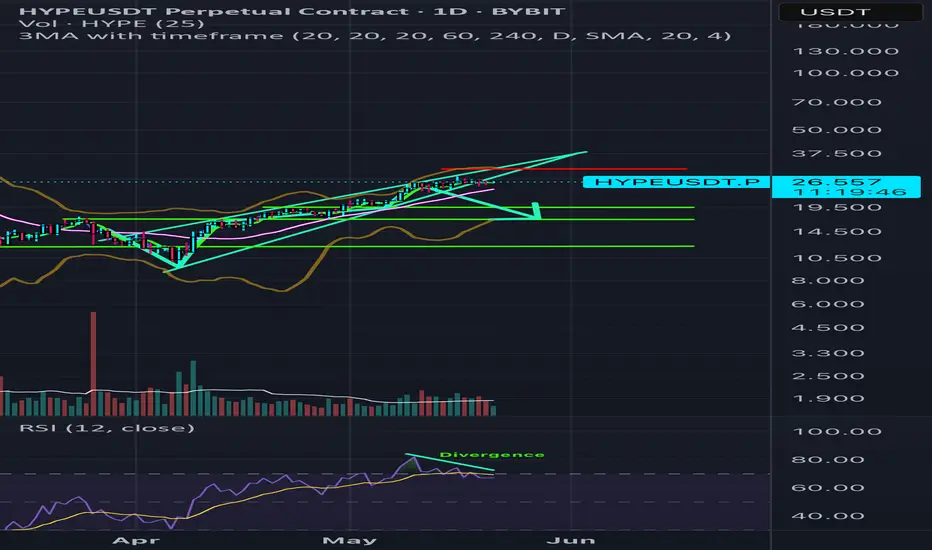
Rising wedge short the “hype”This is another short using leverage on gmx plan and set risk/reward accordingly as the risk with margin trading is always very high. Anyways heres some statistics on the rising wedge.
Effectiveness of Wedge Patterns as Indicators
Statistical analyses show that rising wedges lead to price breakdowns over 76% of the time, while falling wedges signal bullish reversals about 68% of the time. The statistical results of wedge patterns serve as a guide, revealing paths to either profit or loss depending on trader interpretations. These compelling metrics highlight the effectiveness of including wedge patterns in trading strategy.
Red line is stop loss greens are targets.
We also have some divergence (bearish) going on. Bearish divergence occurs when the price of an asset makes a higher high while a momentum indicator, like the Relative Strength Index (RSI), makes a lower high. This pattern suggests that the upward momentum is weakening, indicating a potential reversal to a downtrend. This, alone with falling volume throughout the entire wedge is a recipe for a high percentage trade. As always,
GL bois.
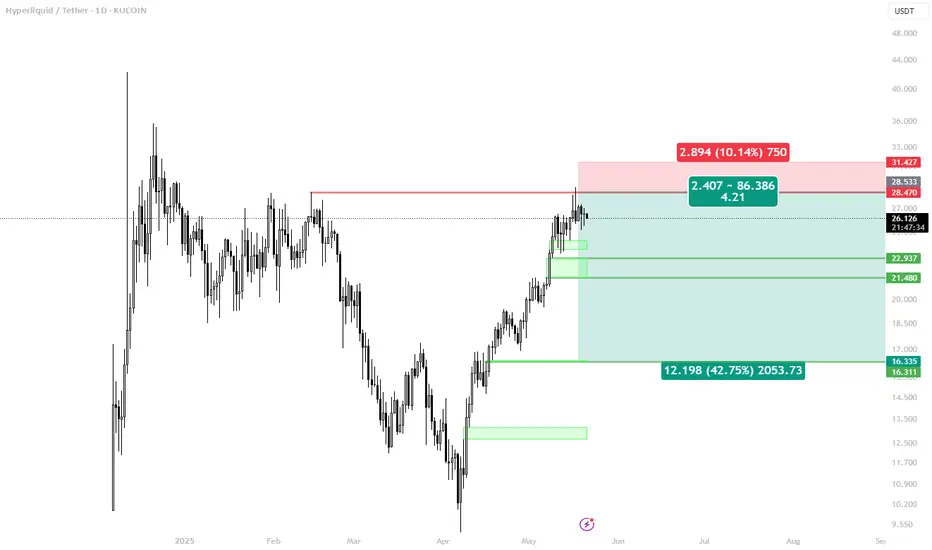
HYPE 1D SHORT SETUPGETTEX:HYPE has rallied into the Equal Highs zone at $28.470—a classic stop-run area ahead of a potential reversal. Below, unfilled weekly FVG around $16.311 and a demand cluster at $22.937–21.480 set clear targets.
Checklist & Context
Uptrend in place (HH/HL) into Equal Highs (~$28.47)
Prior moves saw liquidity grabs above highs, then swift returns
Demand sits at $22.937–21.480 (green zone)
Unfilled FVG at $16.311–16.335
Plan
– Primary: Short on a false-break or stop-run above $28.470 with a quick reclaim below
– Alternate: If price stalls < $28.47, watch $25–26 for a reversal setup
Triggers
• SFP / fake break above $28.470 followed by a close back under
• Impulsive drop into $22.937–21.480 → partial profit-taking
• Acceleration into the weekly FVG → exit remaining
Levels
• Sell Zone: > $28.470
• Take-Profits:
1️⃣ $22.937
2️⃣ $21.480
3️⃣ $16.311 (weekly FVG)
• Stop-Loss: > $31.427
Wait for clean reversal signals—no rush into the short until the high-stop reset is confirmed.
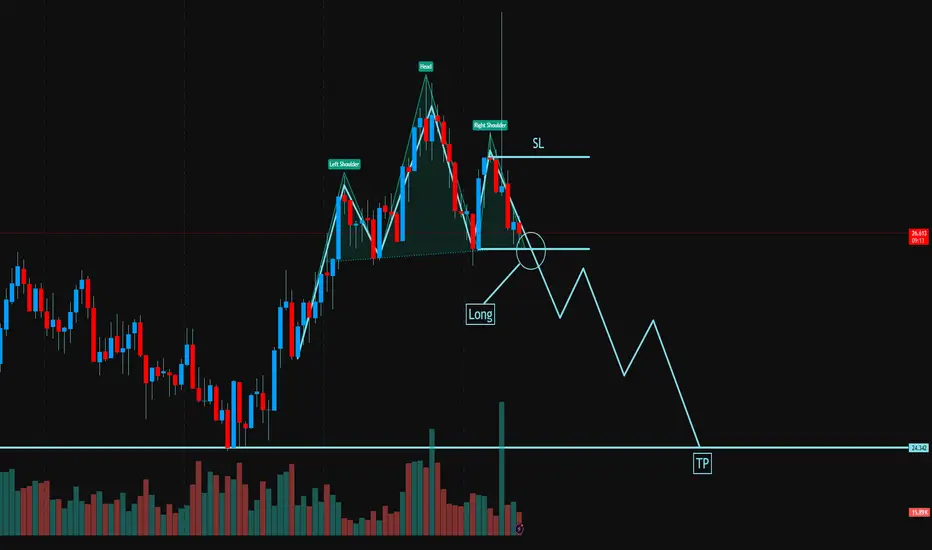
Hyper/USDT (1H) – Head & Shoulders Breakdown
The chart reveals a classic Head and Shoulders pattern formation, signaling a potential bearish reversal in the current trend. This is a well-known structure used by traders to anticipate market turnarounds after an uptrend.
🧩 Pattern Structure:
Left Shoulder, Head, Right Shoulder: Clearly defined, suggesting the exhaustion of bullish momentum.
Neckline Break: Price has just broken below the neckline support (circled zone), triggering a potential short opportunity.
Entry (Short Position): Ideal entry is just below the neckline confirmation, where price breaks down and retests the zone.
Stop Loss (SL): Placed above the right shoulder – a break above this level would invalidate the pattern.
Take Profit (TP): The target is projected based on the height from the head to the neckline, pointing to the 24.34 level as the main downside objective.
📉 Conclusion:
This setup presents a clean bearish opportunity with a well-defined risk-to-reward ratio. If price sustains below the neckline with momentum, we could see a continuation toward the TP level. Traders should remain cautious and manage risk accordingly. ⚠️
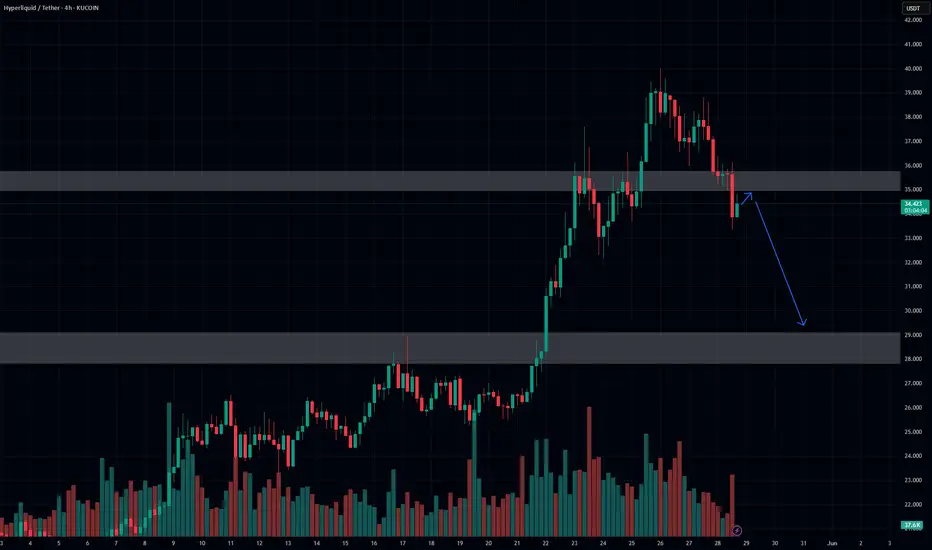
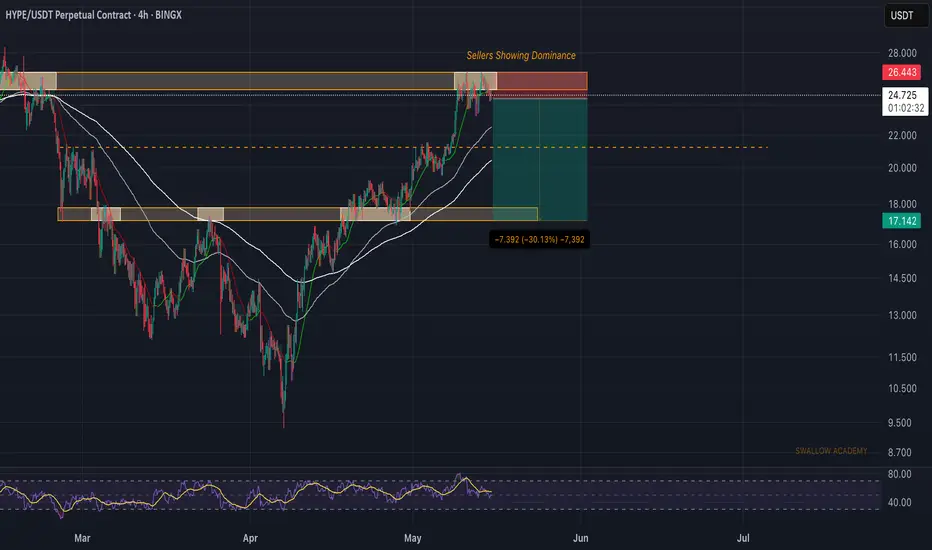
Hyperliquid (HYPE): Reached Zone of Rejection | Possible Drop ! Hyperliquid has reached the next resistance zone, where we are seeing some sort of weakness already. Now we are looking for a proper MSB from here, which would give us the last sign of possible downward movement so keep your eyes open for it!
Swallow Academy
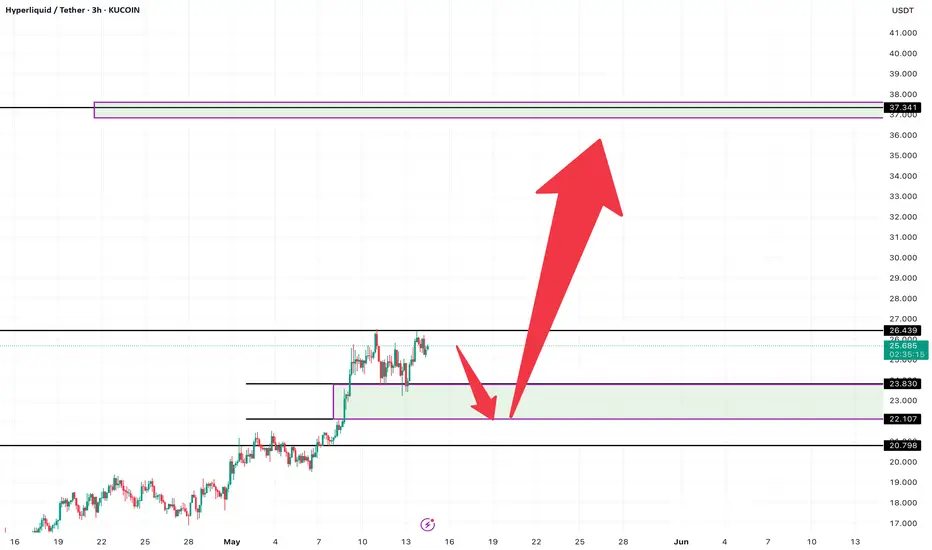
Maybe we Get a Pullback on HYPEUSDT I would love to see a pullback on HYPEUSDT back in to $22-23 range.
This looks like it's getting ready to break out and push into $37 range first target.
Definitely like having HYPE in the bag.
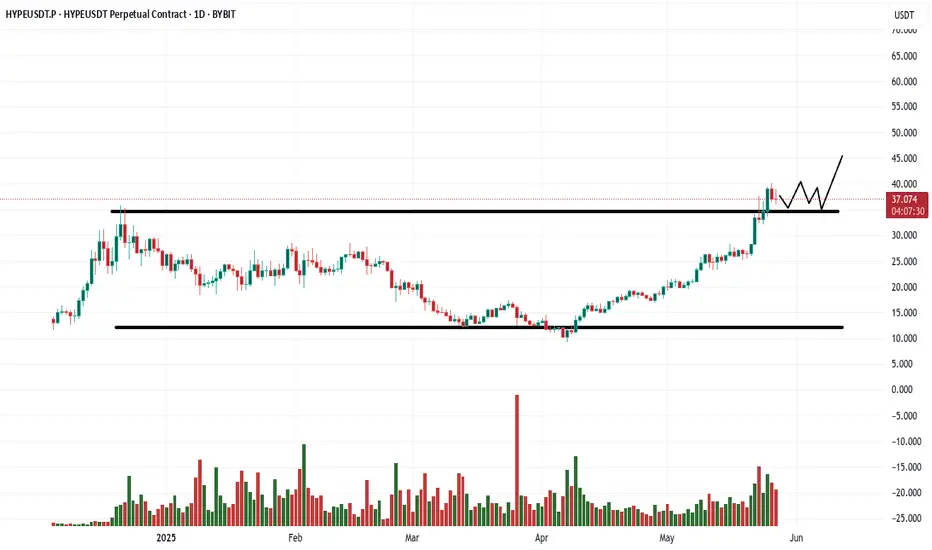
Hyperliquid (HYPE) Structural Breakout: Target $60+ HYPE just broke out from a major downtrend on the weekly chart and it’s looking strong.
I’m targeting $60 as a realistic level this year, and there’s a good chance HYPE makes it into the T op 10 crypto market cap if this momentum holds.
Here’s why I’m bullish:
Price broke out of the falling channel and closed above $25 weekly resistance.
Strong buying volume shows big players are stepping in, especially after that accumulation zone between $9 and $18.
Based on Fib extension, $60 lines up perfectly as the next major target and a psychological resistance level.
The Hyperliquid narrative is strong. Positioned as a real on-chain CEX alternative with solid user growth and rising TVL.
My trade setup:
Entry around $20 to $26.
First target at $37.5, final target at $60.
Stop loss if price closes below $18 weekly (that would kill the bullish case for me).
This isn’t financial advice , just sharing how I’m seeing the market.
Always manage your risk and don’t FOMO in at the top.

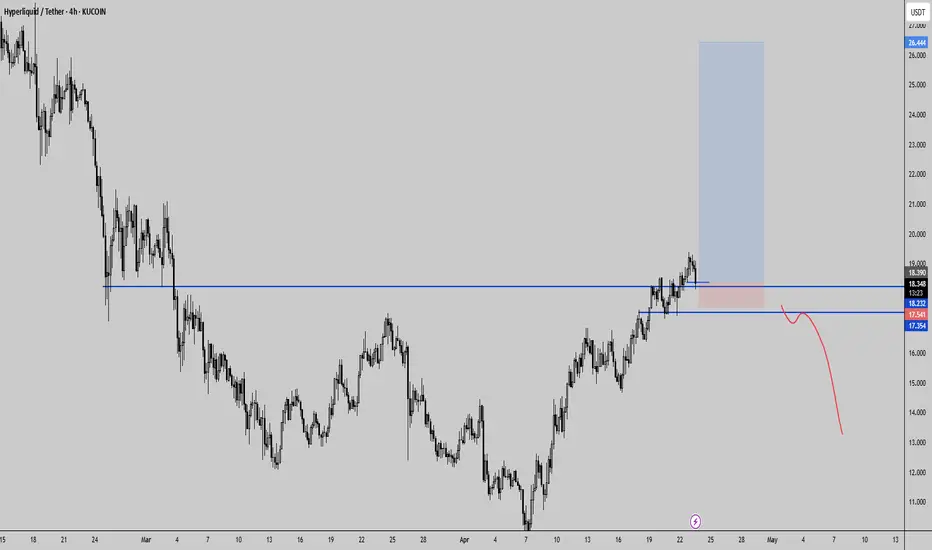
$HYPE: The Return of the King or Another FakeoutThe $HYPE/USDT chart just broke through key resistance levels with a massive green thrust, pushing past $21.89 and rocketing above $25.50 — levels we haven’t seen since February.
Here’s why this breakout matters:
✅ Reversal Confirmation:
We’ve been in a textbook downtrend from February through early April, but notice the clean series of higher lows and higher highs building over the past month. This isn’t just a bounce — it’s a structural trend shift.
✅ Dynamic Resistance Flipped:
Both the $21.89 and $17.43 dynamic resistances (marked on the chart) were cleanly smashed and are now acting as support. This flip is crucial because it shows buyers aren’t just testing — they’re claiming territory.
✅ Volume and Candle Strength:
Look at the size of those recent green bars: big-bodied candles, minimal wicks, aggressive closes. That’s momentum money stepping in.
✅ Sentiment Surge:
The ticker is literally called GETTEX:HYPE , but this is real hype — we’re watching the market front-run the rest of retail, setting up for a potential FOMO wave once we breach $27–$28 (Yearly High region).
But Here’s the Caution:
⚠️ We’re entering a high-liquidity hunting zone between $25.50 and $28. This is where algorithms often bait breakout traders, whip back, and refill lower.
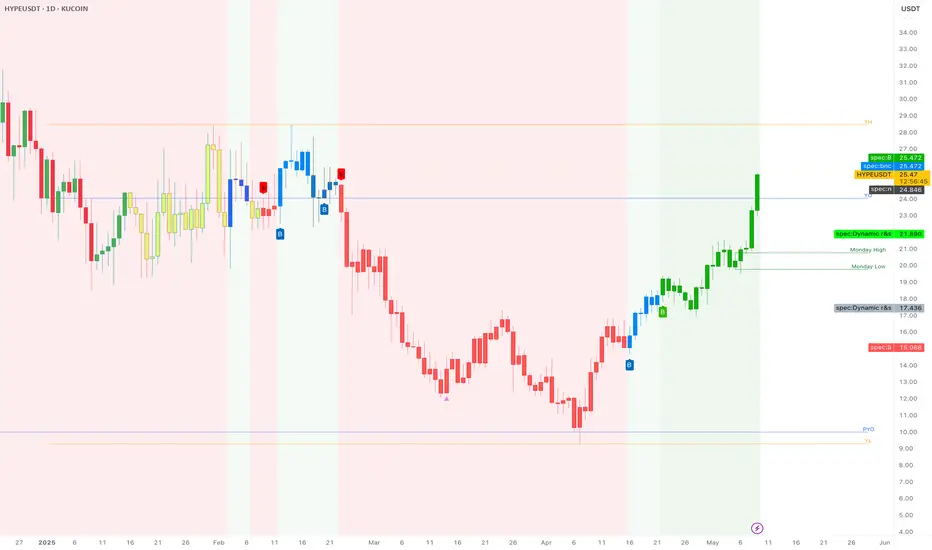
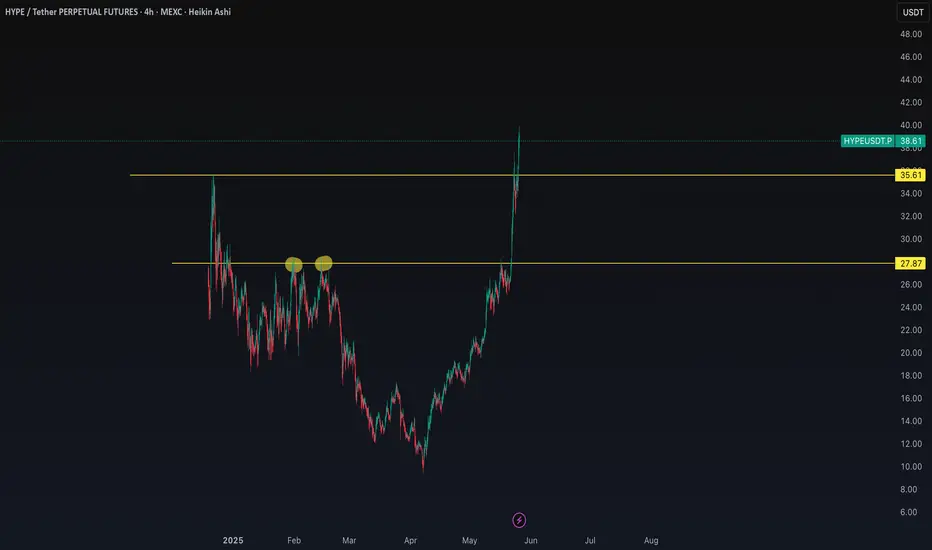
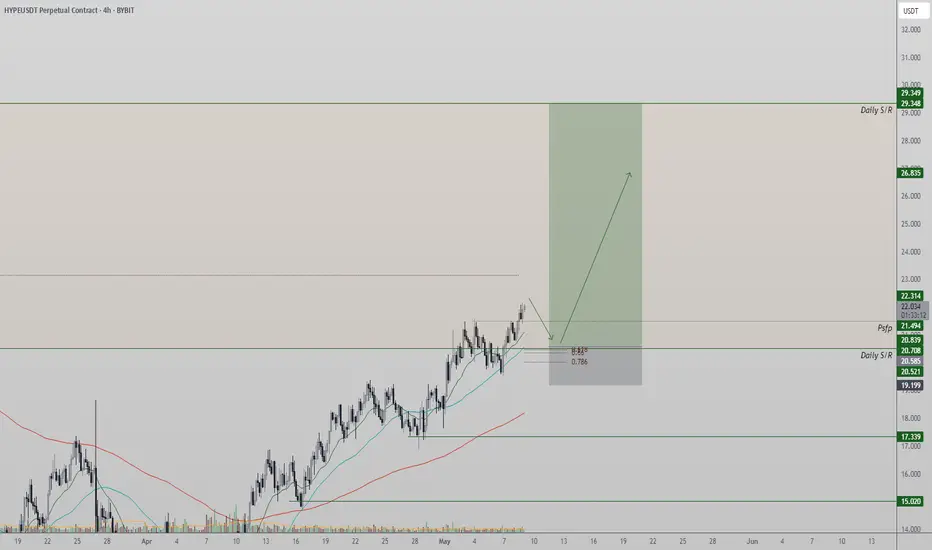
Hypecoin Flips $20 — Bullish Trend Targets $29 Next
Hypecoin has officially flipped the $20 resistance into support — a key SR level that marks bullish continuation in the current trend structure.
Market Structure: Price is printing higher highs and higher lows.
SR Flip: $20 resistance now acting as daily support.
Fibonacci Confluence: 0.618 Fib aligns with $20, strengthening support zone.
Next Target: $29 — a potential 41% move from current levels.
If price retests the $20 area and holds, it will confirm a bullish SR retest with Fib support, increasing the probability of rotation up toward $29. Traders should monitor how price reacts around the $20 mark — failure to hold could invalidate the short-term bullish setup, but as long as that level holds, momentum remains upward.
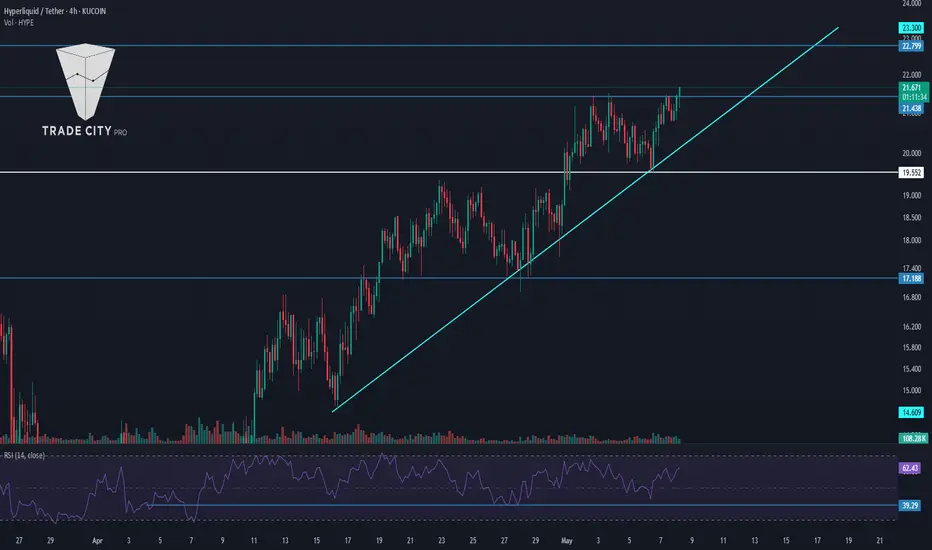
TradeCityPro | HYPE: Bullish Momentum Builds Near Resistance👋 Welcome to TradeCity Pro!
In this analysis, I’m going to review the HYPE coin for you. The Hyperliquid project is one of the DEX projects in the crypto space that also functions as a Derivatives platform, and it currently holds the highest 24-hour volume among all DEXs.
🔍 The token for this project, with the symbol HYPE, has a market cap of $7.23 billion and is ranked 20th on CoinMarketCap.
⏳ 4-Hour Timeframe
In the 4-hour timeframe, as you can see, this coin is in an uptrend with an ascending trendline, and it’s currently encountering resistance at 21.48.
📈 If the price stabilizes above this zone, a new bullish wave can begin, with the next resistance being at 22.799.
✔️ You can enter a long position using the 21.48 breakout trigger. Buying volume has increased significantly, which raises the chances of this level breaking.
📊 For short positions and a potential bearish trend in this coin, the first trigger would be a rejection from the 21.48 resistance. If the price gets rejected at this level, the likelihood of breaking the trendline increases.
⭐ A break of the trendline itself can also serve as a trigger. Breaking this trendline would eliminate bullish momentum in the market, and a breakdown below the 39.29 level on the RSI would further support bearish momentum.
🔽 The main short position can be opened upon breaking the 19.552 level. This is a very strong support, and if the price closes below it, it could drop further to 17.88.
👀 Overall, the long setup on this coin looks quite logical, and if the 4-hour candle closes as is and doesn’t turn out to be a fakeout, it could be a great entry opportunity.
📝 Final Thoughts
This analysis reflects our opinions and is not financial advice.
Share your thoughts in the comments, and don’t forget to share this analysis with your friends! ❤️
$HYPE | 1d longKUCOIN:HYPEUSDT is stalling at the Range Low zone after big moves—time to scale in smart, not chase.
• Clear reaction off Range Low resistance
• 50% of my position booked in the red zone, 50% still live in spot
• Structure remains bullish within the larger rounding base
Scenario 1: Confirmation Above Range Low
🔹 Trigger: Daily candle closes & successfully retests above Range Low (~$17.50)
🔹 Entry: Add at $16.4 - $15.1
Scenario 2: Pullback to Lower Base
🔹 Trigger: Price dips back into the lower range demand zone (~$11.50–12.50) with a bullish reversal candle
🔹 Entry: Add at $11.50–12.50
Targets:
🔹Prior supply zone (~$24–25)
🔹Long-term range high ($36)
Note: Be ready for short-term drawdown—no panic, we’re scaling in per plan.
Stay patient & follow the triggers. Good risk management wins.
HYPE | #12h Fakeout & Recovery SetupContext:
After a clean fakeout below the green demand zone, KUCOIN:HYPEUSDT reclaimed structure and is now holding above the range low — potential start of base formation before trend shift.
🔍 Local Range Setup:
✅ Fakeout confirmed
✅ Reclaim above range low
🎯 Next: Retest of red supply zone ($18.9–21) on the table
📌 Trading Strategy:
— Waiting for potential pullback to previous demand zone for a full entry
— Target: top of range ~ $20
— Invalidation: clear break below reclaim zone
🧠 Macro View:
— Short-term: Likely to tag red zone if structure holds
— Long-term: base forming. Full confirmation = break & hold above supply.
If not — a revisit to $5–10 is still on the table.
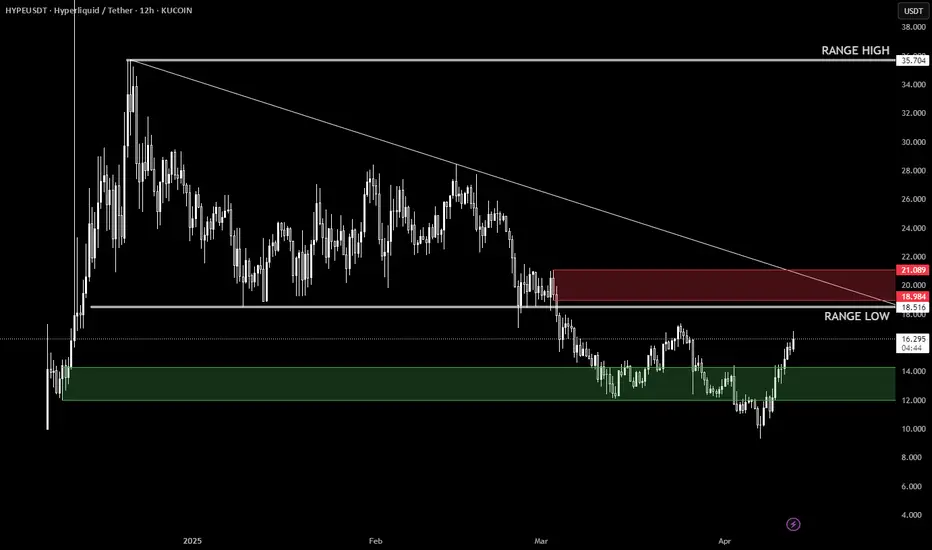
Hypecoin Hits Range High – Reversal or Breakout Ahead?Hypecoin has rallied into the range high after reclaiming the range low in a textbook failed auction setup. This area now poses a potential reversal zone unless further strength confirms.
Key Points:
Price reclaimed the range low after a failed auction, leading to an impulsive rise.
Currently testing range high resistance with decreasing momentum and volume.
Outlook:
If Hypecoin fails to break above this resistance, a pullback becomes more likely. However, a strong breakout above the range high with volume confirmation could flip the zone into support and open the door for further upside.
Hypecoin is testing key resistance at its range high after an impulsive rally. A failed auction here could trigger a reversal if bullish momentum doesn’t follow through.
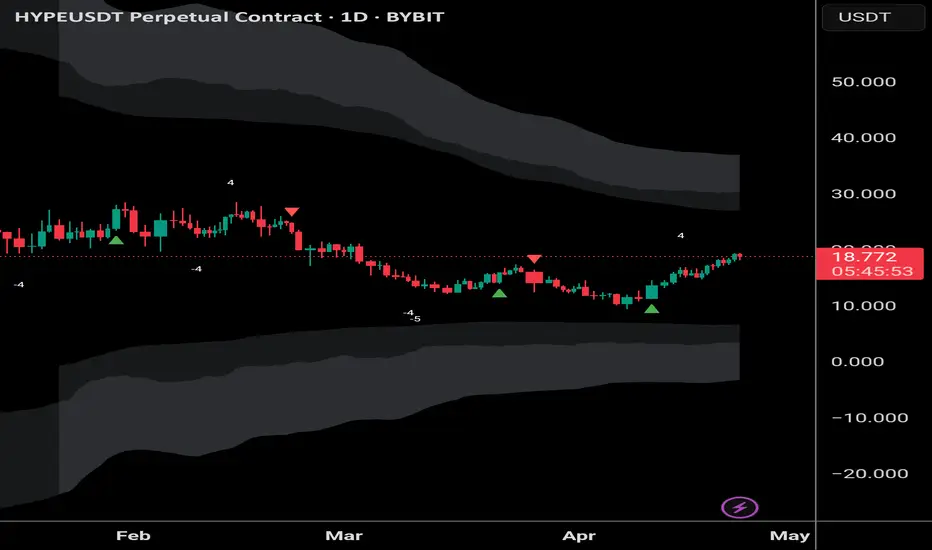
The HYPE whale controlling the mkt hasn't sold yet Check the last two cr signals. The whale is not hiding their intentions. Massive volume whenever they enter.
Buy HYPE Hype is in big uptrend, crypto bullish, s/r flip, playing retest and entering on liquidity run. it going up, or maybe not, but i think so, so go long