Breaking: Hyperliquid Native Token ($HYPE) Tanked 10.81% Hyperliquid a cutting-edge blockchain platform, specifically designed to enhance the efficiency and performance of decentralized finance (DeFi) applications saw it's native token GETTEX:HYPE plummet 11.15% needless to say that GETTEX:HYPE had an all time high if $35 recorded December. This dip causes GETTEX:HYPE to lose half of market value.
as of the time of writing, GETTEX:HYPE is down 11.98% trading within oversold regions with the RSI at 29.85. Currently, the 1-month low is serving as support point and a break below that level could lead to a move to the $12 pivot. similarly, a break above the 38.2% Fibonacci retracement level which is a point that aligns with the $24 resistance could act as catalyst to a bullish reversal move.
Hyperliquid Price Live Data
The live Hyperliquid price today is $15.40 USD with a 24-hour trading volume of $142,328,477 USD. We update our HYPE to USD price in real-time. Hyperliquid is down 8.91% in the last 24 hours, with a live market cap of $5,142,511,570 USD. It has a circulating supply of 333,928,180 HYPE coins and a max. supply of 1,000,000,000 HYPE coins.
HYPEUSDT.P trade ideas

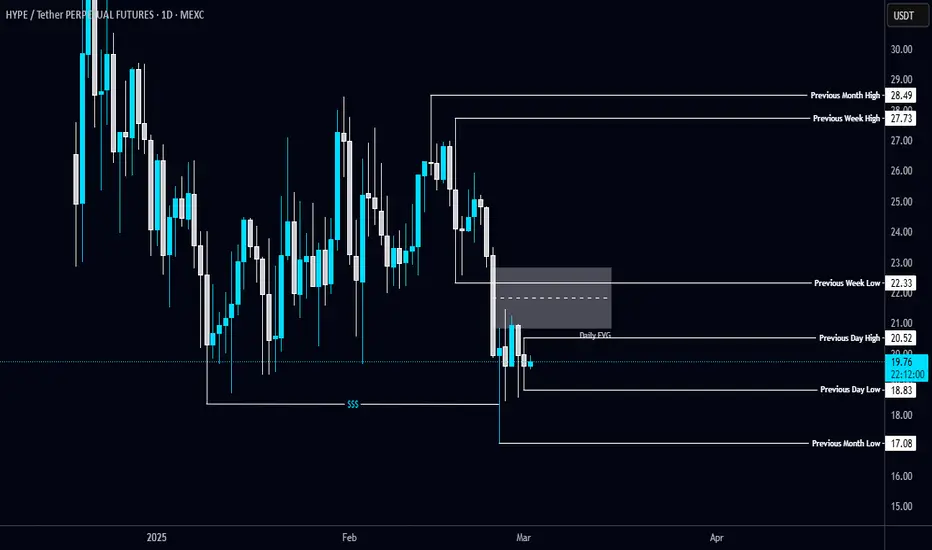
#HYPE/USDT Analysis📉 GETTEX:HYPE swept liquidity below the previous swing low and bounced back.
🔸 Bearish Daily FVG at the top is holding—waiting for invalidation to confirm bullish momentum.
📌 Key Levels:
🔹 Resistance: PWL $22.31
🔹 Support: PML $17.08
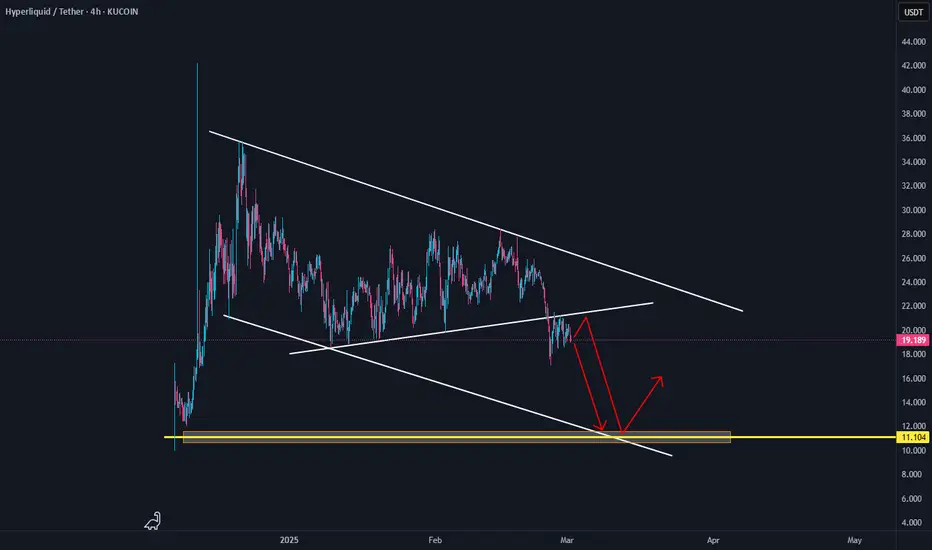
IS HYPERLIQUID HEADING TO $11? HERE'S THE ANALYSIS!Currently, HYPE is showing signs of weakness after failing to break through the key resistance level around here (adjust with the latest price). Selling pressure is increasing, indicating a potential deeper correction.
🔻 Technical Indicators:
Support & Resistance: HYPE faced rejection, confirming it as a strong resistance zone.
RSI (Relative Strength Index): Bearish divergence is forming, signaling weakening buying momentum.
Volume: The price drop is accompanied by increasing sell volume, indicating distribution by smart money.
EMA 50/200: A potential death cross formation could further confirm the bearish trend.
📉 Bearish Target:
If selling pressure continues, the price could drop to the next demand zone around $11, which aligns with historical support and a high-liquidity area. If further breakdown occurs, psychological levels below $11 may come into play.
🚨 Alternative Scenario:
If HYPE manages to hold above $13 and sees a strong buy reaction, a potential reversal could still be in play. However, as long as the key resistance remains intact, the outlook stays bearish.
hyperliquidIf the 24.5 floor is lost, the analysis will be canceled. Observe risk and capital management.
Hyperliquid Long Position | HYPEUSDT | High PotentialI am opening my next position on Hyperliquid Berg Capital World, allocating 10% of my balance on isolated margin in LONG on Hyperliquid. I trade on this exchange and see huge potential.
Stop-loss: $17.751
No take-profit for now, holding long-term
Will consider taking profit at $30
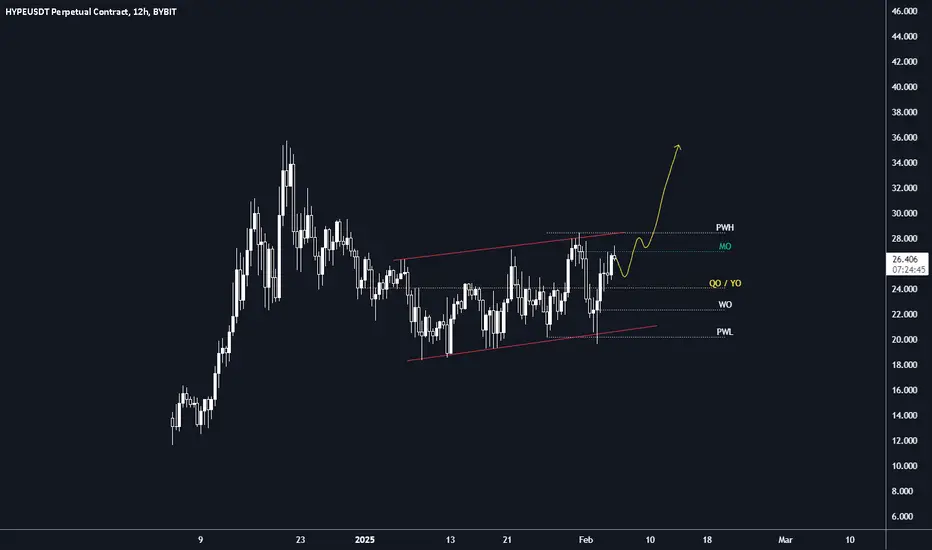
HYPE about to rip higherThe strength is fantastic due to strong fundamentals and user growth.
The recent dip was not as bad as other coins, once we flip MO, then this should not take much time to reach new ATH. Easy trade on spot as well. On a higher timeframe fractal, you can see price forming a U shape.
Bullish.
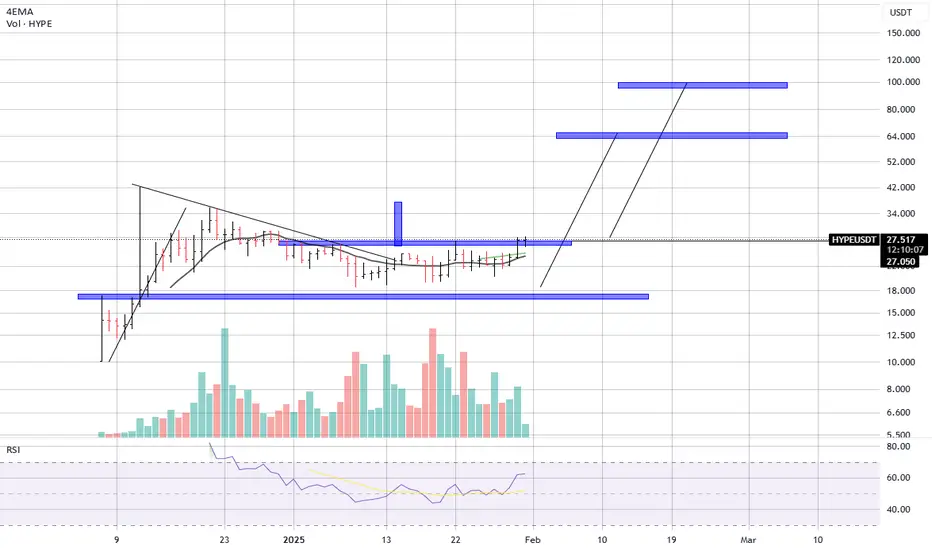
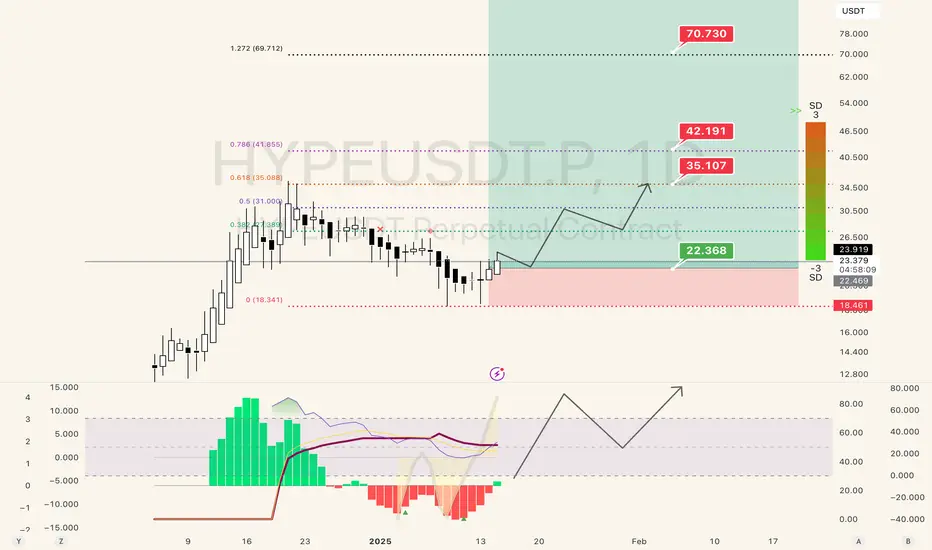
HYPER - A catalist for a new rising industry.
Hyper liquid is something you dont want to miss, not only for technical reasons, but also for a kind of rising sentiment/awareness towards the Dex - defi industry.
This project is really nedeed!
bohn, that said,
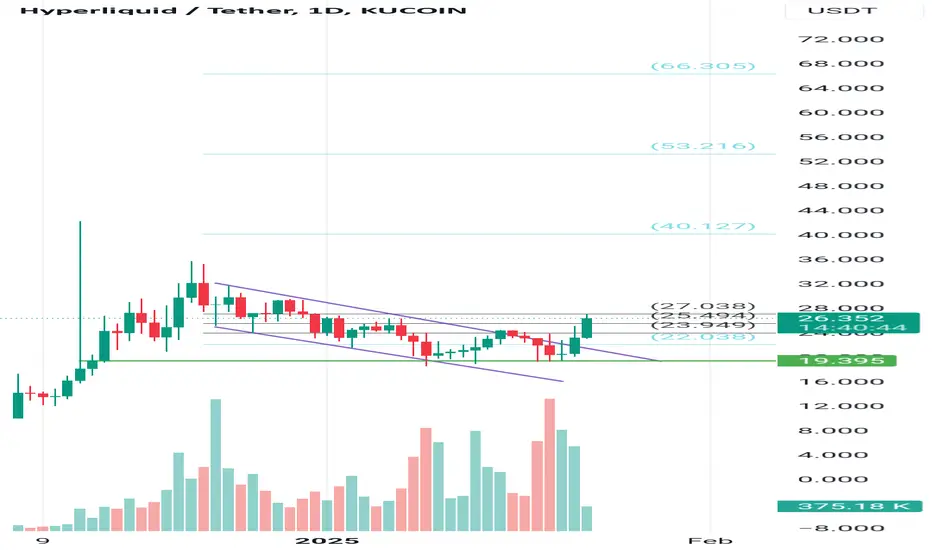
From a technical point of view we see a continuation pattern that is breaking up the 27.5$ a coin which can end up from 35$ and 42$ resistance price barrier level.
Why im saying that? Well there are not rising volumes when price goes up. Which can lead the price to station around 40$ and then if volumes will start to rise accordingly with the price action, it could lead towards our possible potential target around 65$ and far above if a trend will be sustained.
That could mean in these 6 months where BTC could top, also many coin will.
Stay tuned
Good trading!!
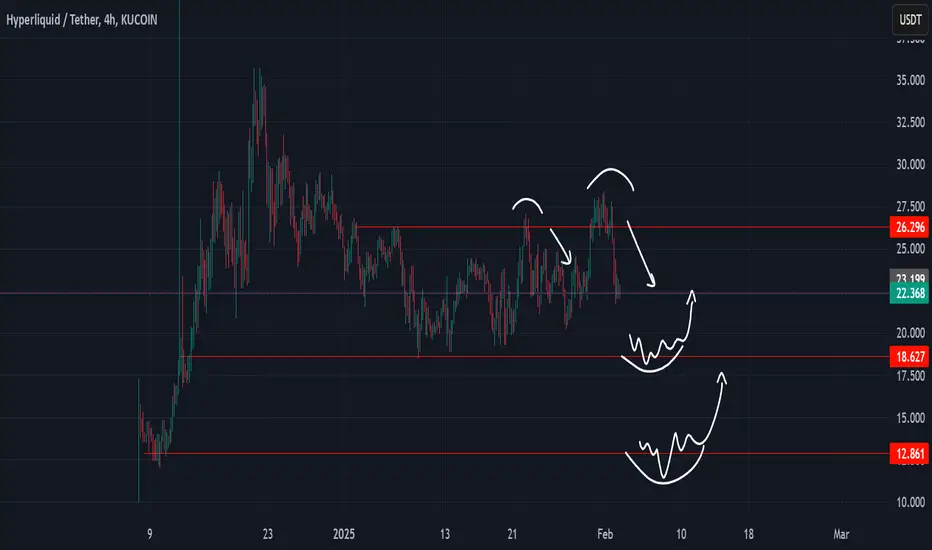
Hype is so Over ? MaybeHYPE like this ticker "HYPE" just hype when hype
after invalidation and back to inside we see downtrend again and first target is around 18
but if 18 break we will see price aroud 12
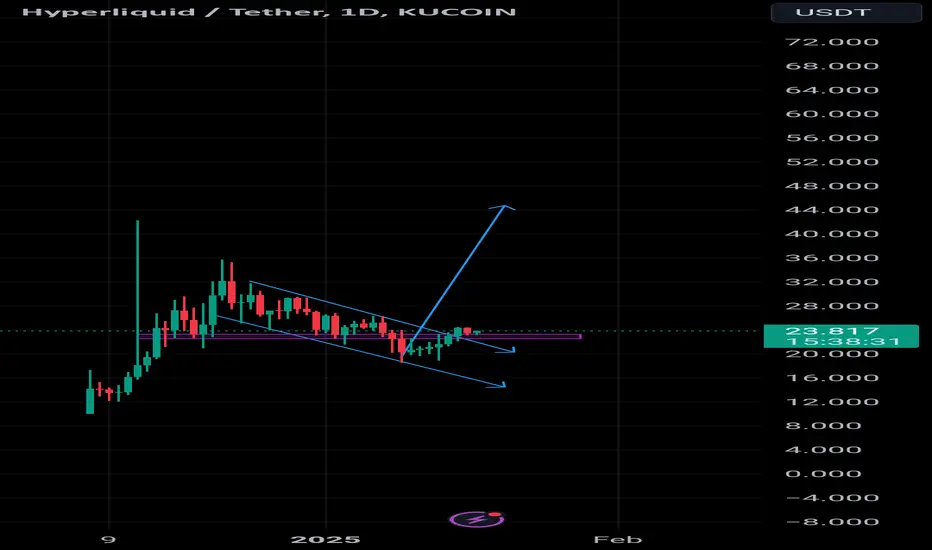
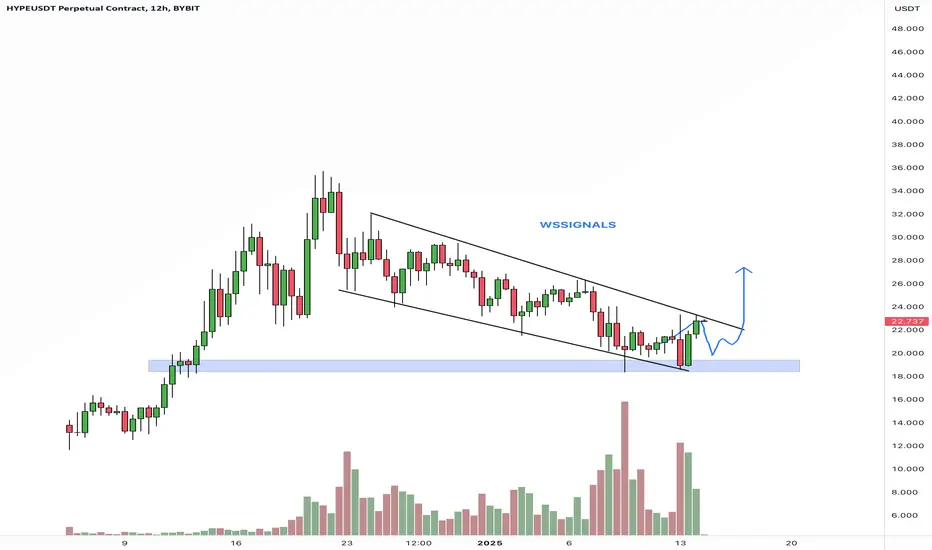
Hyperliquid first decentralised exchange with no onramp via tradFirst Decentralised chain, feel like this consolidation will either break to the downside and do nothing or will go bananas. Looks like we can hit targets 40, 50 and beyond. This all depends on the QT and more liquidity but feel like it could happen. A strong wall of buyers at $20 level so have a feeling this will rocket after this consolidation.

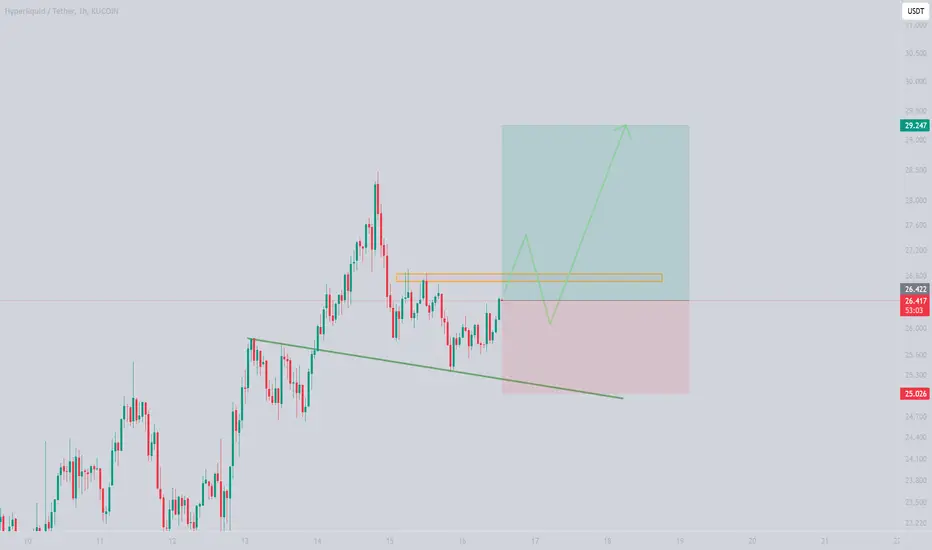
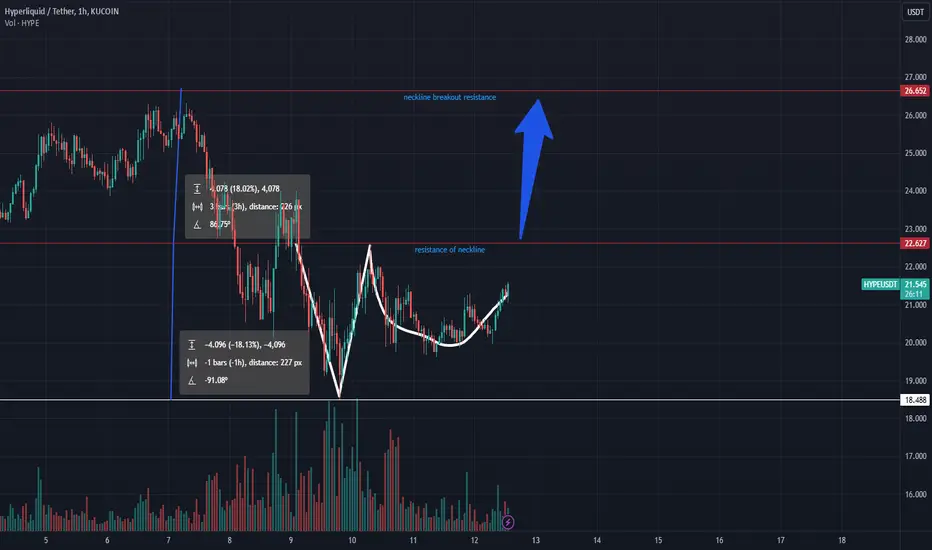
$HYPE/USDT AnalysisThe price has broken out of the black resistance trendline.
🎯 Target:
1️⃣ Green line level

HYPE Long Spot OpportunityMarket Context:
HYPE is demonstrating notable strength and is now positioned at a solid support level, offering a favorable risk-to-reward opportunity for a long spot trade.
Trade Details:
Entry Zone: $21 - $22
Take Profit Targets:
$25.1
$27.9
Stop Loss: Below $20
This setup provides an ideal opportunity to capitalize on HYPE’s strength while managing downside risk effectively. 📈
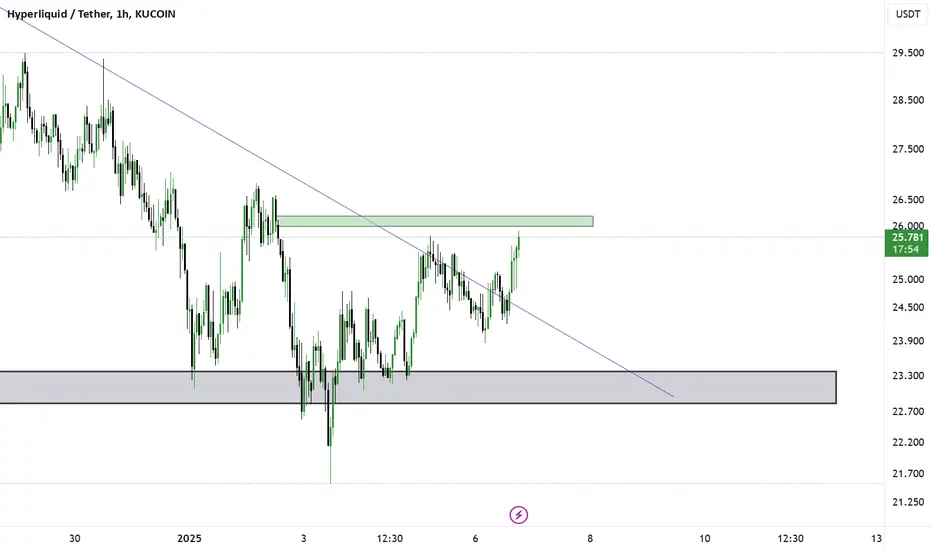
HYPE Intraday Highlights (Thesis Prediction)
Market Position:
Current Price: $25.57, up +9.8% from recent lows.
Resistance: $27.00 | Support: $25.00.
Trend: Bullish recovery, breaking previous resistance levels, with potential for continuation or consolidation.
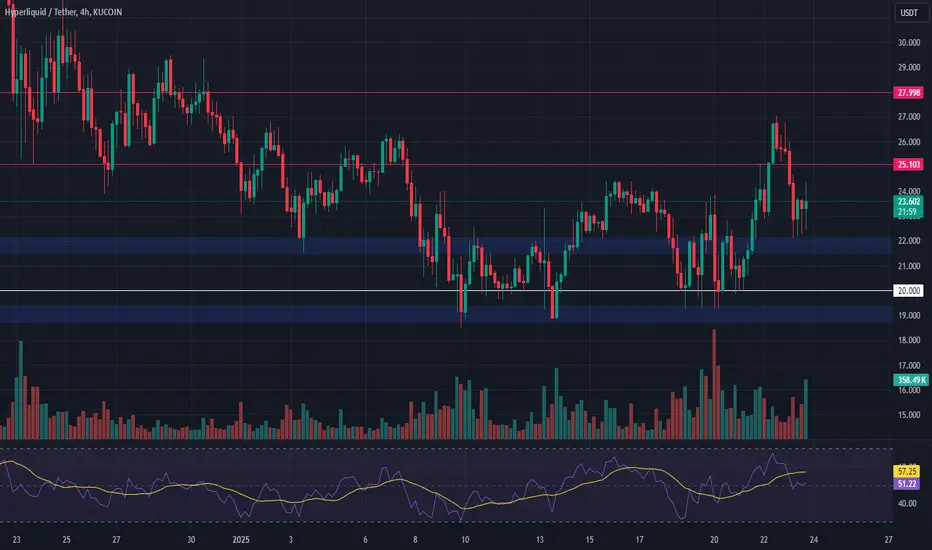
Key Technical Indicators:
RSI: 56.44, neutral with room for further price action.
MACD (30-min): Positive crossover, indicating building bullish momentum.
Bollinger Bands: Price near the upper band, signaling potential short-term overbought conditions or continued bullish tests.
On-Chain Insights:
Trading Volume: Up +59.34% to $622.47M, signaling heightened market interest.
Funding Rate (Bitget): 0.0288%, slightly bullish, reflecting market optimism.
Open Interest: Increased by +10.23% to $581.85M, suggesting accumulation by large traders or institutions.
Market Sentiment:
Sentiment: Strongly positive, fueled by the "HYPE Frenzy" event in December 2024.
Long/Short Ratio: 1.0396, indicating more long positions, aligning with bullish sentiment.
Scenarios:
Bullish (60%): Continuation above $27.00, potentially reaching $28.00+, driven by FOMO and sustained buying pressure.
Bearish (30%): Profit-taking or sentiment shift could pull prices back to $25.00 or $24.00 if support fails.
Sideways (10%): Consolidation between $25.00–$27.00 if sentiment cools or traders lock in profits.
Note: Keep an eye on resistance at $27.00 for a breakout or rejection, and monitor funding rates and volume for signs of momentum shifts. Always apply disciplined risk management.

Hype will comeBTC not breaking the high with impulse and lingering around isn-t good. so, please be careful

$HYPE HyperLiquid to the moonHYPE with that kind of chart pattern,
we will see GETTEX:HYPE reaching $50 soon?
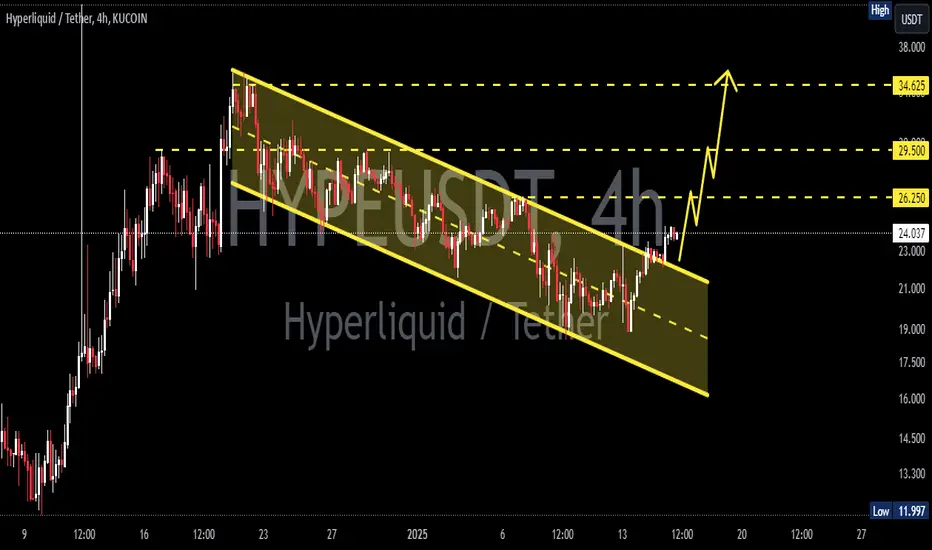
HYPEUSDT 4HHYPE ~ 4H
#HYPE At Time Frame 4H, Successfully exited this descending channel. The bulls are in control for now. Continued increases are expected from here
HYPE has a good set upHYPE has a good long trade set up with a good risk to reward. I will be accumulating at pull backs to levels between 22-23.
Modified MACD and VWAP is setting up to be a potential move in HYPE.
This is a daily chart so it may take some time to play out.
Not a financial advice and please DYOR.
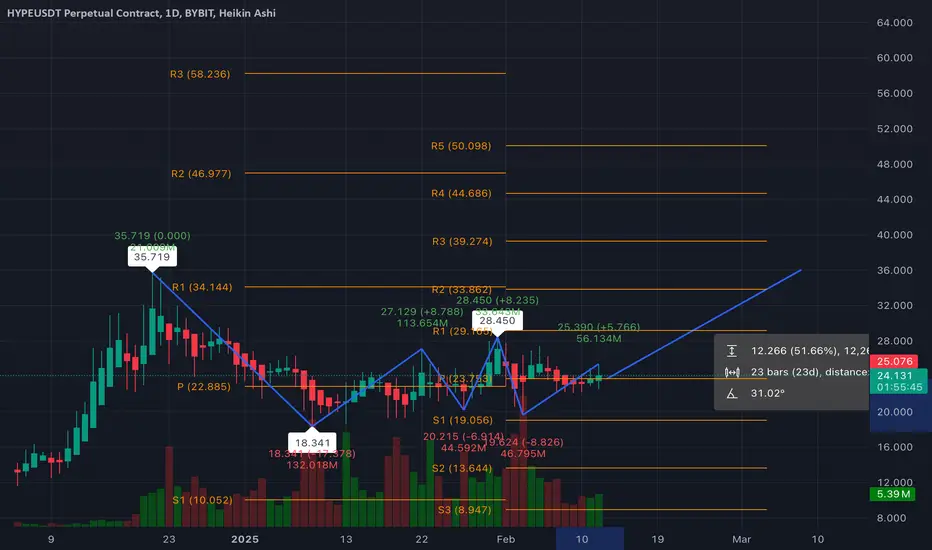
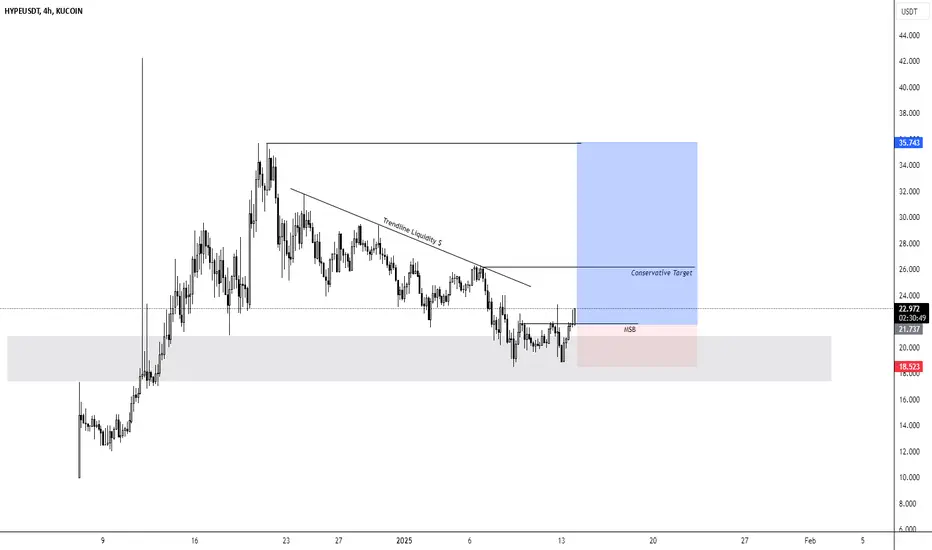
HYPE LONGThe HYPEUSDT pair is currently in a corrective phase after a strong upward move. The price has recently broken a significant level and is now testing the liquidity zone marked by a range of support (highlighted by the gray box). A potential reversal may occur as the price has started to form an MSB (Market Structure Break) and is showing early signs of bullish momentum.
Trade Entry:
Entry Level: Around $21.80, with price showing initial bullish signs.
Stop Loss: A stop is placed below the market structure break (MSB) at $18.52 to protect the position from further downside risk.
Targets:
Conservative Target: The first target is set around $26.18 (highlighted in blue), which aligns with the upper trendline and potential resistance levels.
Aggressive Target: A more extended target can be considered above the $35.74 mark depending on further price action.
Trade Rationale:
Trend: The market has been in a downtrend recently but is showing early signs of reversal.
Price Action: The price is testing a significant support zone, with bullish confirmation from the MSB.
Liquidity: The trendline liquidity levels provide an excellent potential for further price push toward the conservative target.
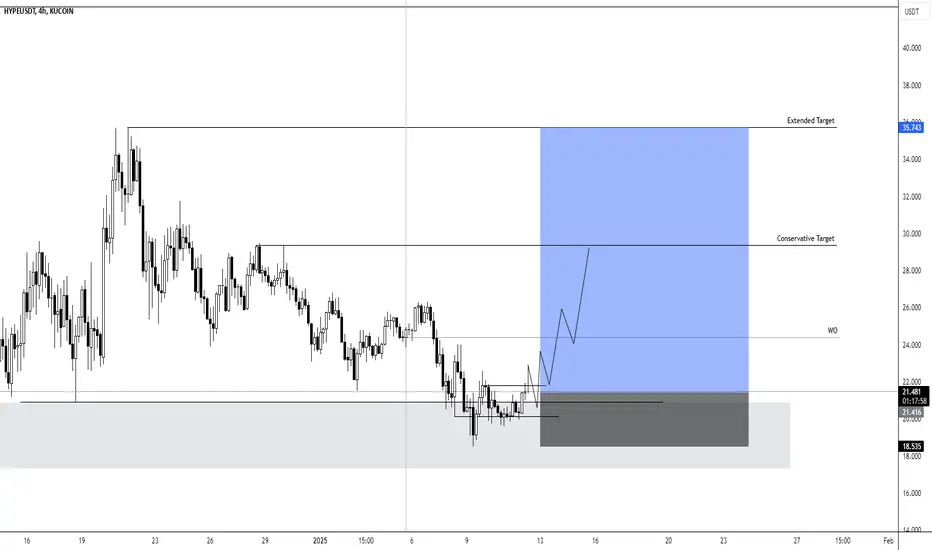
HYPE LongMarket Overview: Price is currently in a consolidation phase near the support level, showing signs of potential bullish movement. The key support level is identified at approximately 21.416 USDT.
Entry Point: The ideal entry zone lies just above the support region around 21.489 USDT. A breakout or price action showing strength above this level would be considered a signal to enter long.
Conservative Target: The first target for this trade is set at 30.000 USDT, where price may encounter resistance. It offers a more cautious take on the potential upside.
Extended Target: A more aggressive target is placed around 35.743 USDT. This is the extended target zone where price could potentially head if the trend continues favorably.
Stop Loss: The stop loss should be placed just below the support level at 18.535 USDT. This ensures minimal risk in case the price moves against the position.
Trade Notes:
Patience is required to wait for confirmation of the breakout.
Monitoring price action around the support zone is crucial for making adjustments.
Consider trailing stop orders if price moves toward the extended target.
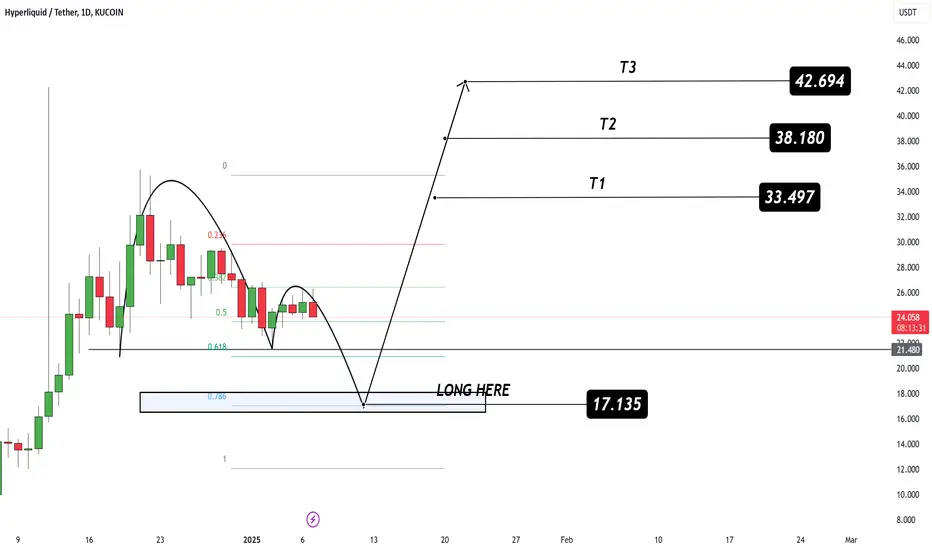
HAYPE USDT#HAYPE $HAYPE
Token is currently retesting the key support zone at $17.135 on the daily chart 💁♂️
This retest signals a strong potential for bullish continuation ahead 📈
Expect upward momentum with targets at $33.497, $38.180, and $42.694 🎯