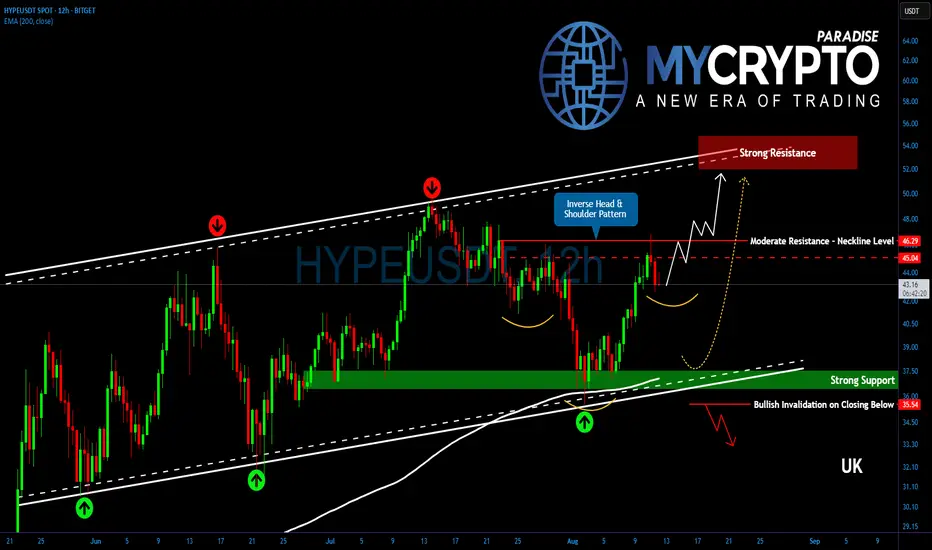
Breakout or Breakdown? HYPE Approaches Critical Price ZoneYello, Paradisers! Could we be moments away from #HYPE’s next explosive leg up? The chart is giving us some big clues right now…
💎HYPE continues to stand out as one of the market’s strongest altcoins, maintaining its climb inside a well-defined ascending channel. On top of that, an inverse head and
Related pairs
We pull out Pink for the 50's We should see Hype push up to the 50's-60's on this next push up. Will be watching for Eth to lead the way for Alts.
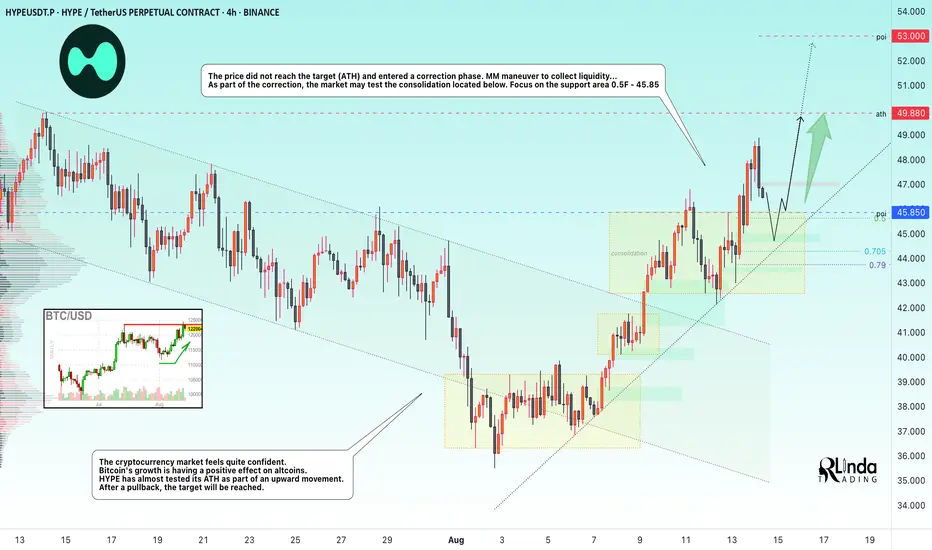
HYPEUSDT → Correction for consolidation before ATH breakoutBINANCE:HYPEUSDT.P looks quite strong and is just a few cents away from reaching its ATH. The coin needs to build up its potential to reach its target and break through a strong resistance level...
The cryptocurrency market feels quite confident. Bitcoin's growth is having a positive effect on
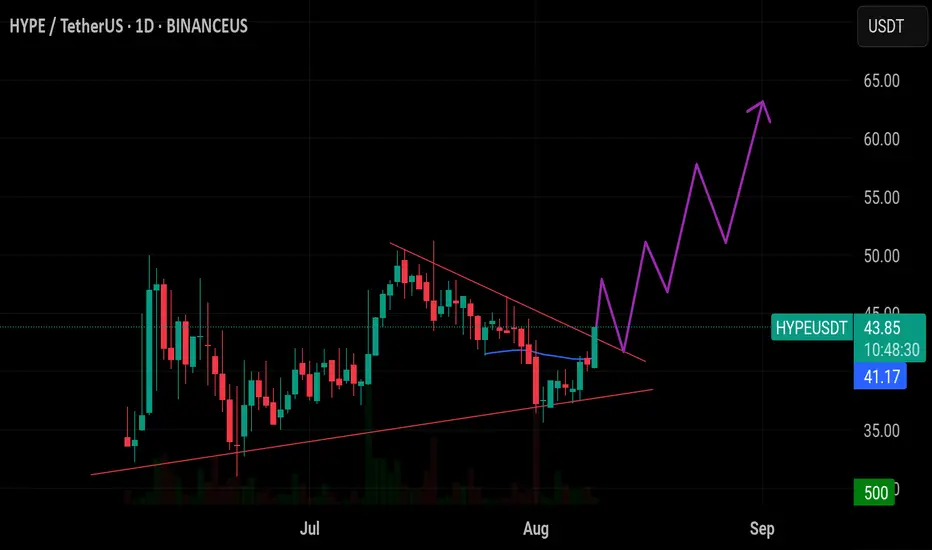
$HYPE/USDT has broken out of its wedge pattern with bullish mome$HYPE/USDT has broken out of its wedge pattern with bullish momentum, aiming for $50–$60, but setup invalidates if the daily closes below $38.
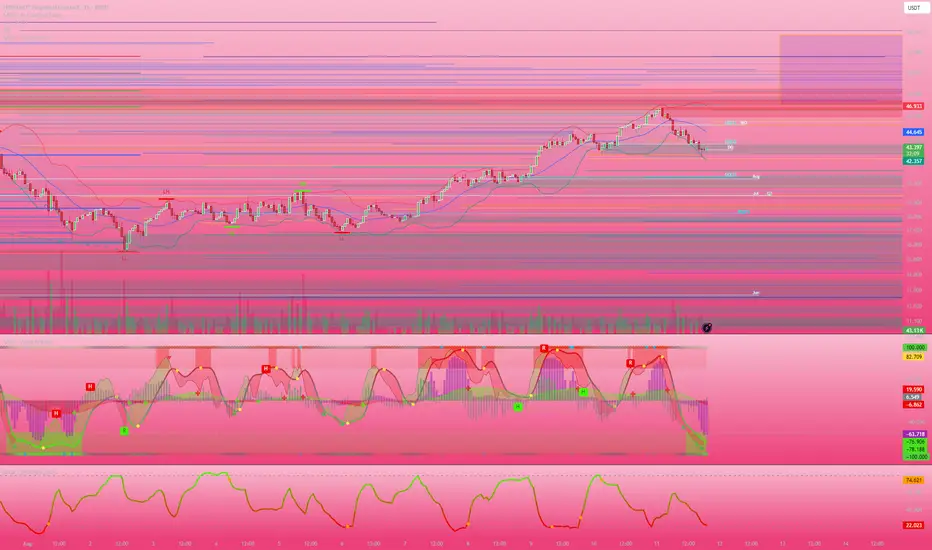
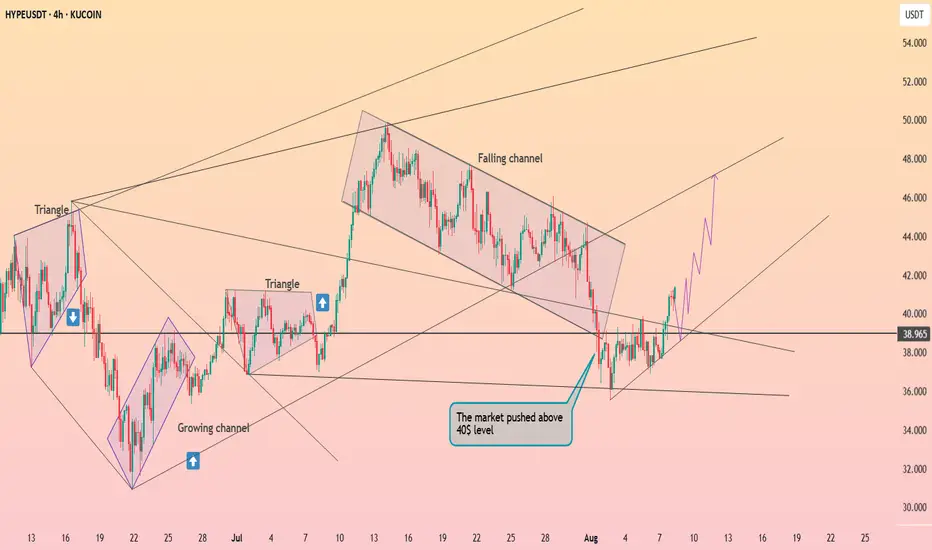
Hyperliquid is back above $40 ┆ HolderStatKUCOIN:HYPEUSDT rebounded through the 40 handle after completing a measured drop inside a falling channel. The reclaim came right at multi‑month trend support drawn from the “growing channel,” turning 38–40 into a key demand shelf. Momentum broke the channel’s midline and the market is attempting t
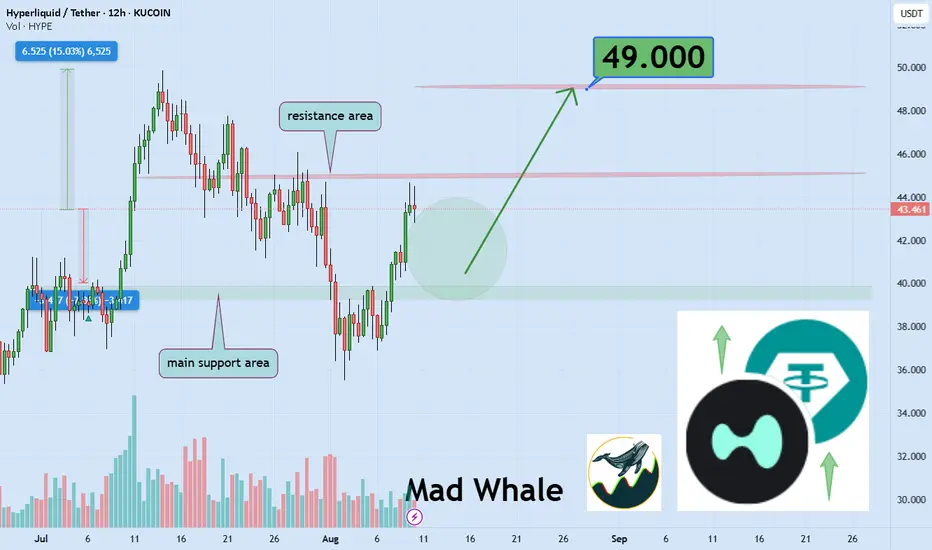
HyperLiquid Poised for 15% Gain, Targeting $49 Resistance LevelHello✌️
Let’s analyze HyperLiquid’s price action both technically and fundamentally 📈.
🔍Fundamental analysis:
More developer tools on HyperEVM could boost HYPE’s usefulness. It already handles 60% of DEX perpetual volume (Defiant), and stronger connections might keep supporting its recent 73%
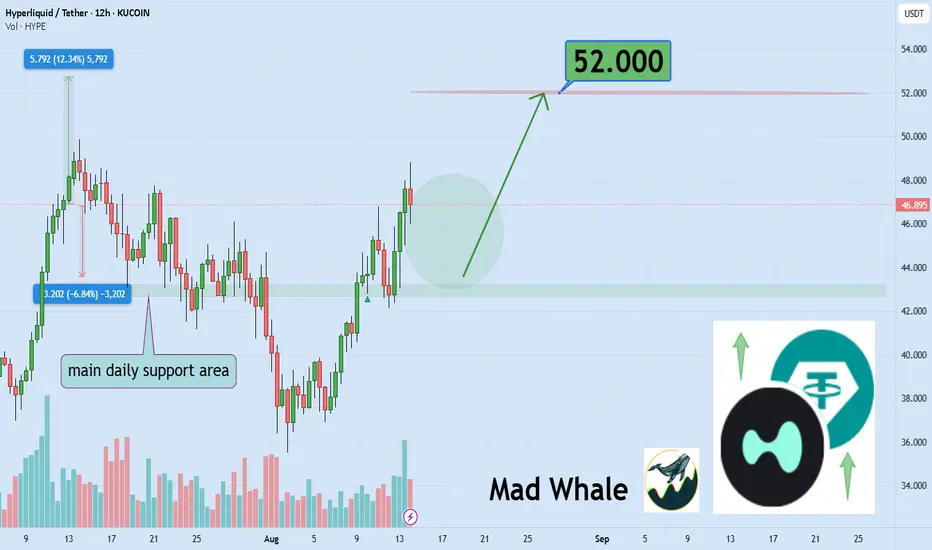
Hyperliquid Eyes 12% Upside Target $52 Amid Bullish MomentumHello✌️
Let’s analyze Hyperliquid’s price action both technically and fundamentally 📈.
🔍Fundamental analysis:
Hyperliquid has earned $305.9M in fees since Dec 2024, with 97% going to buybacks removing ~333K HYPE each month. It now handles 70% of on-chain perpetual volume, processing $248B mon
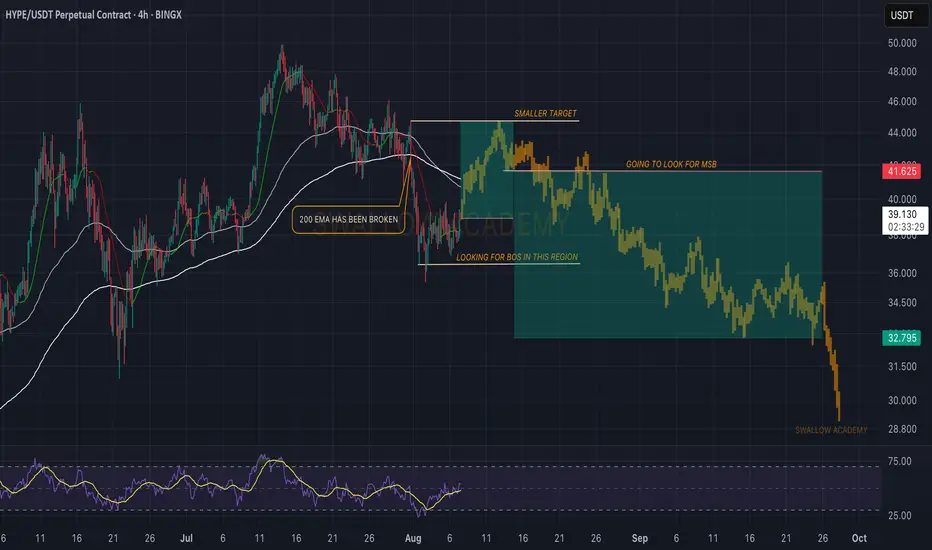
Hyperliquid (HYPE): Looking For Recovery | Possible Buy AreaHYPE has had its fun with 200EMA, which recently got broken and now most likely we are going for a retest of that broken zone, which also would fill a local FVG area.
That's what we are looking for rn, a smaller recovery before another wave of sell-side movement.
Swallow Academy
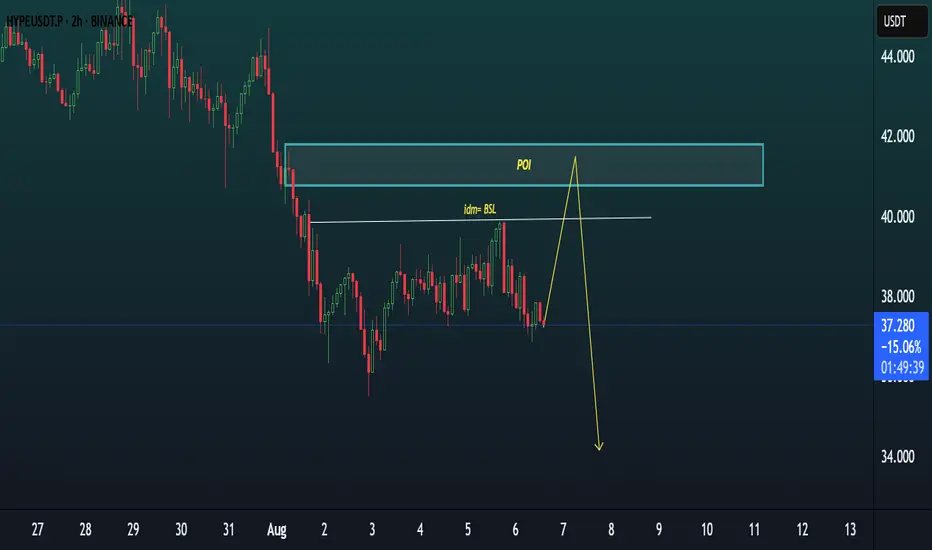
HYPE/USDT 2H SETUP.HYPE/USDT 2H Setup 🔥
Price is targeting upside liquidity near internal equal highs (BSL).
Watch for a reaction inside the POI (Premium OB Zone) around $41–$42.
📌 Plan:
Expect a short-term pump to take out buy-side liquidity
Look for rejection or reversal from POI for a high-probability shor
Hypecoin weekend short to $35.75hypeusdt short
Sl: $36.72-38.85
Tp1: $36.34---50%
Full Exit: $35.75
2.21-3 RR
DTT strategy applied
Time sensitive

See all ideas
Summarizing what the indicators are suggesting.
Oscillators
Neutral
SellBuy
Strong sellStrong buy
Strong sellSellNeutralBuyStrong buy
Oscillators
Neutral
SellBuy
Strong sellStrong buy
Strong sellSellNeutralBuyStrong buy
Summary
Neutral
SellBuy
Strong sellStrong buy
Strong sellSellNeutralBuyStrong buy
Summary
Neutral
SellBuy
Strong sellStrong buy
Strong sellSellNeutralBuyStrong buy
Summary
Neutral
SellBuy
Strong sellStrong buy
Strong sellSellNeutralBuyStrong buy
Moving Averages
Neutral
SellBuy
Strong sellStrong buy
Strong sellSellNeutralBuyStrong buy
Moving Averages
Neutral
SellBuy
Strong sellStrong buy
Strong sellSellNeutralBuyStrong buy
Displays a symbol's price movements over previous years to identify recurring trends.
Frequently Asked Questions
The current price of Hyperliquid/Tether (HYPE) is 47.145 USDT — it has fallen −1.87% in the past 24 hours. Try placing this info into the context by checking out what coins are also gaining and losing at the moment and seeing HYPE price chart.
Hyperliquid/Tether price has risen by 22.65% over the last week, its month performance shows a −1.84% decrease, and as for the last year, Hyperliquid/Tether has increased by 78.55%. See more dynamics on HYPE price chart.
Keep track of coins' changes with our Crypto Coins Heatmap.
Keep track of coins' changes with our Crypto Coins Heatmap.
Hyperliquid/Tether (HYPE) reached its highest price on Jul 14, 2025 — it amounted to 49.852 USDT. Find more insights on the HYPE price chart.
See the list of crypto gainers and choose what best fits your strategy.
See the list of crypto gainers and choose what best fits your strategy.
Hyperliquid/Tether (HYPE) reached the lowest price of 9.329 USDT on Apr 7, 2025. View more Hyperliquid/Tether dynamics on the price chart.
See the list of crypto losers to find unexpected opportunities.
See the list of crypto losers to find unexpected opportunities.
The safest choice when buying HYPE is to go to a well-known crypto exchange. Some of the popular names are Binance, Coinbase, Kraken. But you'll have to find a reliable broker and create an account first. You can trade HYPE right from TradingView charts — just choose a broker and connect to your account.
Hyperliquid/Tether (HYPE) is just as reliable as any other crypto asset — this corner of the world market is highly volatile. Today, for instance, Hyperliquid/Tether is estimated as 4.35% volatile. The only thing it means is that you must prepare and examine all available information before making a decision. And if you're not sure about Hyperliquid/Tether, you can find more inspiration in our curated watchlists.
You can discuss Hyperliquid/Tether (HYPE) with other users in our public chats, Minds or in the comments to Ideas.