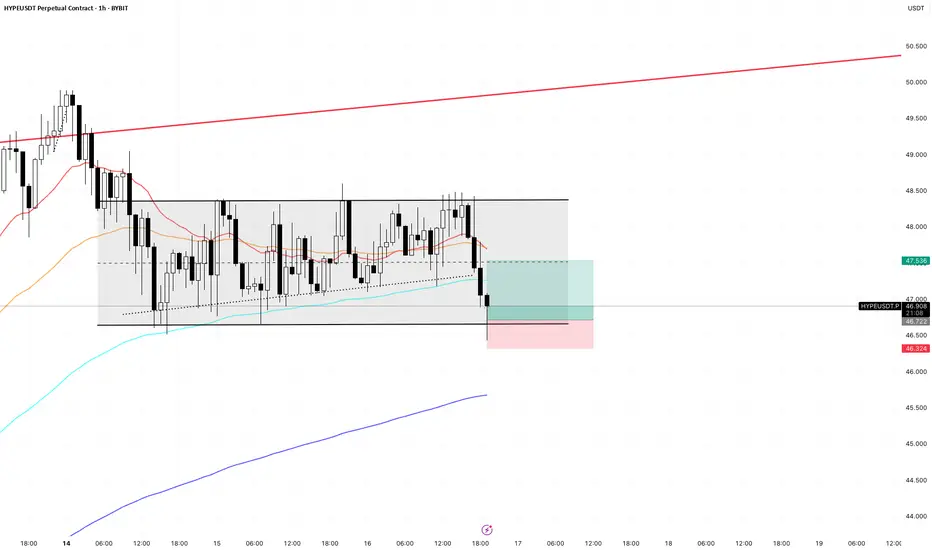
HYPEUSDT at Support HYPEUSD is trading in a symmetrical triangle and price has now reached the support trendline the price may reverse from here to reach the upper trendline resistance .
HYPEUSDT trade ideas

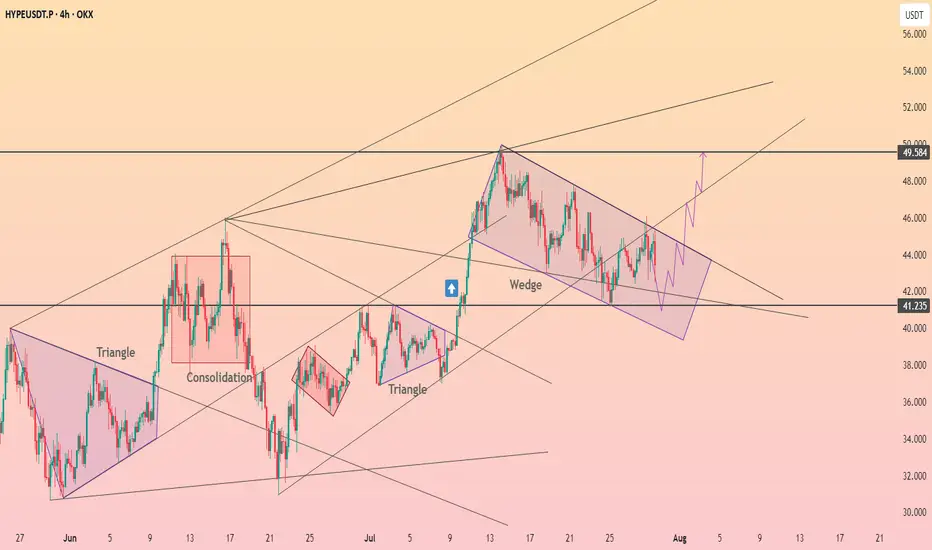
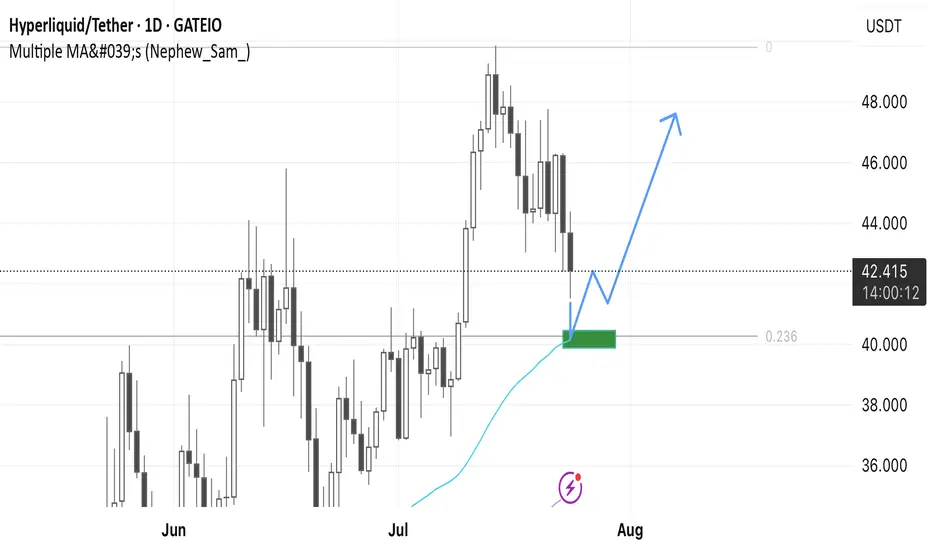
Hyperliquid reached the upper limit of the wedge ┆ HolderStat$BINANCE:HYPEUSDT is currently trading within a falling wedge after a sharp bullish move. Price is consolidating near key support around 41.2, showing signs of pressure building for a potential breakout. A clean break above the wedge resistance may open the path toward 49.5, aligning with the higher trend channel projection.
Hypecoin short to $41.139Just now opened up a short position on hypecoin. Aiming for new lows around $41.139
Price is high on weekly tf and seems to be in a correction phase of the market. Lower tf likely to dump down to facilitate this.
Sl: $44.665
Tp1: $42.061
tp2: $41.139

HYPE | Sweep & Reclaim SetupPlan:
Watching for a sweep into the blue H4 Untapped Demand zone, then a reclaim of 41.237 (green line) to add longs.
Ideal target: new ATH and 55 extension.
If the blue zone fails or we can't reclaim 41.237, risk-off mode: equal lows at 30.6 could be the draw.
Reasoning:
A sweep into demand would reset local liquidity and trap late shorts.
Reclaiming 41.237 confirms a shift in momentum and invalidates the breakdown.
Structure is bullish above 41.237; below, risk increases for deeper downside.

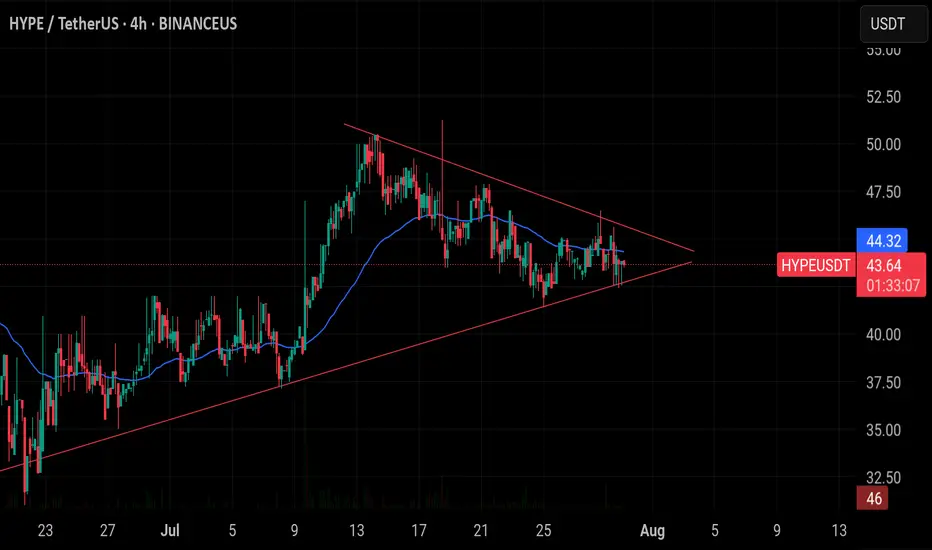
$HYPE/USDT is sitting at the edge of a triangle.$HYPE/USDT is sitting at the edge of a triangle. If it breaks above $44, it could jump to $52. But if it falls and close 4h candle below $42, the setup will fail.
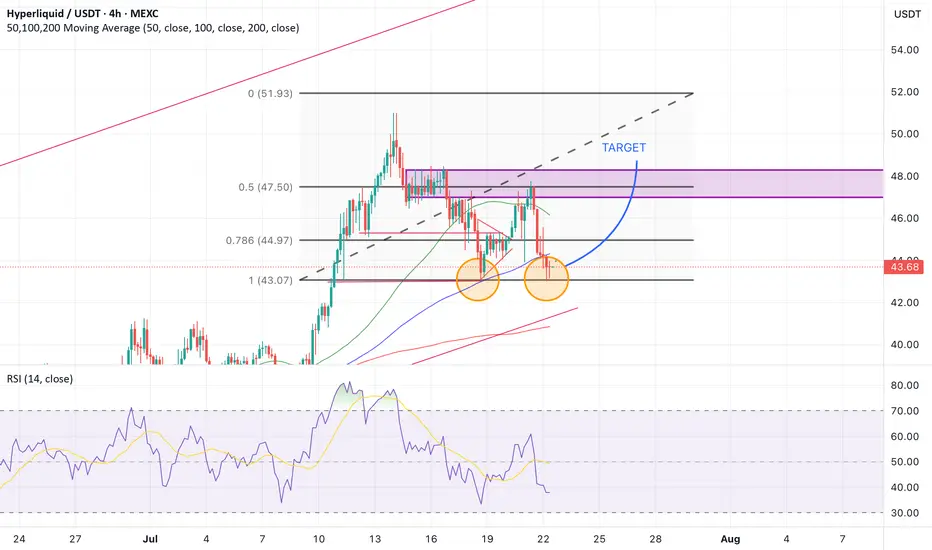
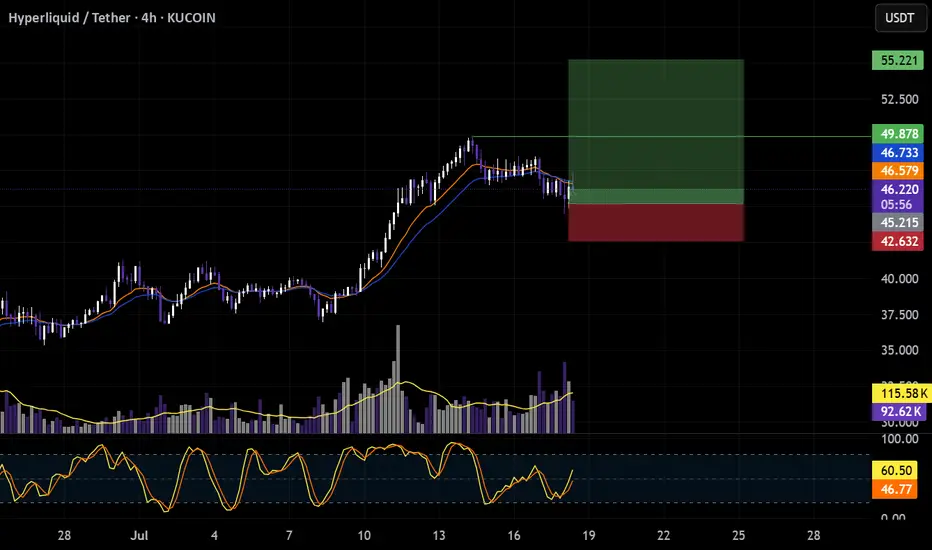
Lingrid | HYPEUSDT Potential Continuation After PullbackKUCOIN:HYPEUSDT is bouncing from a higher low near the 42.070 zone after breaking a descending flag pattern. Price action remains above the ascending support trendline while pressing into a key structure retest. As long as GETTEX:HYPE stays above 42, a bullish leg toward the 49.700 resistance remains likely. Structure suggests a resumption of the impulse phase within the broader uptrend.
📉 Key Levels
Buy trigger: Clean breakout above 45.00
Buy zone: 41.5 – 43.0 (support + flag bottom)
Target: 49.700
Invalidation: Close below 40.00
💡 Risks
Breakdown below the ascending support would weaken the bullish setup
Failure to reclaim mid-flag resistance may lead to deeper consolidation
Broader market weakness in altcoins could delay breakout momentum
If this idea resonates with you or you have your own opinion, traders, hit the comments. I’m excited to read your thoughts!

HYPE | #12h #long — Major Reversal Setup from 200 EMA & DemandStarted building a position around 42.7 due to the under/over of the H4 EMA 200 and the prior consolidation high. However, there's an untapped H4 demand zone beneath — if we get a flush into that area and then reclaim 41.2 and the H4 EMA 200, I'll be adding to my position.
Invalidation:
Losing the H4 demand would be my cut-off, potentially opening the door for a sweep of the equal lows near 30.
Scenario:
— If the 200 EMA holds or we see #OneMoreLow to trap sellers and reclaim, the setup remains very bullish.
— Targets: At minimum, a stab into ATH, with the potential for a full extension up to 55.3 and beyond.
Reasoning:
This is a classic under/over setup with demand untested and a clear invalidation level. If buyers step in and reclaim key levels, expect explosive continuation.

Hype pumping??Whereas I have been a little single on my futures account, I earlier too a leverage position on hype and it's standing stronger than the spot positions I took over then weekend.

Hyperliquid (HYPE): Good Buying Opportunity or Great Dump ?Hyperliquid coin has been gliding the EMAs too smoothly, where we are seeing strong buyside dominance. Just like last time we are going to keep an eye on EMAs (Specially the 200) for any possible breakdowns that might trigger bigger movement to lower zones, but while price stays above that EMA we are looking for further movement to upper zones, just like previouse times.
Swallow Academy
HYPE/USDT Is moving sideways in a tight consolidation rangeHYPE/USDT is moving sideways in a tight consolidation range between $41.00–$45.90. Moderate whale activity is evident from on-chain data, alongside ecosystem factors like TVL at ~$800M and a 54% fee revenue allocation program, but broader market sentiment (e.g., Bitcoin correlation) adds caution.
Key points with real chart zones:
The recent pullback was likely a "liquidity sweep": Price dropped to test ~$41.00-$41.05 support levels, triggering liquidations and enabling accumulation at lower prices, though this is common in volatile markets.
Bounce and consolidation: After the low, price reclaimed ~$42.00-$43.00, showing buyer interest, but volume remains flat, suggesting potential for either direction without strong conviction.
Ascending channel structure remains intact: The 1D ascending channel holds if price stays above $39.00-$40.20 (lower boundary, golden pocket) and below $46.00-$48.00 (upper boundary). Additional indicators: RSI at neutral 50 (no divergence yet), and OBV trending flat—watch for shifts.
If price breaks above the range: A confirmed H1/H4 close above $45.90 with rising volume could target $48.00 and $50.00-$52.00, but only if BTC holds above $65K (high correlation risk).
If price breaks down and holds below: Action below $41.00 may test $39.00-$40.20, with extension to $37.20-$38.00 if supports fail—amplified by macro factors like upcoming Fed decisions.
Bottom line: HYPE is in a neutral consolidation zone between $41.00–$45.90. Upside to $48.00+ possible with confirmation, but downside to $39.00 equally likely amid flat indicators and external risks. On-chain favors mild positivity, but balance with stops and macro monitoring—ranges can fake out in either direction.
Tip: Avoid chasing moves without confirmation. Set alerts at $45.90 (upside) and $41.00 (downside), track RSI for divergences, volume for accumulation, and news like Fed updates or BTC trends. Position size small (<2% portfolio)—trade safely and always do your own research!
This is not financial advice!

HYPEUSDT Potential Continuation After Pullback
HYPEUSDT
is bouncing from a higher low near the 42.070 zone after breaking a descending flag pattern. Price action remains above the ascending support trendline while pressing into a key structure retest. As long as
HYPE
stays above 42, a bullish leg toward the 49.700 resistance remains likely. Structure suggests a resumption of the impulse phase within the broader uptrend.
📉 Key Levels
Buy trigger: Clean breakout above 45.00
Buy zone: 41.5 – 43.0 (support + flag bottom)
Target: 49.700
Invalidation: Close below 40.00

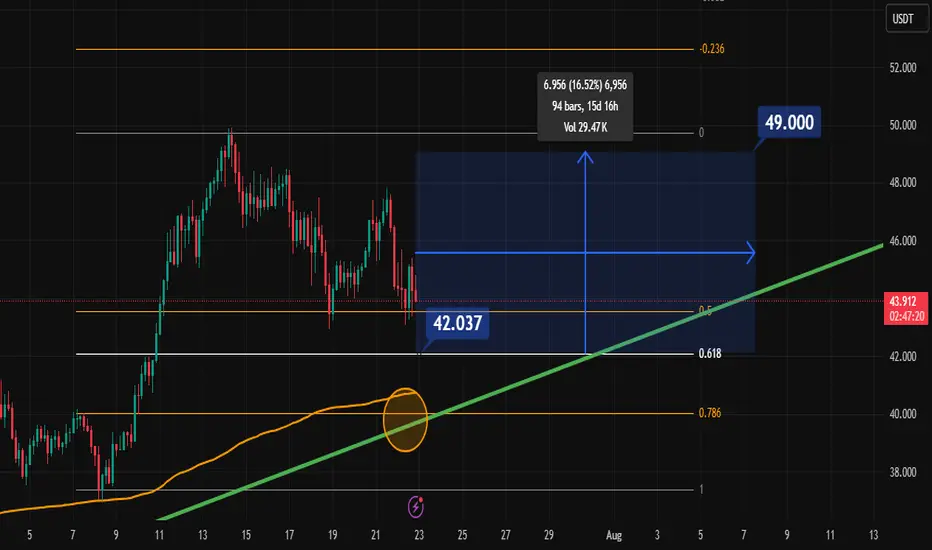
HYPEUSDT - Analysis for Immediate Long EntryChart Analysis
Looking at the daily chart, the story is pretty clear. HYPE has been in a powerful uptrend since April. We saw it hit a recent high of around $49-$50. As expected after such a strong run, a pullback has started.
The price has now retraced to the $42.50 level. This is significant. This exact area was the peak of the previous rally in early July. Old resistance becoming new support is one of the most reliable patterns in trading. The chart shows the price is currently testing this level. The small green arrows (fractals) on the chart confirm these key swing points. This is our entry zone. The setup looks solid for a long position.
Sentiment Analysis (The "Why")
Time to check the news to see if it supports our technical view.
Positive News:
"Zircuit Launches 'Hyperliquid' to Simplify and Secure Cross-Chain DeFi Trading" (1 hour ago): This is fresh, positive news. New integrations and launches on the Hyperliquid platform suggest ecosystem growth and user adoption, which is fundamentally bullish for the HYPE token.
"Whale Deposits $3M USDC for 20x ETH Long" (10 hours ago): This shows that large, sophisticated traders ("whales") are actively using the platform for significant trades. High volume and large positions signal confidence in the platform's reliability and liquidity.
"Ethereum News: James Wynn Opens 25x Leveraged Position Worth 12 Million on Hyperliquid" (1 day ago): More evidence of heavy hitters using the platform. This kind of activity can attract more users and build a strong reputation.
Negative News (The "Noise"):
"Hype News: Why is HYPE's price down today?" (3 hours ago): This article is likely just explaining the natural price correction we're seeing on the chart. It's not necessarily bearish; it's just market dynamics. A pullback after a strong rally is healthy and expected. It doesn't change the underlying bullish structure.
Overall Sentiment : The sentiment is bullish. The price dip appears to be a technical retracement, while the news flow points to strong fundamentals and growing adoption of the Hyperliquid platform. This combination of a technical setup and positive sentiment gives me the confidence to proceed.
The Trade Plan
It's time to define the levels. We're going long with a market entry now, around $42.50.
Entry Reason: Entering a long position based on the price retracing to a key support level (previous resistance) in a clear uptrend, supported by positive news flow.
Stop Loss (SL): $38.50
Reason: A break below $39.00 would invalidate our trade idea. This level is clearly below the current support zone and below the swing low from mid-July. Placing the SL at $38.50 gives the trade enough room to breathe without risking a catastrophic loss if we're wrong.
Take Profit 1 (TP1): $49.50 (Moonbag Target)
Reason: This is just below the recent all-time high of ~$50. It's a logical first target where the price might face resistance. Hitting this level would be the first confirmation that the uptrend is resuming.
Action: At this point, we take initial profits and move the trailing stop to our entry price to make the rest of the trade risk-free.
Take Profit 2 (TP2): $58.00
Reason: This is a psychological and technical extension level. A common way to project a target after breaking an all-time high is using Fibonacci extensions or measured moves. A move to $58 would represent a significant new leg up.
Action: When TP2 is hit, we move the trailing stop up to the TP1 level ($49.50) to lock in more profit.
Take Profit 3 (TP3): $65.00
Reason: This represents the next major psychological number and a potential area for a medium-term top. It continues the measured move projection from the previous price swings.
Action: When TP3 is hit, we move the trailing stop up to the TP2 level ($58.00).
Take Profit 4 (TP4): $75.00 (Final Target)
Reason: This is our "blue sky" target. In a strong bull market, assets can run much further than expected. $75 is a major psychological milestone and a reasonable final target for this trade.
Action: Close all remaining positions.
Conclusion:
The plan is set. The HYPEUSDT trade offers a good risk-to-reward ratio based on a solid technical setup and bullish sentiment. We enter now and manage the trade according to the plan. Let's see how it plays out.

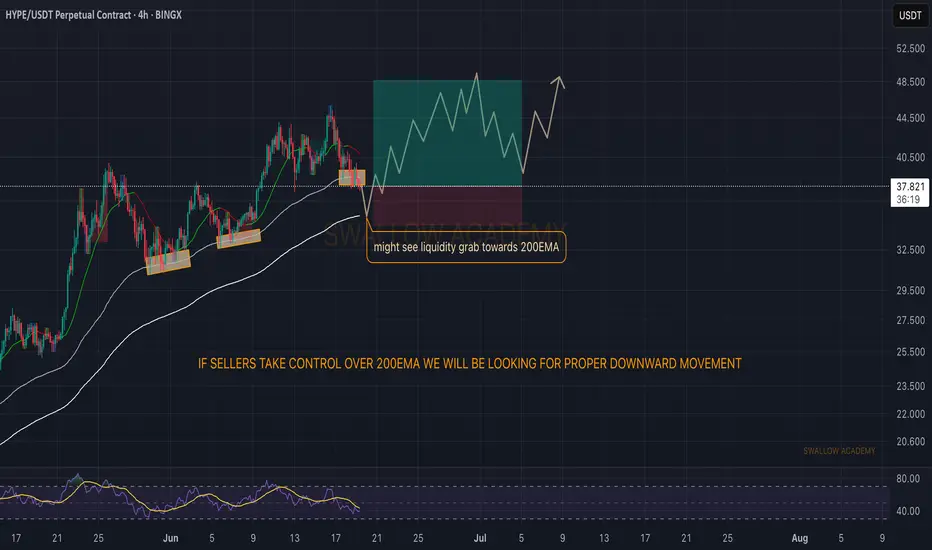
Hyperliquid (HYPE): 200EMA Has Been Holding Trend Very WellHYPE has been respecting that 200 EMA on the 4-hour timeframe pretty well, and once again we have fallen back to that EMA.
We are looking for some kind of BOS on smaller timeframes, which would give us a good buying opportunity and potentially form a new local high on the current timeframe.
Swallow Academy
HYPE/USDT BUY OR LONG ZONEThis is a perfect zone to long as the 0.23 Fib retracement and 50MA converges in the green zone to give the price a strong support
Does Hype Pump from 42 to 49 before August?Well, I have my SPOT chips on that.
I wanna hold on to that in the next 15 days. That is Untill 7th August.
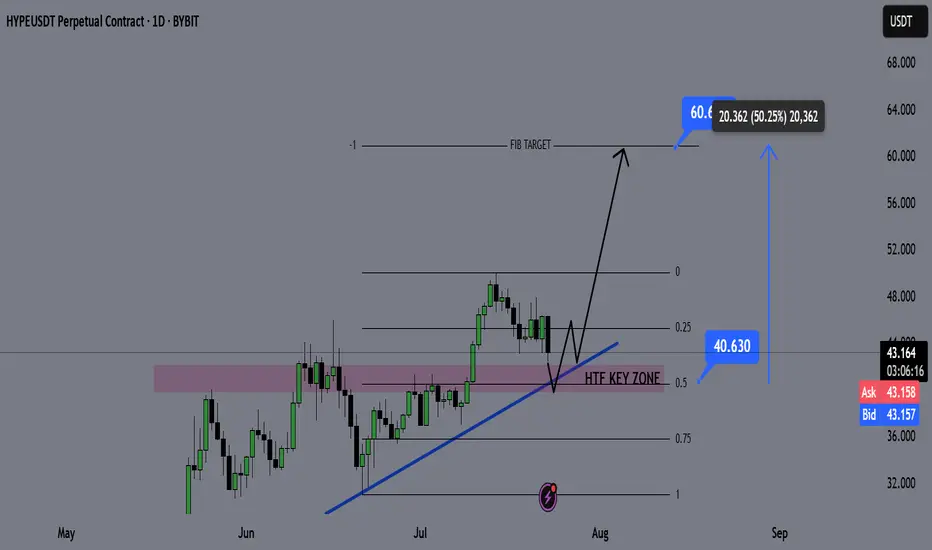
HYPE Swing Long Opportunity - Altcoin Season📌 Fundamental Sentiment:
The crypto market — alongside broader risk assets — continues to gain traction. This momentum is largely fueled by rising expectations of policy shifts in the U.S., with Trump intensifying pressure on Jerome Powell and advocating for aggressive rate cuts from the Fed.
📌 Technical Analysis:
HYPE is approaching a key HTF bullish trendline, and confluences are stacking up in the same region:
✅ HTF Demand Zone
✅ Equilibrium (EQ) of the HTF bullish trend
✅ Bullish Trendline Support
These three HTF confluences overlapping at the same price zone indicate a high-probability setup for a significant bounce and a possible swing long opportunity.
📌 Gameplan:
Price hits HTF bullish trendline
HTF demand zone gets tested
EQ level tapped → discount offered to buyers
📌 LTF Confirmation Criteria:
I’ll wait for:
A 1H swing break
A strong 4H rejection candle
These will confirm momentum shift. If confirmed, I’ll enter a swing long.
🎯 Target: $60
💰 Potential gain: ~+50%
❗ Stop-loss: Below the swing low that triggers the LTF confirmation
—
🔔 Follow for daily setups and weekly macro recaps
💬 Drop your chart or questions below!
Hyperliquid is retesting the $44 level ┆ HolderStatKUCOIN:HYPEUSDT has flipped $0.074 into support. Holding this level could trigger a move to $0.088. Structure favors bulls.

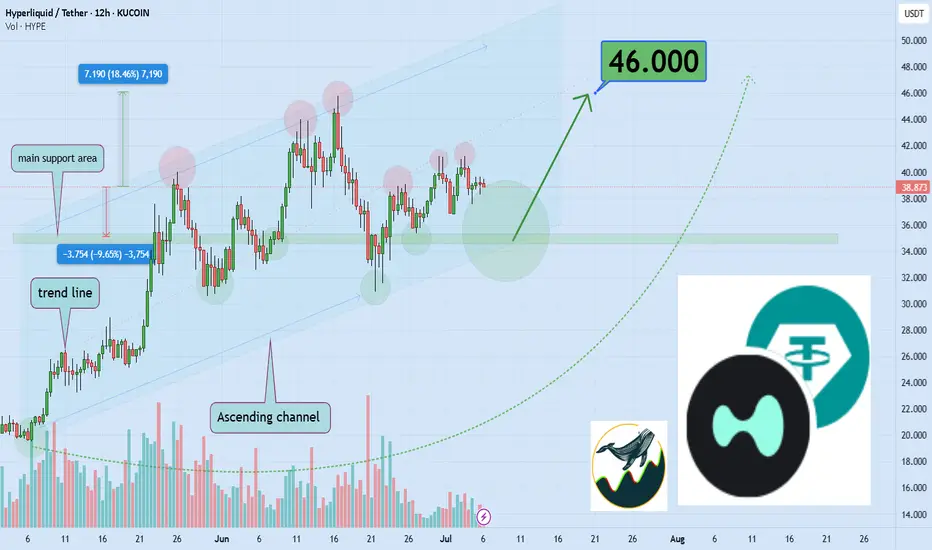
Watch Hyperliquid Surge 18% to $46 Key Resistance LevelHello,✌
let’s dive into a full analysis of the upcoming price potential for Hyperliquid 🔍📈.
KUCOIN:HYPEUSDT is trading within a reliable daily ascending channel and is currently near its lower boundary, where a strong daily support zone has formed. This setup suggests a potential upside of at least 18%, with a target around $46 , which aligns closely with a key trendline. 📈
✨ Need a little love!
We pour love into every post your support keeps us inspired! 💛 Don’t be shy, we’d love to hear from you on comments. Big thanks , Mad Whale 🐋
DOUBLE BOTTOM ON 4H CHART OF HYPE/USDTHype currently got rejected from 47.50 zone and took a sharp decline to last support level of 43.05 where it bounced from a day back as well.
Now we can see double bottom on chart and also fib level acting as a support
I am expecting hype to currently move towards 50 if this support zone holds.
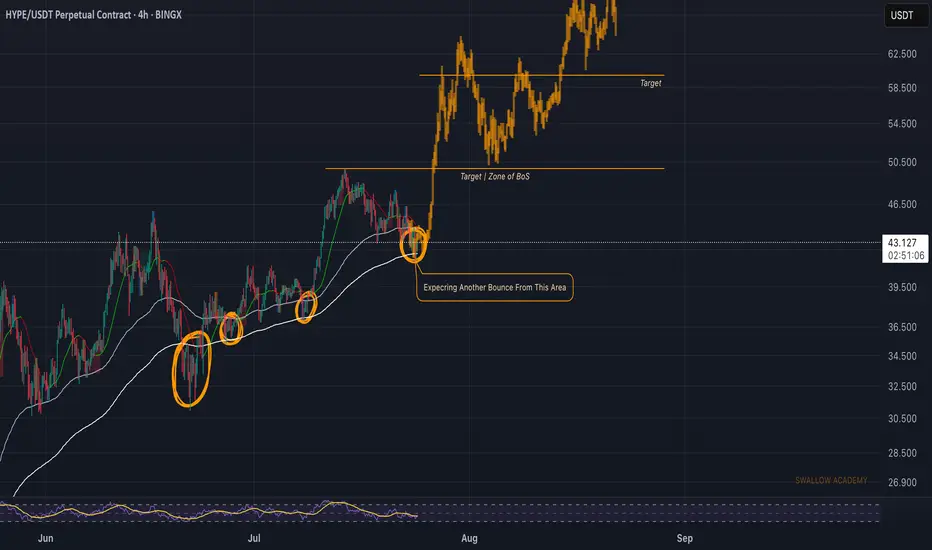
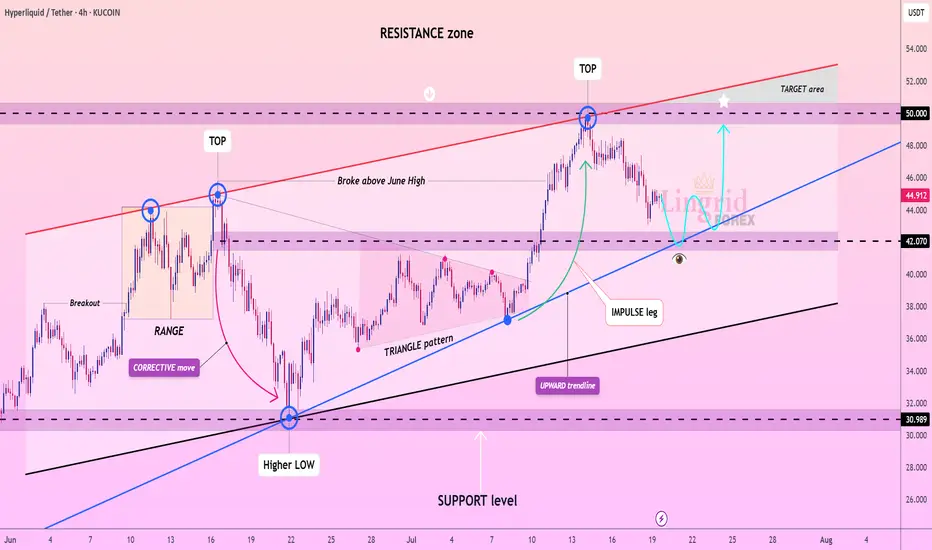
Lingrid | HYPEUSDT potential Rebound from the Support ZoneThe price perfectly fulfilled my last idea . KUCOIN:HYPEUSDT recently surged above the triangle pattern and tested the key resistance near 50, forming a local top. After a healthy retracement, price is now approaching the blue upward trendline and support zone near 42, setting the stage for another bullish bounce. The structure reveals a higher low and a strong impulse leg, suggesting continuation toward the upper resistance area. The chart favors bullish continuation after retest confirmation of the ascending support.
📉 Key Levels
Buy trigger: Bounce from 42.5–43.5 zone
Buy zone: 42.0–43.0
Target: 50.0 with potential to 52.0
Invalidation: Breakdown below 40.0
💡 Risks
Failure to hold trendline support
False breakout rejection below 42.0
Broader market sentiment turning risk-off
If this idea resonates with you or you have your own opinion, traders, hit the comments. I’m excited to read your thoughts!
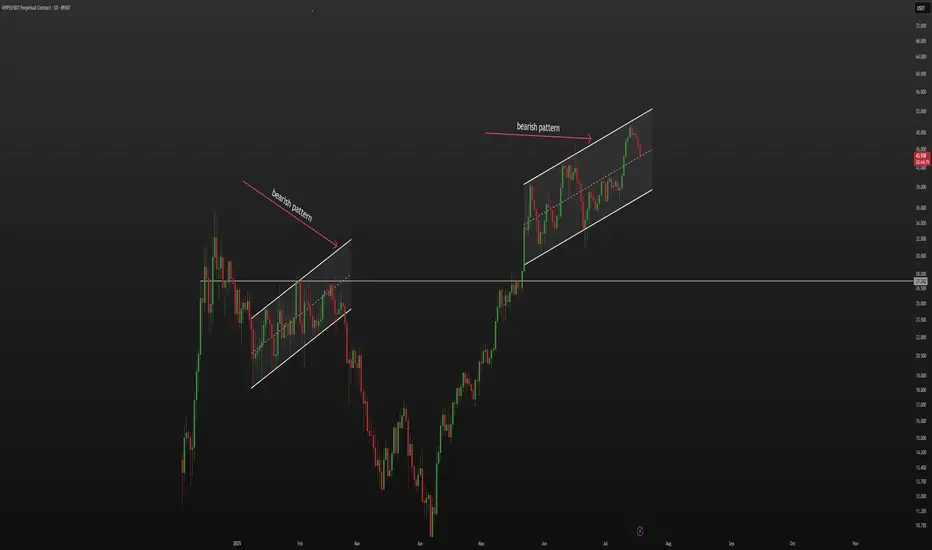
HYPE - bearish pattern (25-27$ soon...)🔻 Currently in a bearish pattern.
I'm expecting a drop to the $25–27 range. Opened a short position, with a stop above the all-time high (ATH).
$HYPE LONG- strong price action.
- possible continuation to break ATH
- atmosphere crypto is on the green line
- Good community coin
- The strongest coins in this leg up so far
HYPE LONG TRADEPlaying inside this range on Hype, Entered for a long position off the bottom of the channel.