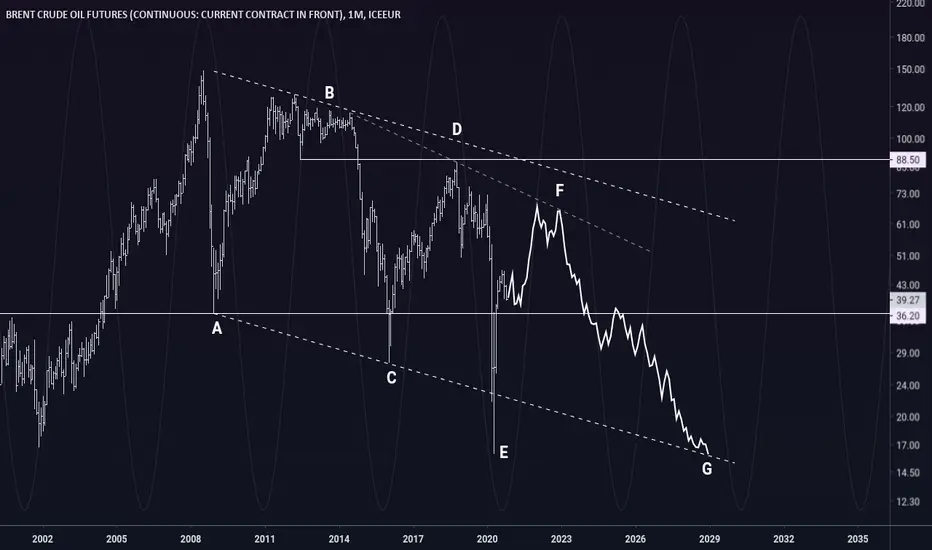
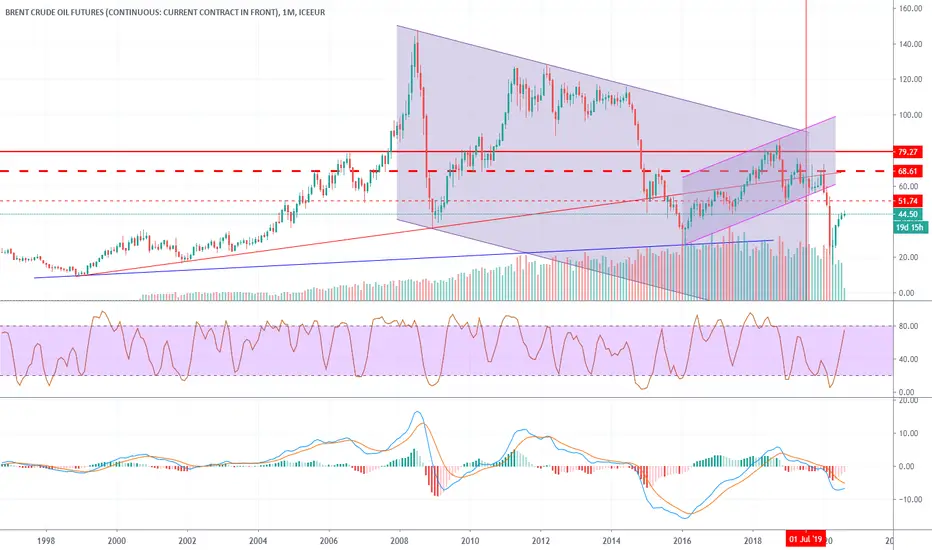
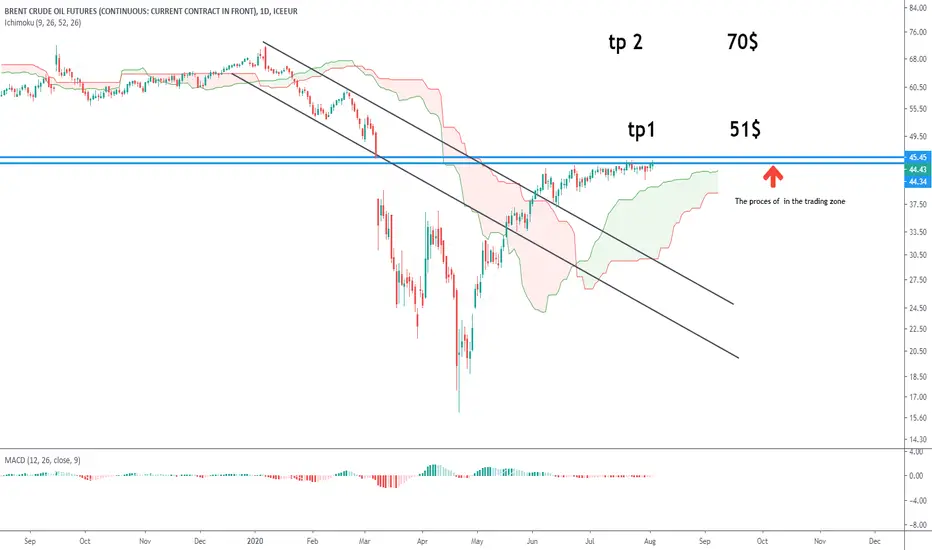
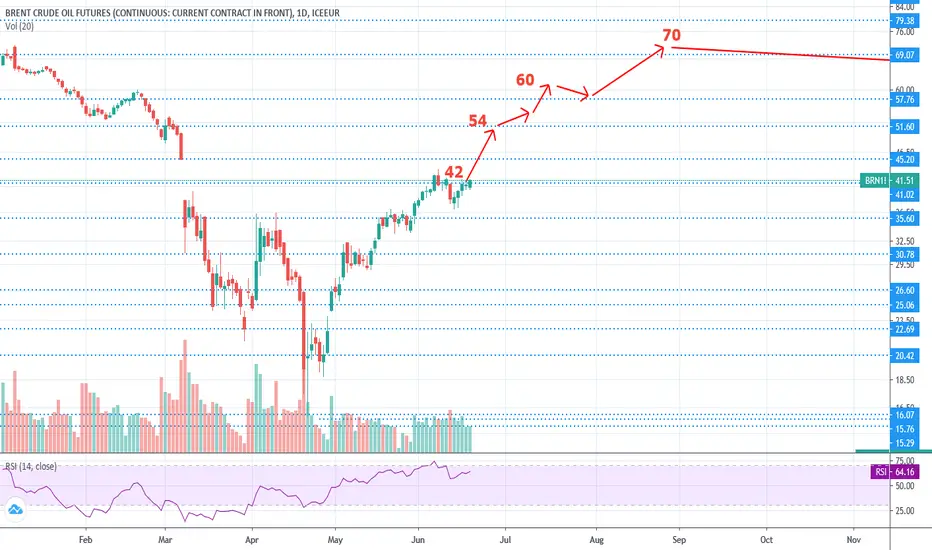
OIL, Long-term Diametric formation...Previous drop was devastating, but based on a remarkable Diametric pattern, the correction phase for OIL may not be over yet.
If this pattern holds true something similar to drawn projection should happen.
On the other hand we have 36 level as an obvious PA support (next one is 26). It is still untested after the break and we can expect OIL to be supported at nearby levels.
If 36 holds as expected we should see approximately $70 dollars per barrel for OIL in coming years.
Afterward if price follows Diametric pattern, the price should be rejected somewhere around the top of bearish channel to test the lows.
An early breakout of bearish channel (if happens) AND 88 level is NOT expected with current fundamentals; if even happens, it can't be considered an end for Diametric (there will be still a different g-wave), but of course it will indicate the strength of the market.
BRN1! trade ideas
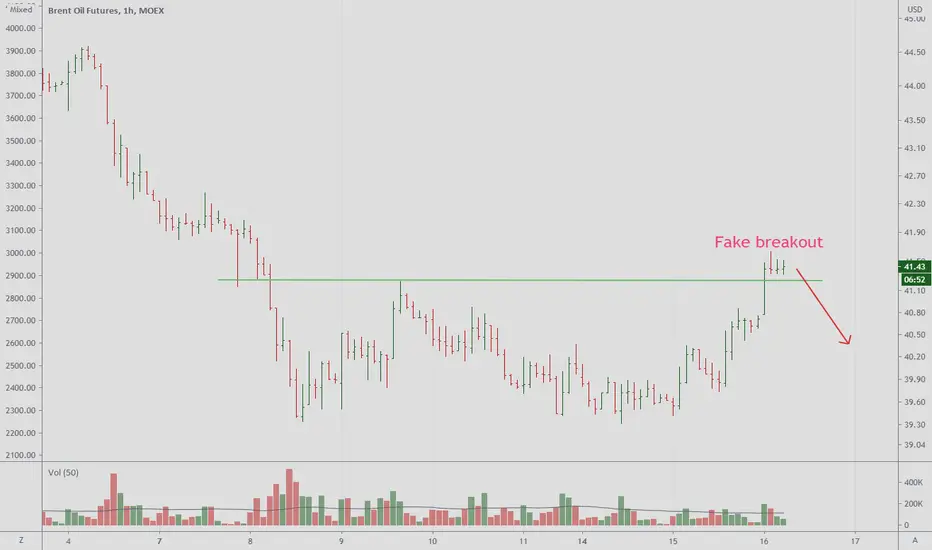
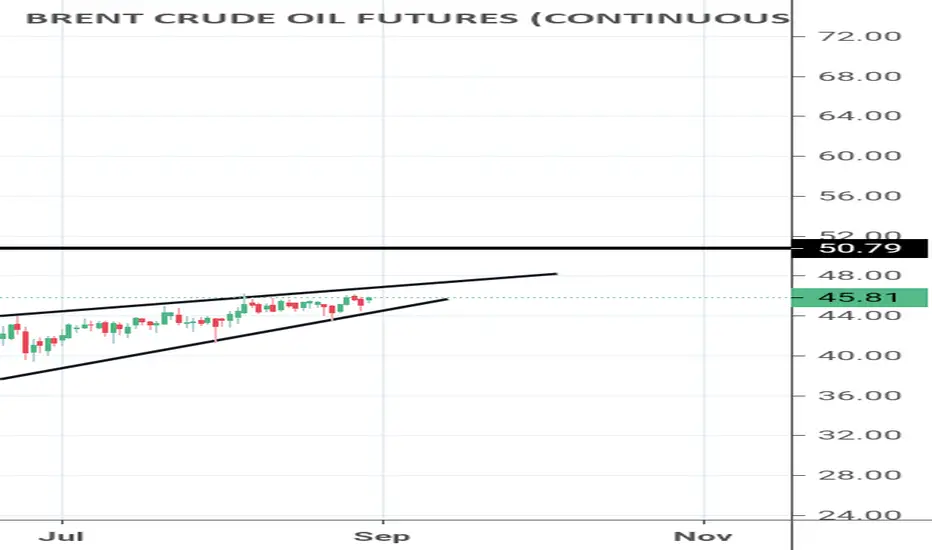
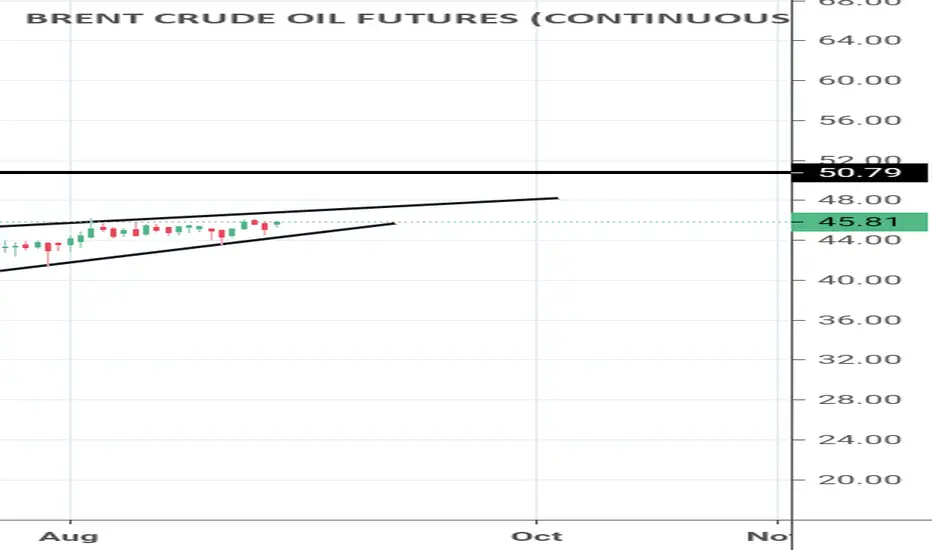
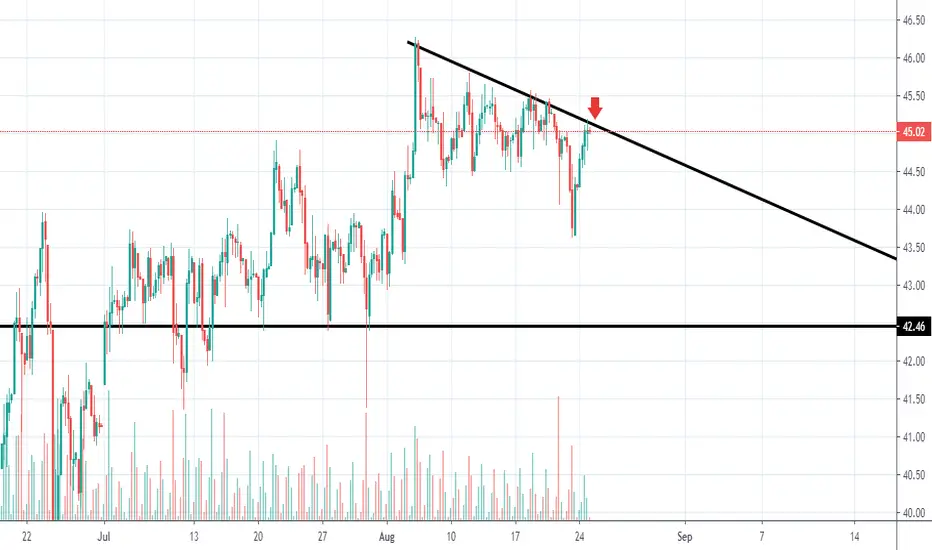
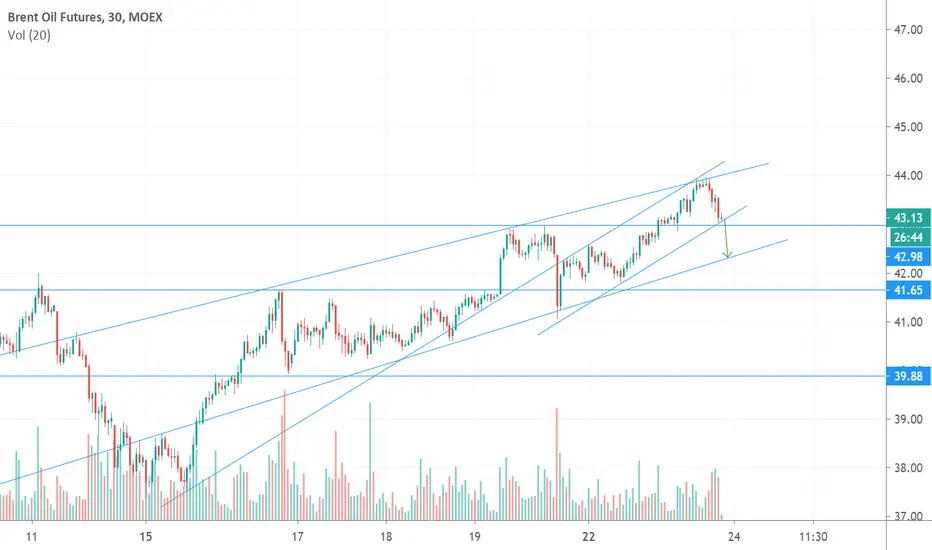
It looks like a Fake breakout is forming.Price lost its impulse after breakout above green line.
Huge decline on background comes into play.
Shorts are more preferable.
Oil complex - something is rottenOn daily charts, I can see any number of head and shoulder formations incudling on the ETFs
The monthly WTIC chart is looking like.... the last gasps of a dying industry? Is that possible?
I can see how commodities in general will rally in the medium term. The oil chart however says this is a secular decline....
I am short the oil sector till I will no longer be...
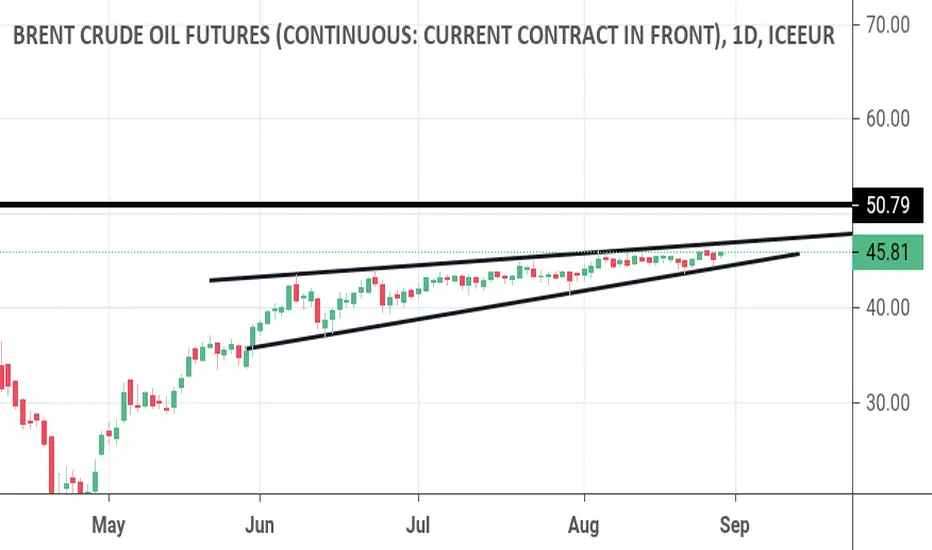
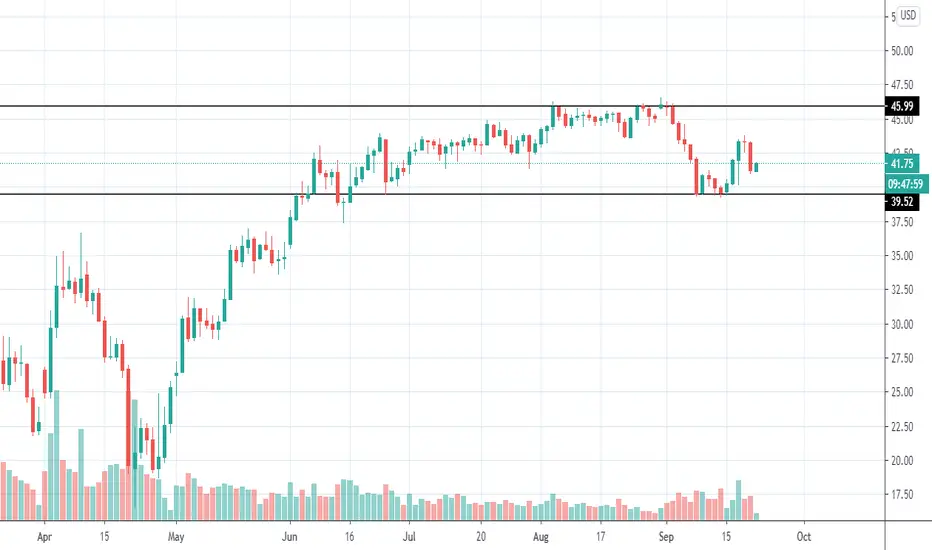
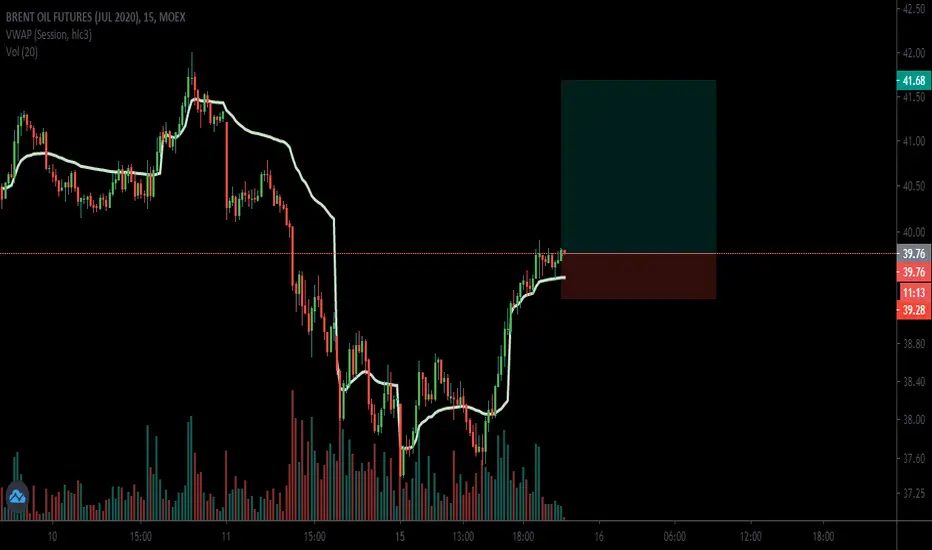
Assending triangleMarket seems to have broken key level @43.57 confirming buy entry to @48.23. remember everything is a probability. One is never wrong. If market drops past @42.09 then only will i consider selling. Market structure. always think either/or

Is Energy Sector ready to move ? XLE (US Energy Sectors) increase 3.19% second best to Finance Sector (XLF +3.44%)
XLE chart appear to be at support. Last friday rally is the best since 9 June sell-off.
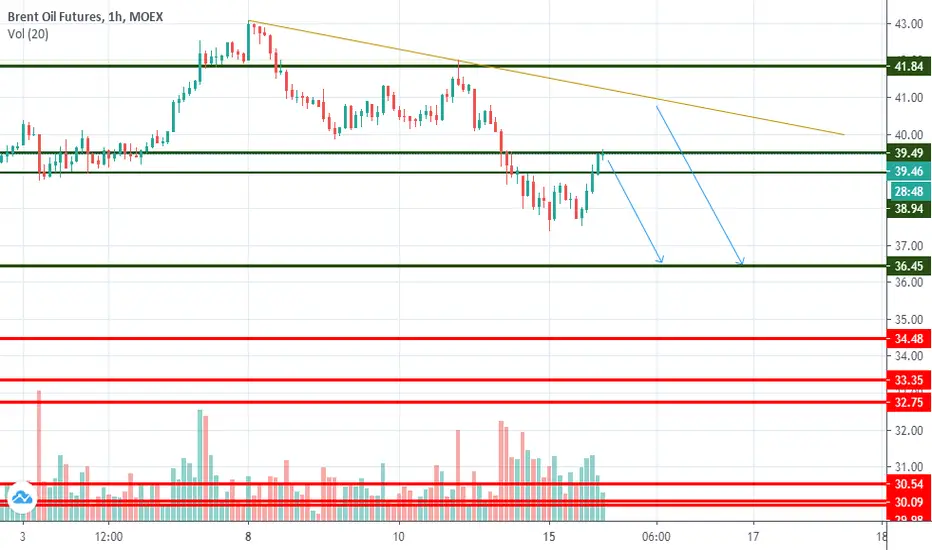
BRENT retesting Resistance numerous time.
Is O&G related stock ready to move ?
Stock to watch SerbaDK, Dialog, Hibiscus ?

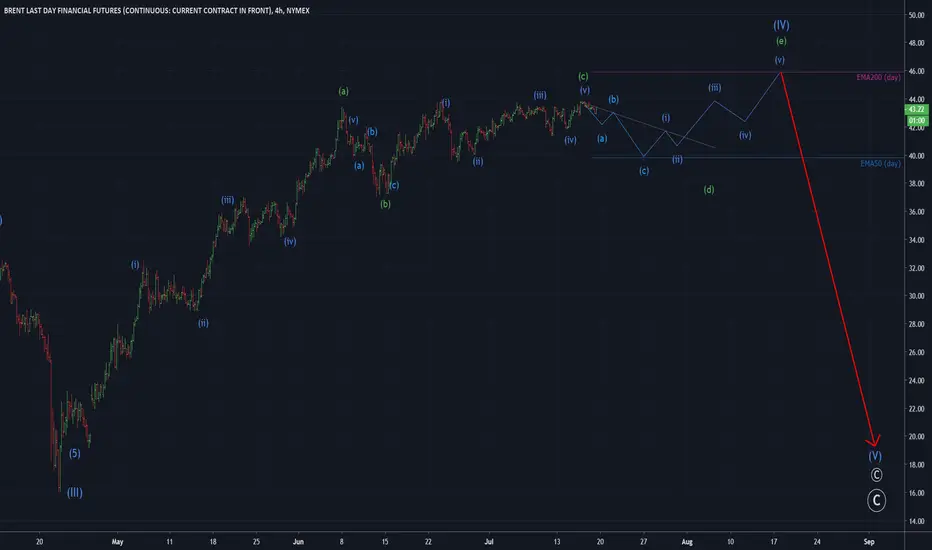
BZ1! (CL1!)SHORT: Target is 40$ (BZ1!)
However:
The current wave (IV) is the next-to-last wave in general downtrend/correction since July 2008 (on monthly timeframe). Upon completion of last (I)-(V) out of last {C} the trend will change and the targets will be (80$ and then 140$)
Here it means that either (IV) or the last wave (V) will be complicated.
In other words:
If (IV) is complicated (e.g. double zig-zag) than (V) is simple
If (IV) is simple (zig-zag) than (V) is complicated (e.g. ending diagonal)
As to the current technical situation I do not see any sentiment to drop the price below EMA50 (day) and complicate wave (IV). To the contrary the price tends to 50$ (EMA200 day) and only after the price will look down to 20-s$.


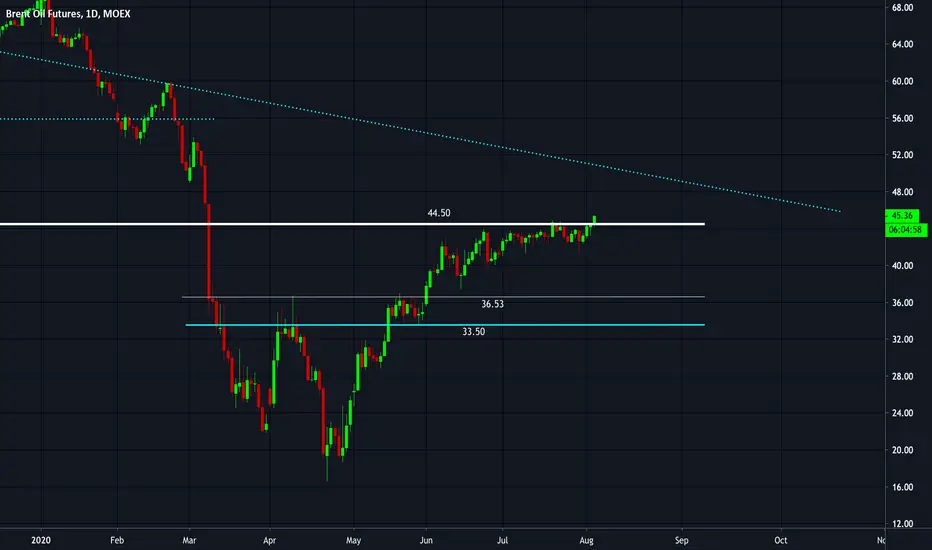
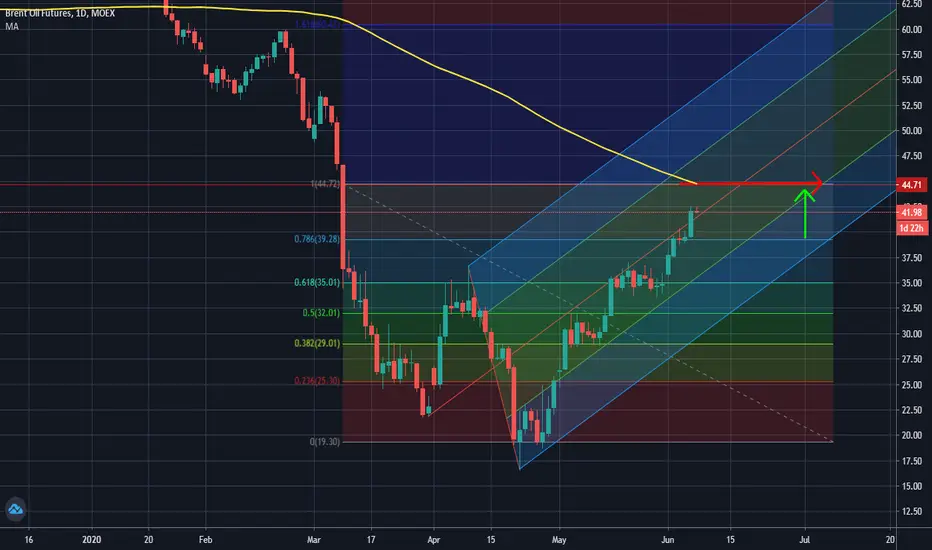
#Brent - Very close to TPBrent is very close to the $44.50 TP after breaking resistance to the upside.

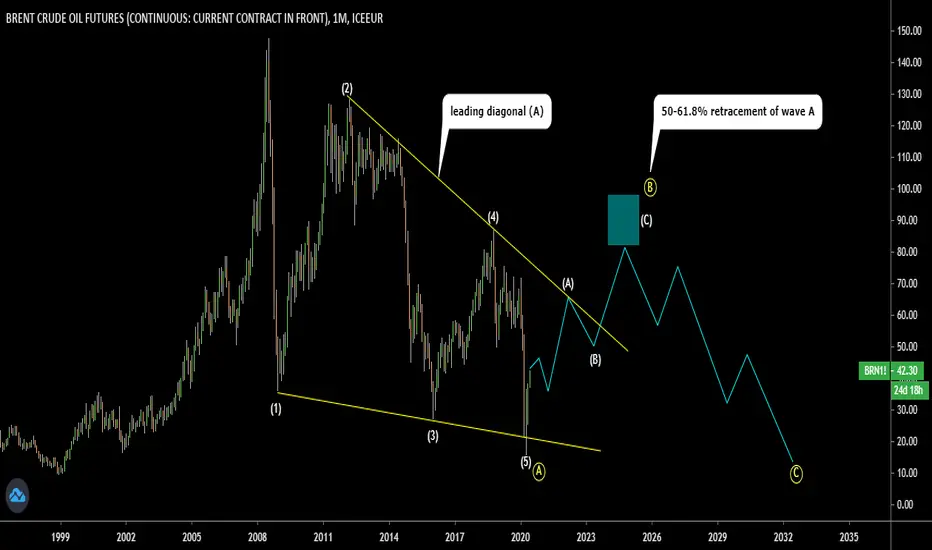
Brent Crude Futures - Big Map on MonthlyWe can hit between 80-100 in wave B to retrace 50-61.8% of wave (A),
then down to tag the wave (A) termination point.