US30 trade ideas
US30 (Dow Jones) Analysis – June 2025 Outlook📊 US30 (Dow Jones) Analysis – June 2025 Outlook
🔍 1. Fundamental Analysis
The US30 (Dow Jones Industrial Average) is currently navigating a complex environment shaped by macroeconomic shifts and geopolitical tensions. Below is an in-depth review of current factors influencing its price action:
🏦 Monetary Policy & Economic Indicators
Federal Reserve Stance:
After a series of rate hikes between 2022 and 2024, the Fed has adopted a more dovish tone in 2025.
Market consensus now expects the Fed to cut rates by Q3–Q4 2025 as inflation cools and growth moderates.
Inflation:
The May 2025 CPI came in lower than expected at 2.7% YoY, signaling disinflation.
Core CPI and PCE data also reflect a slowing pace of price increases, strengthening the case for easing.
Labor Market:
Non-farm payrolls have stabilized, but wage growth is slowing.
Unemployment remains low at 3.8%, but job creation is skewed toward lower-paying service sectors.
Growth Metrics:
ISM Manufacturing PMI remains below 50 (contraction), but Services PMI is resilient.
Consumer confidence dipped recently, reflecting uncertainty, yet consumer spending remains robust.
🌍 Geopolitical Climate
Iran–Israel Conflict Escalation (Mid 2025):
The recent Iran-Israel military clashes have rattled markets, briefly triggering risk-off flows.
The conflict has led to spikes in crude oil prices, pushing energy stocks higher but raising concerns about inflation re-acceleration.
US–China Relations:
Ongoing trade tensions over semiconductors and AI have led to sanctions on key Chinese tech firms.
Despite this, tech-heavy indices remain resilient due to domestic demand and AI sector optimism.
Global Monetary Policy Divergence:
While the Fed is dovish, the ECB has already started cutting rates, boosting global liquidity.
This divergence supports capital inflows into US equities, especially defensive and industrial sectors represented in the Dow.
📉 2. Technical Analysis (Smart Money Concepts)
The daily chart of US30, as annotated, reflects a clear transition from a bearish structure to a bullish regime, validated by Smart Money Concepts (SMC) methodology:
🔄 Market Structure Shift
Bearish Trend: Price was forming Lower Highs (LH) and Lower Lows (LL) into early 2025.
Change of Character (ChoCH): A significant bullish shift occurred with a closure above 42842, invalidating the prior LH and suggesting institutional buying.
Break of Structure (BOS): Followed by a clean higher high, reinforcing the bullish momentum.
🧱 Key SMC Levels & Zones
Buy Zone (Demand):
Between 41,600 and 41,800, this region aligns with:
A previous Higher Low (HL)
A visible Fair Value Gap (FVG)/Imbalance
Psychological support zone
Expected to be a strong institutional demand zone for a long setup.
IDM (Intermediate Demand Mitigation):
Minor liquidity grab possible before retest of buy zone.
An early sign of bullish intent may appear here.
Bearish Invalidation Level:
41,179 is the key structural level.
A daily closure below 41,179 would invalidate bullish bias and trigger a bearish BOS.
📈 Trend & Liquidity Outlook
Liquidity Pools:
Sell-side liquidity rests below recent HLs, particularly near IDM and the Buy Zone.
Buy-side liquidity above recent HH (~43,800) is the next target if price rebounds.
Trendline Support:
Ascending trendline from April continues to hold.
Acts as dynamic support intersecting the Buy Zone in late June.
Targets:
TP1: 43,000 (recent swing high)
TP2: 43,800–44,000 (liquidity magnet zone)
Final Supply Zone: 45,078 (historical resistance, visible on chart)
📌 Scenario Planning (SMC-Based)
Primary (Bullish) Scenario:
Price retraces into Buy Zone (41,600–41,800).
Forms bullish engulfing or displacement candle.
Entry long → Target 43,800+, SL below 41,179.
Alternate (Bearish) Scenario:
Price closes below 41,179 (breaks structure).
Bias flips to bearish.
Next support zone lies around 40,300–40,500.
NOTE: ONLY FOR EDUCATIONAL NOT A FINANCIAL ADVICE

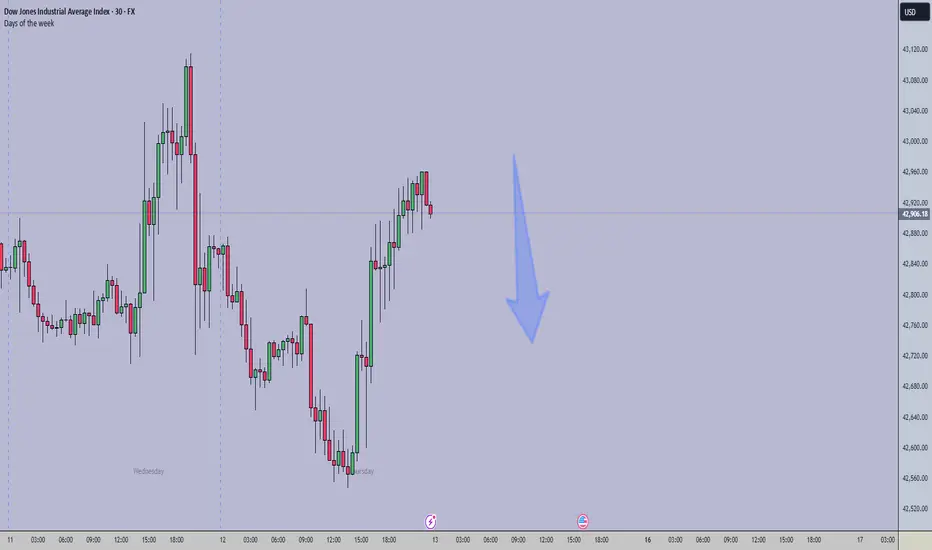
DOW Might Recover From Today's LossesIsrael's attack on Iran's nuclear facilities has unsettled the markets. After a weak start, the indices, such as the DJIA, initially made little headway and were unable to recover their losses.
We do not expect the markets to plunge to their doom now, but to recover soon.
For the Dow, we initially expect new lows in the entry area shown and then a recovery to the target zone in the coming week.

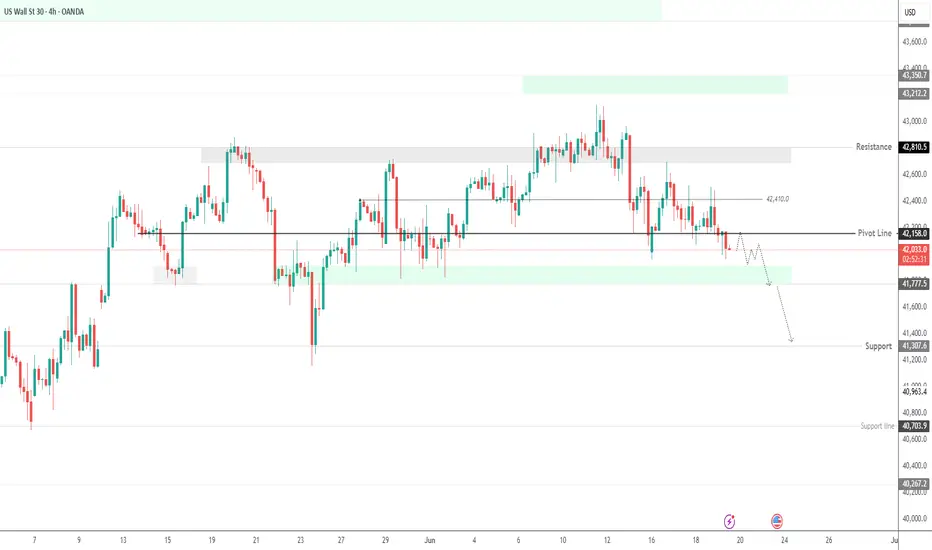
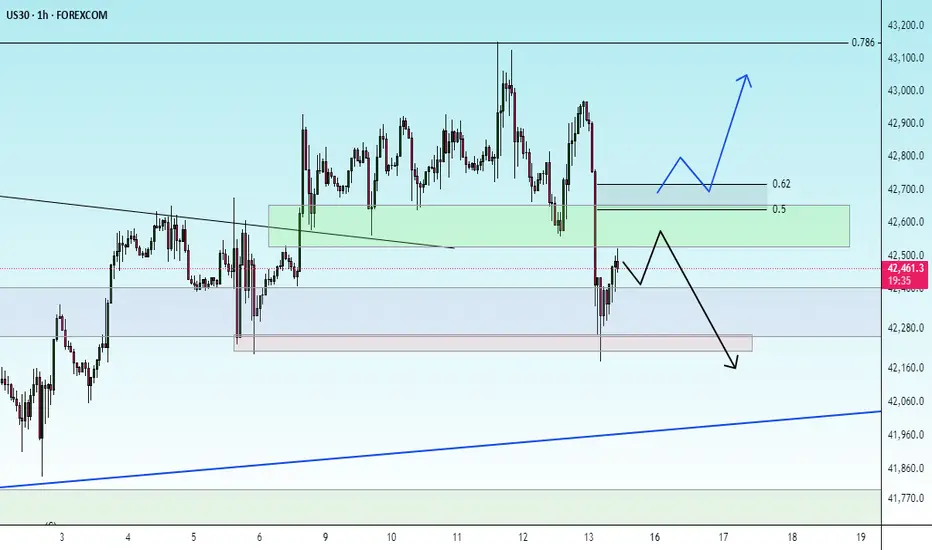
US30 Stabilizes Above Key Support Amid Geopolitical TensionsUS30 – Overview
The price reacted modestly to ongoing Middle East tensions, reaching our previously mentioned pivot zone at 42160, then reversed and stabilized within the bullish territory.
Technical Outlook:
As long as the price holds above 42160, bullish momentum is expected to continue toward 42410.
A 1H close above 42410 would confirm further upside toward 42610 and 42810.
🔻 To shift into a bearish trend, the price must close below 42160 on the 1H or 4H timeframe, which could lead to a move down to 41780.
Key Levels:
• Pivot: 42310
• Resistance: 42410 / 42610 / 42810
• Support: 42160 / 41970 / 41780

DOW30/US30 - ACTIVE TRADE - PROFITABLE SET UP TRADETeam,
today I have provide LIVE trading today provide you i did a good trade for
NAS100, DOW30 AND DAX30 - in real LIVE trading
OK, I prefer to SET UP my limit order today only. Remember, the market will be very volatile in the next 4 hours.
I expect the RATE should cut 25 points at least. Why
the employment data come out remain the same
inflation last week look under control
Retails is poorly come out today
The FED does not care about the America, they just care about taking advantage of America.
Lets now focus on the SETTING BUY LIMIT ORDER
I order small volume at 41975-42075
However I will double up at LIMIT BUY ORDER
The 1st target are looking at 4227542300
Target 2 - 42575-42675
REMEMBER - IF IT DOES NOT HIT YOUR ENTRY, JUST WALK AWAY.
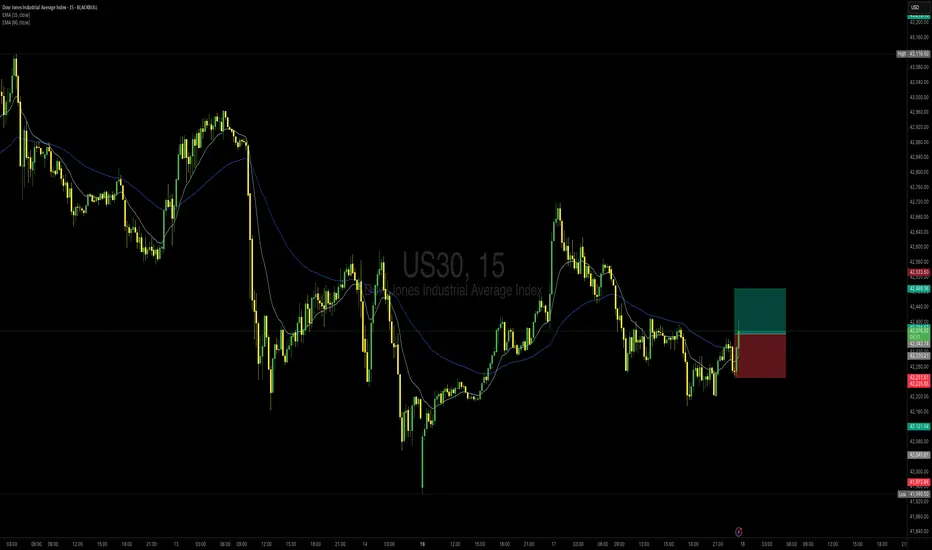
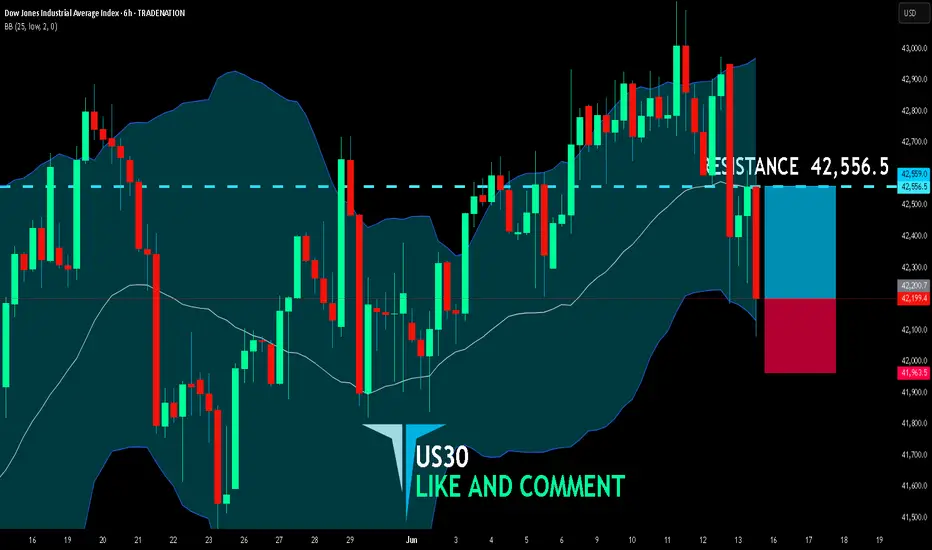
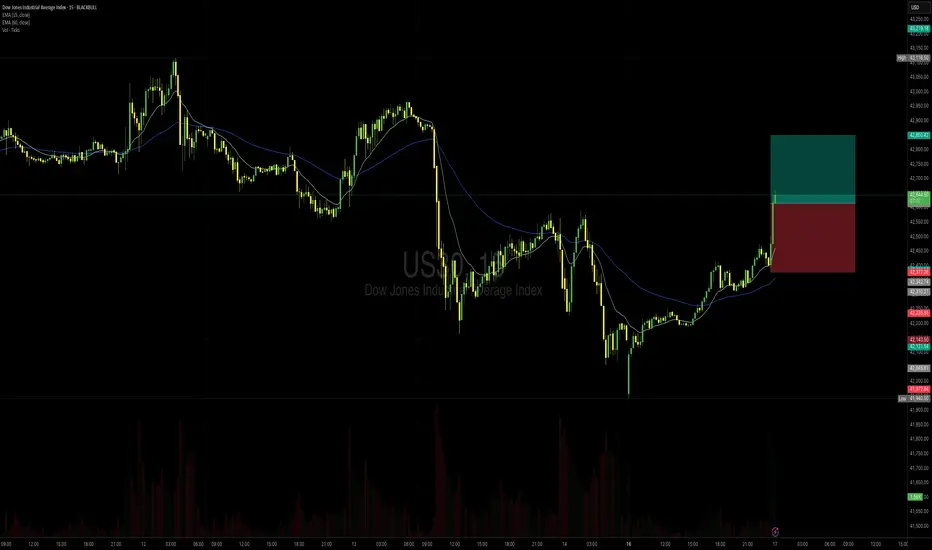
US30 BULLISH BIAS RIGHT NOW| LONG
US30 SIGNAL
Trade Direction: short
Entry Level: 42,200.7
Target Level: 42,556.5
Stop Loss: 41,963.5
RISK PROFILE
Risk level: medium
Suggested risk: 1%
Timeframe: 6h
Disclosure: I am part of Trade Nation's Influencer program and receive a monthly fee for using their TradingView charts in my analysis.
✅LIKE AND COMMENT MY IDEAS✅
US30 Breaks Key Support as Geopolitical Risk Weighs on SentimentUS30 – Technical Overview
Amid rising Middle East tensions, the indices market remains under bearish pressure, with risk-off sentiment dominating.
US30 dropped to the 42160 level, as previously forecasted, and has now broken below it.
As long as the price trades below 42160, the bearish trend is expected to continue toward 41780, and potentially 41310 if that level fails to hold.
Key Levels:
• Pivot: 42160
• Support: 41900 / 41780 / 41310
• Resistance: 42310 / 42410 / 42580
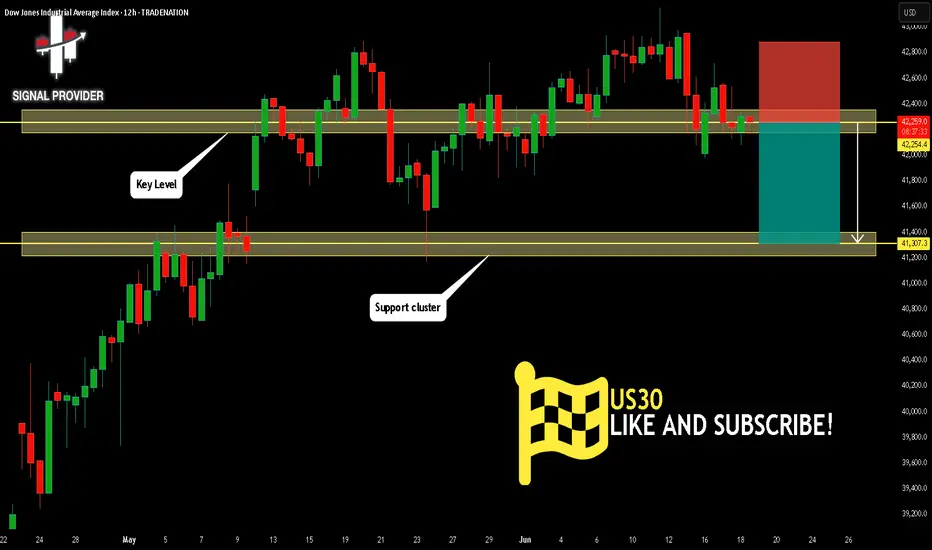
US30 Is Bearish! Sell!
Here is our detailed technical review for US30.
Time Frame: 12h
Current Trend: Bearish
Sentiment: Overbought (based on 7-period RSI)
Forecast: Bearish
The market is approaching a significant resistance area 42,254.4.
Due to the fact that we see a positive bearish reaction from the underlined area, I strongly believe that sellers will manage to push the price all the way down to 41,307.3 level.
P.S
Overbought describes a period of time where there has been a significant and consistent upward move in price over a period of time without much pullback.
Disclosure: I am part of Trade Nation's Influencer program and receive a monthly fee for using their TradingView charts in my analysis.
Like and subscribe and comment my ideas if you enjoy them!
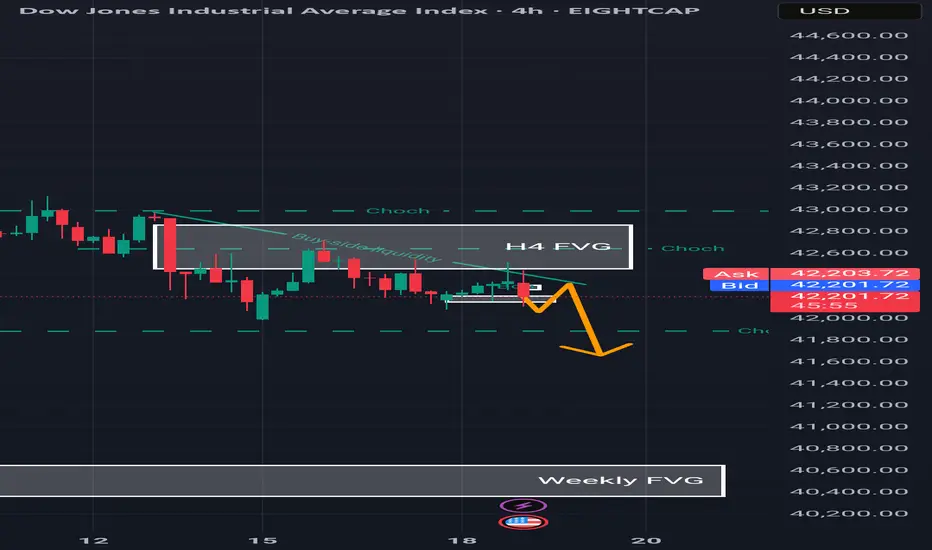
US30 – Bearish Bias Amid Escalating Middle East TensionsUS30 – Bearish Bias Amid Escalating Middle East Tensions
U.S. indices, particularly the Dow Jones (US30), are under sustained bearish pressure due to intensifying geopolitical tensions between Israel and Iran. With no signs of de-escalation or negotiation, market sentiment remains risk-off.
Technical Outlook:
As long as the crisis continues, US30 is likely to maintain its downward momentum. The price appears set to test the 41770 level, with potential continuation toward 41310.
Only a clear signal of de-escalation or diplomatic engagement may reverse this trend, possibly triggering a recovery toward 42810.
For now, the directional bias remains bearish.
Key Levels:
• Pivot: 42160
• Support: 41770, 41310, 40700
• Resistance: 42410, 42810, 43210
Click to see the Previous idea

Us30 sellThe EMAs provide insight into the overall trend direction. Currently, the US30 is trading above the shorter-term EMAs, indicating a bullish sentiment in the market. The Relative Strength Index (RSI) is currently showing divergence on the daily time frame.
US30 TodayUS30 Today is still bearish
My SSM Reversal Pattern is comming.
This is just my view of course
Quick take US indices and the Fed's interest rate decisionQuick look at what can we expect from the Fed's rate decision and press conference on Wednesday.
TVC:DJI
TVC:SPX
TVC:NDQ
Let us know what you think in the comments below.
Thank you.
77.3% of retail investor accounts lose money when trading CFDs with this provider. You should consider whether you understand how CFDs work and whether you can afford to take the high risk of losing your money. Past performance is not necessarily indicative of future results. The value of investments may fall as well as rise and the investor may not get back the amount initially invested. This content is not intended for nor applicable to residents of the UK. Cryptocurrency CFDs and spread bets are restricted in the UK for all retail clients.

possibility of correctionAs long as the indicator below the green resistance range fluctuates, the continuation of the correction trend will be likely. With the consolidation above the resistance range, the continuation of the upward trend will be likely.
US30 Potential Rebound from Key Support Zone
US30 Potential Rebound from Key Support Zone 🚀📊
📉 Analysis Overview:
The US30 (Dow Jones Index) is currently testing a major support zone near the 41,800–41,900 range, a level that has held firm multiple times in the past (highlighted with green arrows and orange circles). This area has acted as a demand zone, leading to strong bullish reactions previously.
🔍 Key Technical Highlights:
🔸 Support Zone: Clearly respected at ~41,800. Price is once again bouncing here.
🔸 Resistance Zone: Around 43,250–43,500. This area has acted as a ceiling, where price struggled to break through.
🟢 Reversal Indicators: Multiple successful defenses of the support zone suggest accumulation and possible bullish reversal.
📈 Target Projection: If support holds, the price may rally toward the target zone near 43,496.4, as shown by the purple arrow.
📌 Conclusion:
As long as the 41,800 support holds, US30 shows bullish potential toward the 43,500 resistance. A break below this zone would invalidate the bullish scenario and shift focus back to the lower support near 41,250.
🛑 Risk Management Tip: Watch for confirmation candles and volume before entering long positions. Always set a stop-loss below the support zone.

Buy for R/R1Buy or Buy Limit @ 42615
SL: 42377
TP1: 42850
Signal from a backtested strategy with a win rate of 60 %.
Manage your risk...
US30(Dow Jones)The combination of the COT data showing a shift towards more short positions and the technical picture suggests that bearish momentum could continue. Sell/Short: Consider entering a short position at current market levels, ideally on any retracement or rally towards the resistance zone.
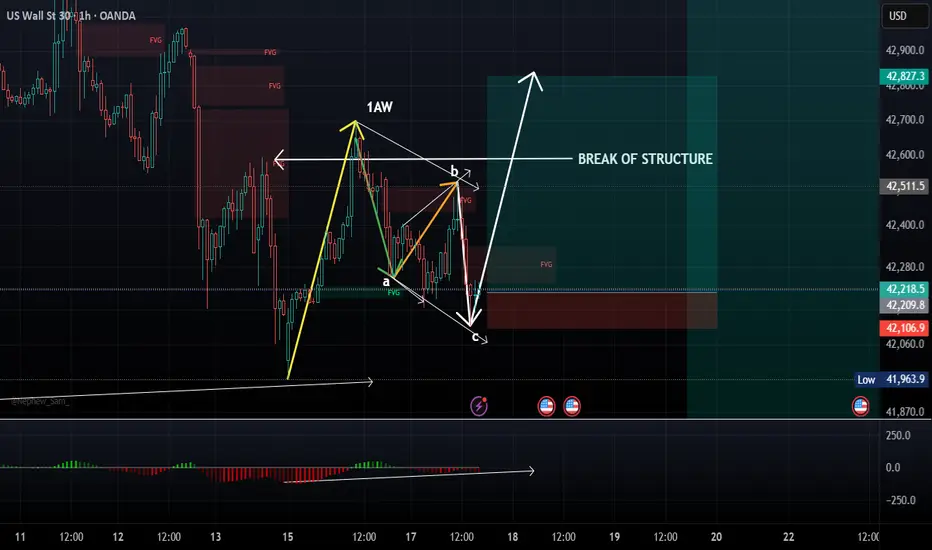
US30/DJ30 Long/buy 1:6Reason for buy:
VERY SIMILAR STRUCTURE TO GOLD!!!!!
1. Break of structure
2. Regular flat in play with a complete corrective structure (a,b,c)
3. NO MACD divergence shows strong moment upwards
4. Impulsive move (1AW) indicates a strong move upwards will continue
5. Liquidity at the top (TP area)
Entry: CMP (Current market price)
Stop loss :42086
Take Profit: At own discretion...OPEN!
Strategy/ies: Engulfing candle on 15/1HR TF
Losses are part of the game...don't be too hard on yourself!
Tuesday Outlook #us30Tuesday Outlook #US30. As we head into the Fed's Decision. Be careful trading today.
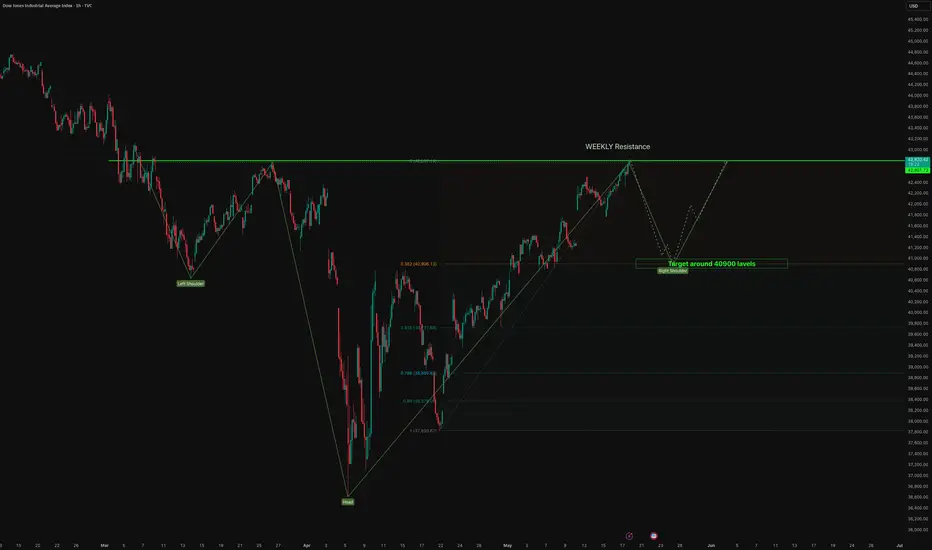
DOW - H&S is getting progressed. 📉 DOW JONES – Head & Shoulders Pattern Formation (Right Shoulder in Progress)
The chart illustrates a clear Head & Shoulders (H&S) pattern, a classic bearish reversal signal, forming on the higher timeframe.
🧠 Pattern Breakdown:
Left Shoulder: Formed in early March.
Head: Sharp dip and recovery formed during early April.
Right Shoulder: Currently in the making, aligning with a weekly resistance near 42,880 levels.
Price is expected to reject this resistance and complete the right shoulder.
📌 Technical View:
Strong rejection expected near the weekly horizontal resistance.
If the right shoulder completes and breaks below the neckline (around 41,500–41,600), it may trigger a measured fall.
Fibonacci levels also align, with the 0.382 and 0.5 retracement acting as potential reaction zones.
🎯 Target:
Target: 40,900 levels (Right Shoulder support zone).
This is a confluence zone where buyers may reappear.
Also forms a neckline test, critical for breakout confirmation or reversal.
🔔 Trade Setup Insight:
Short bias activated near 42,880 resistance zone.
Watch for confirmation via bearish engulfing candles or lower time frame breakdowns.
Targeting 40,900 initially. Further downside possible if neckline breaks decisively.
⚠️ Disclaimer:
This analysis is for educational purposes only and does not constitute investment advice or a recommendation. All trading involves risk. Please perform your own due diligence or consult a certified financial advisor before making trading decisions.
US30 next target releasedNo comment needed. All information is in the chart analysis.
Steps to follow:
Analyze yourself.
Take the position with SL and Take Profits.
Wait, it may take a couple of days, so take a break and step away from the screen from time to time, just like I do :)
Get the result.
I will update the trade every day.
Like, comment with your good mood or viewpoint, share with your circle. It’s together that we get stronger!
Good trades, Traders!
The golden bear
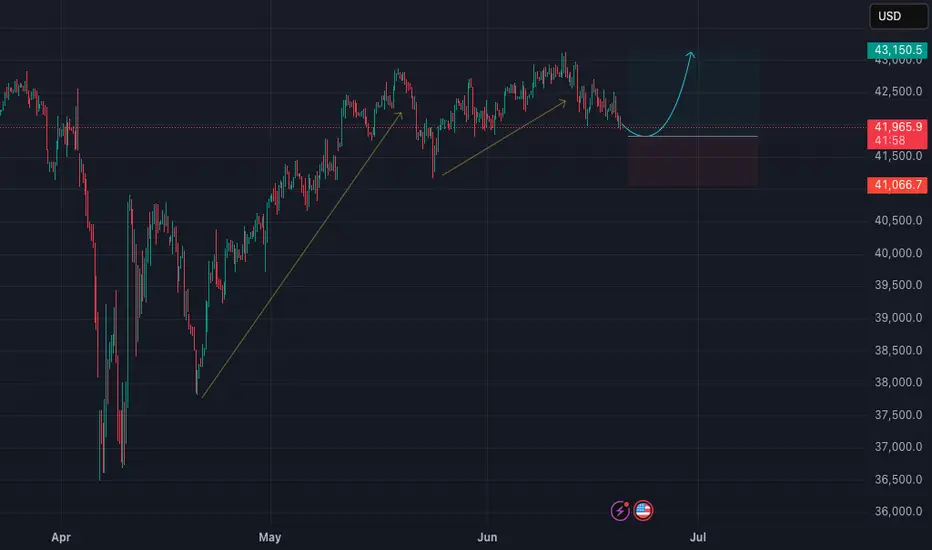
US30 Technical Analysis From that zone, I'm expecting US30 to keep flying. We should see a bit more push to the upside if price reacts to our zone.

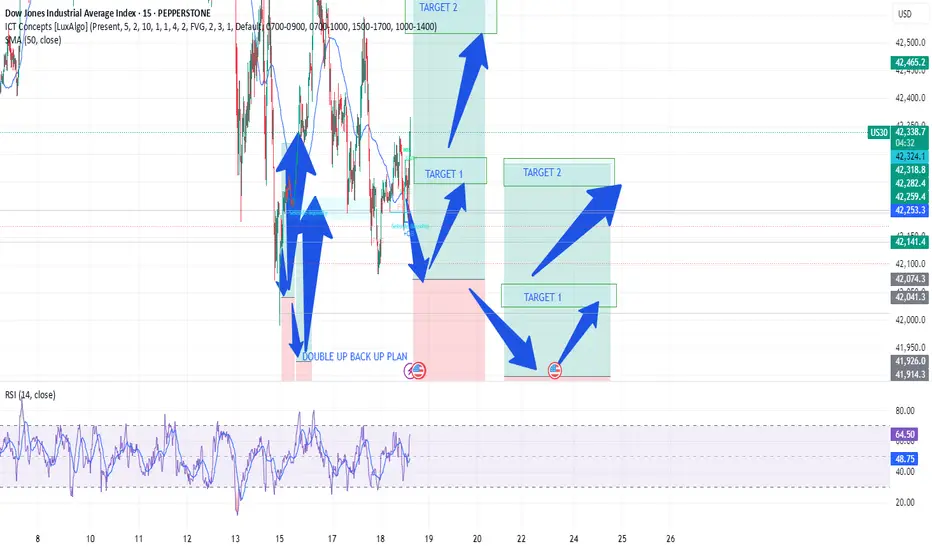
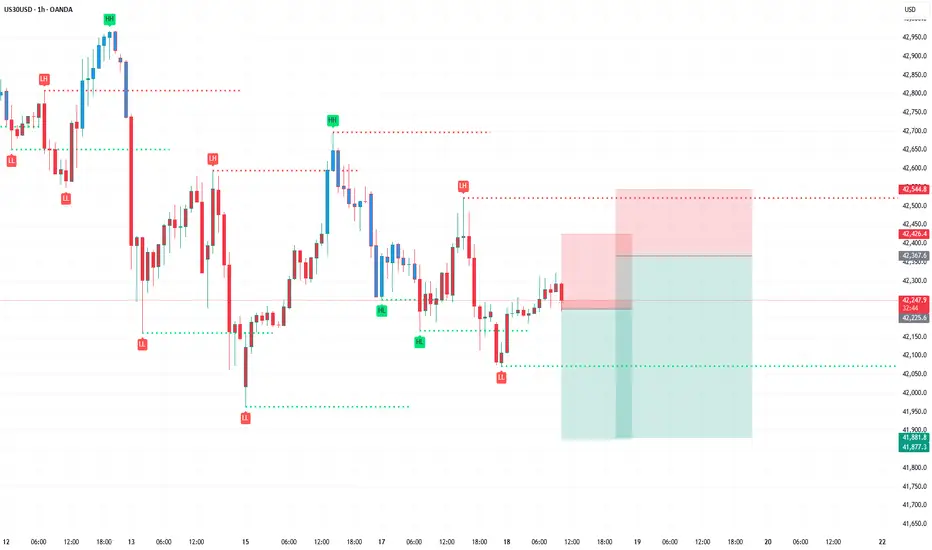
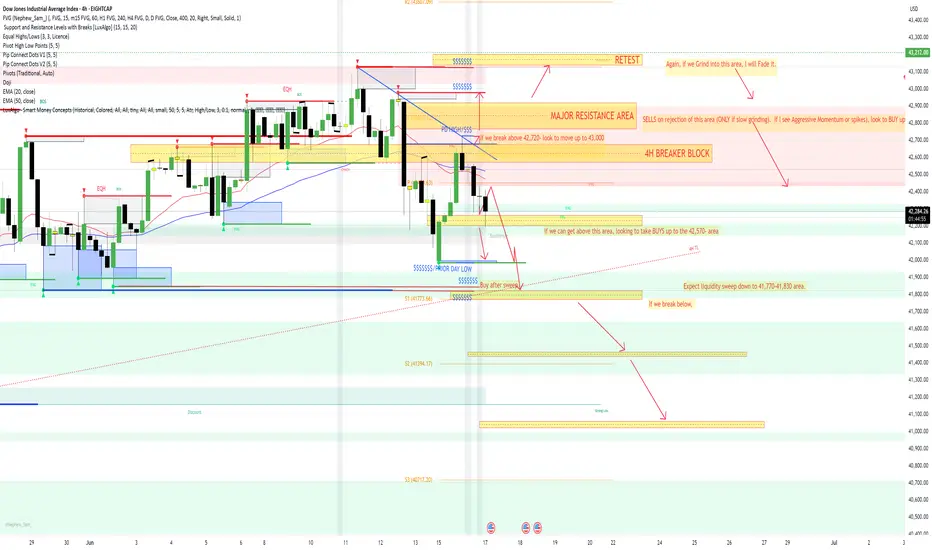
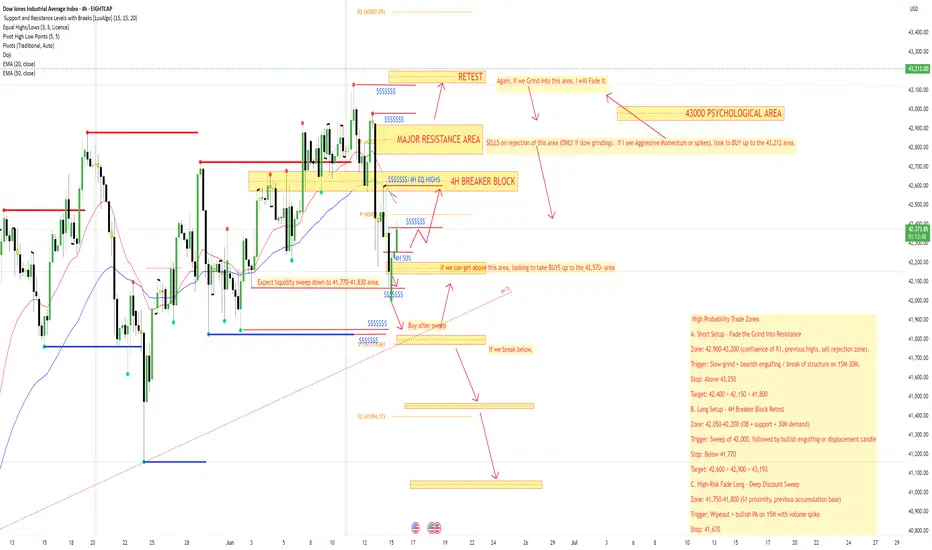
This weeks #US30 outlook. High Probability Trade Zones
A. Short Setup – Fade the Grind Into Resistance
Zone: 42,900–43,200 (confluence of R1, previous highs, sell rejection zone).
Trigger: Slow grind + bearish engulfing / break of structure on 15M–30M.
Stop: Above 43,250
Target: 42,400 > 42,150 > 41,800
B. Long Setup – 4H Breaker Block Retest
Zone: 42,050–42,200 (OB + support + 30M demand)
Trigger: Sweep of 42,000, followed by bullish engulfing or displacement candle
Stop: Below 41,770
Target: 42,600 > 42,900 > 43,193
C. High-Risk Fade Long – Deep Discount Sweep
Zone: 41,750–41,800 (S1 proximity, previous accumulation base)
Trigger: Wipeout + bullish PA on 15M with volume spike
Stop: 41,670
Target: 42,200 > 42,500
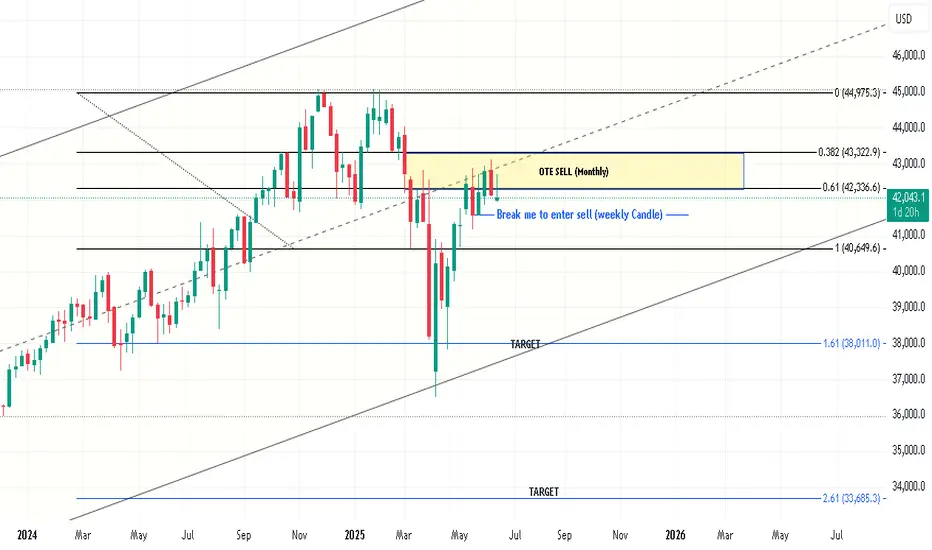
US 30 Idea Wait Weekly candle to be broken to enter long sell position ...if not broken then still making dramas in OTE areas