Us30Daily rejection to the downside h4 rejection and h1 rejection this might be a potential huge bearish reversal
US30 trade ideas
Double Top Pattern Signals Bearish Reversal (Short Trade ActiveThe Dow Jones Industrial Average Index (DJI) on the 4H chart has formed a Double Top pattern, indicating potential trend exhaustion and bearish reversal. The price was rejected near 42,900 twice and has now broken below the neckline, triggering a short trade setup.
🔹 Pattern: Double Top
🔹 Resistance Zone: 42,900 – 43,000
🔹 Neckline Break: ~42,450
🔹 Target Area: 40,878 based on pattern projection
🔹 Fundamental Context: Profit-taking and market uncertainty post recent highs
Bearish momentum active – trade remains valid unless price reclaims and holds above 42,950. Short setup is technically and structurally supported. 📉🧭
Note : If you found this helpful, like and follow for more trade ideas!
Share My Idea With Your Firends Mention Your Feed back Comment Section
This is not financial advice. Please conduct your own research and manage risk accordingly.

SELLING US30 ON RETEST OF PREVIOUS SUPPORTBasic trading. It is what it is. Trade what you see. Selling to previous low

US30 at NYSE created support.US30 at NYSE created support.
NYSE OPEN. Price creating support and waiting for confirmation (candle close) so I can buy for 400pips.
SHORT ON US30US30 Has given us a change of character to the downside with a nice retest creating a lower high.
I will be selling us30 to the next demand zone looking to catch 500-1000 points.
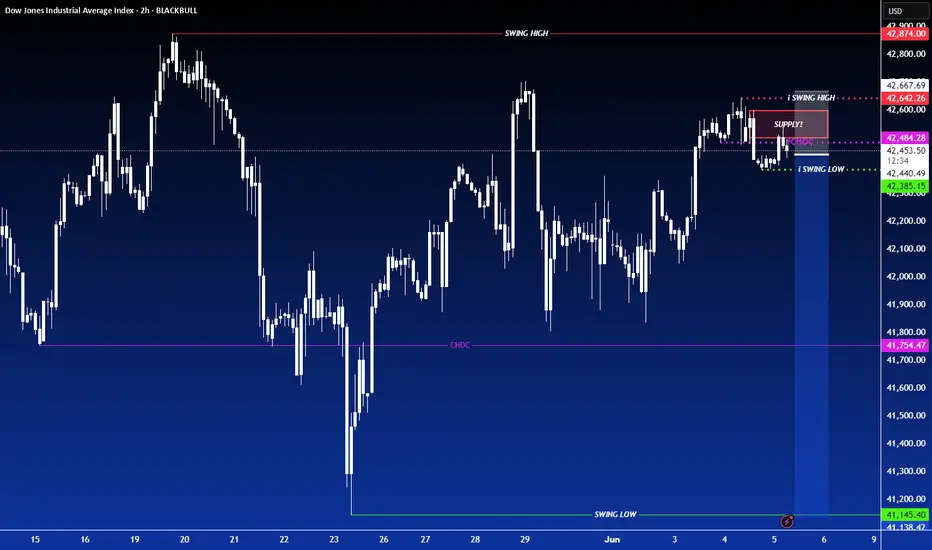
Major US30 sell setup 5 June 2025We chOch on H4 had a major pullback then shifted structure on the extreme supply

US30 Trade Update – 06/05/2025🚨 US30 Trade Update – 06/05/2025 🚨
📊 Market Structure & Key Levels
US30 continues to respect bullish structure, trading above the 42,400 zone and reclaiming strength after consolidating around key support levels. Buyers are holding control with price now at 42,480+.
🔍 Key Observations:
✅ Still holding above 41,947 structure zone
✅ Higher lows intact – bullish continuation likely
🔼 Resistance in focus: 42,700 → 42,900
🎯 Trade Plan:
🔹 Long Setup:
Buy on pullbacks to 42,300–42,400
→ Target: 42,700 – 42,900
🔻 Short Setup:
Only valid on break & close below 41,947
→ Target: 41,261 – 40,983
⚠️ Trend remains bullish – follow momentum but watch for exhaustion near resistance!


US30 I Bearish Reversal Based on the M30 chart, the price is rising toward our sell entry level at 42,481.32, a pullback resistance that aligns with the 38.2% Fib retracement.
Our take profit is set at 42,326.96, a pullback support that aligns closely with the 50% Fib retracement.
The stop loss is set at 42,646.90, a swing high resistance.
High Risk Investment Warning
Trading Forex/CFDs on margin carries a high level of risk and may not be suitable for all investors. Leverage can work against you.
Stratos Markets Limited (tradu.com ):
CFDs are complex instruments and come with a high risk of losing money rapidly due to leverage. 63% of retail investor accounts lose money when trading CFDs with this provider. You should consider whether you understand how CFDs work and whether you can afford to take the high risk of losing your money.
Stratos Europe Ltd (tradu.com ):
CFDs are complex instruments and come with a high risk of losing money rapidly due to leverage. 63% of retail investor accounts lose money when trading CFDs with this provider. You should consider whether you understand how CFDs work and whether you can afford to take the high risk of losing your money.
Stratos Global LLC (tradu.com ):
Losses can exceed deposits.
Please be advised that the information presented on TradingView is provided to Tradu (‘Company’, ‘we’) by a third-party provider (‘TFA Global Pte Ltd’). Please be reminded that you are solely responsible for the trading decisions on your account. There is a very high degree of risk involved in trading. Any information and/or content is intended entirely for research, educational and informational purposes only and does not constitute investment or consultation advice or investment strategy. The information is not tailored to the investment needs of any specific person and therefore does not involve a consideration of any of the investment objectives, financial situation or needs of any viewer that may receive it. Kindly also note that past performance is not a reliable indicator of future results. Actual results may differ materially from those anticipated in forward-looking or past performance statements. We assume no liability as to the accuracy or completeness of any of the information and/or content provided herein and the Company cannot be held responsible for any omission, mistake nor for any loss or damage including without limitation to any loss of profit which may arise from reliance on any information supplied by TFA Global Pte Ltd.
The speaker(s) is neither an employee, agent nor representative of Tradu and is therefore acting independently. The opinions given are their own, constitute general market commentary, and do not constitute the opinion or advice of Tradu or any form of personal or investment advice. Tradu neither endorses nor guarantees offerings of third-party speakers, nor is Tradu responsible for the content, veracity or opinions of third-party speakers, presenters or participants.

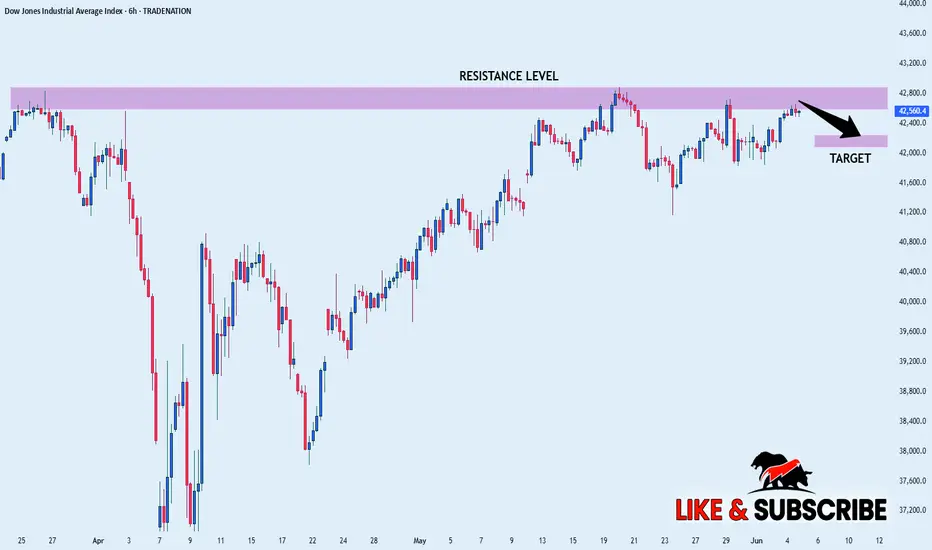
US30 WILL FALL|SHORT|
✅DOW JONES is going up now
But a strong resistance level is ahead at 42,800
Thus I am expecting a pullback
And a move down towards the target of 42,241
SHORT🔥
✅Like and subscribe to never miss a new idea!✅
Disclosure: I am part of Trade Nation's Influencer program and receive a monthly fee for using their TradingView charts in my analysis.
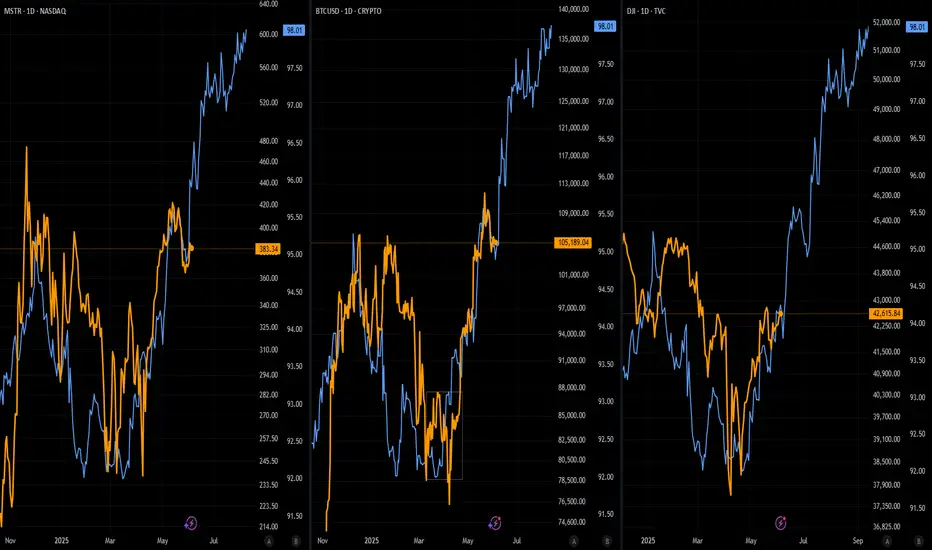
M2 FractalFriends... MSTR, BTC and DJI are all tracking M2 beautifully. Should this fractal continue to prove as reliable, we should see big moves in the coming weeks. Limit you exposure to leverage, it's just not worth it! Stay in MSTR stock and BTC spot.
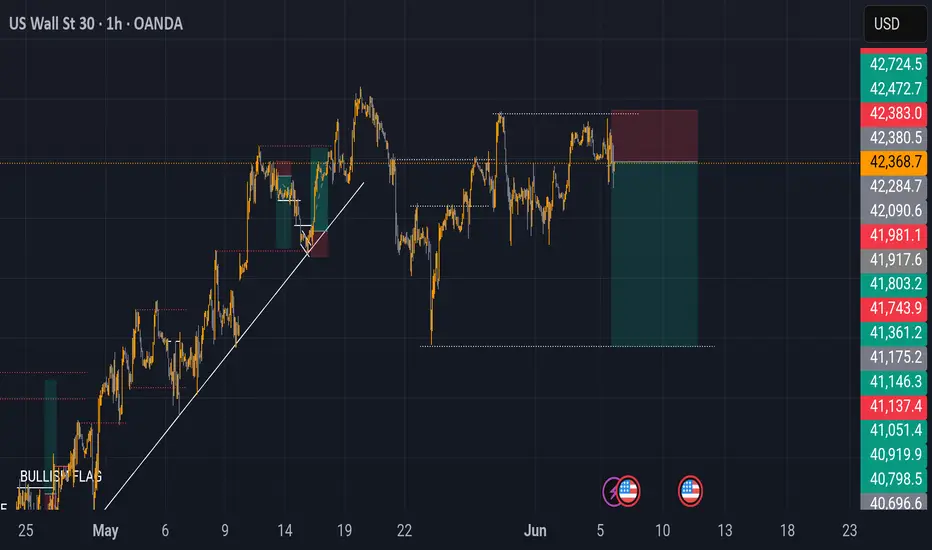
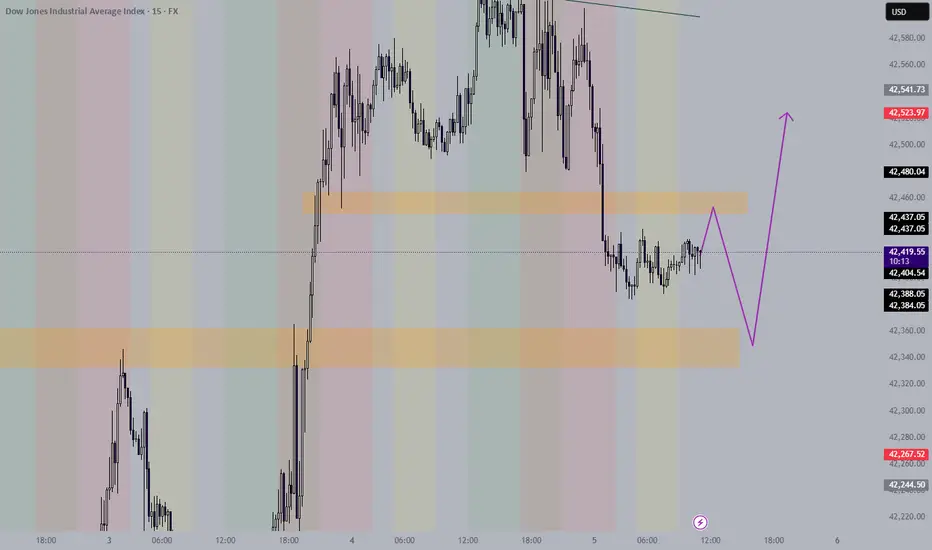
Market Heist in Progress! US30/DJI Long Trade – Ride or Escape?🔥 "The US30/DJI Heist: Bullish Loot & Escape Before the Trap!" 🔥
🌟 Hi! Hola! Ola! Bonjour! Hallo! Marhaba! 🌟
Dear Money Makers & Market Robbers, 🤑💰💸✈️
Based on the 🔥Thief Trading Style🔥 (technical + fundamental analysis), here’s our master plan to heist the US30/DJI (Dow Jones Industrial Average). Follow the strategy on the chart—long entry is the play! Aim to escape near the high-risk RED Zone (overbought, consolidation, potential reversal). The bears are lurking, so take profits and treat yourself—you’ve earned it! 💪🏆🎉
🚀Entry (The Vault is Open!)
"Swipe the bullish loot at any price!"
For precision, place buy limit orders within 15-30min timeframe (recent swing lows/highs).
Set alerts! Don’t miss the heist.
🛑 Stop Loss (Safety Net)
Thief-style SL at nearest swing low (3H timeframe) → 41,400 (adjust based on risk/lot size).
🏴☠️ Target 🎯: 44,200.00
Bullish momentum is fueling this heist—ride the wave but exit before the trap!
📰 Fundamental Backing (Why This Heist Works)
Macroeconomic trends, COT data, geopolitics, and sentiment align for bullish moves.
Full analysis? Check our bio0 linkk! 👉🔗🌎
⚠️ Trading Alerts (News & Risk Mgmt)
Avoid new trades during high-impact news (volatility = danger).
Use trailing stops to lock profits and dodge sudden reversals.
💥 Boost This Heist!
Hit 👍 (Boost Button) to strengthen our robbery squad!
More heists = More profits—stay tuned for the next steal! 🚀🤑
See you soon, fellow thieves! 🤝🎉

NFP Setups: Dow Breakout or USDJPY Breakdown?Big moves ahead? Friday’s Non-Farm Payrolls could be the trigger. ADP came in weak, jobless claims spiked, and ISM data disappointed. Now all eyes are on the Dow Jones and USDJPY. A strong NFP could send the Dow to new highs, while a weak one may sink USDJPY toward the 2025 low.
Watch the full breakdown and share your take in the comments.
This content is not directed to residents of the EU or UK. Any opinions, news, research, analyses, prices or other information contained on this website is provided as general market commentary and does not constitute investment advice. ThinkMarkets will not accept liability for any loss or damage including, without limitation, to any loss of profit which may arise directly or indirectly from use of or reliance on such information.

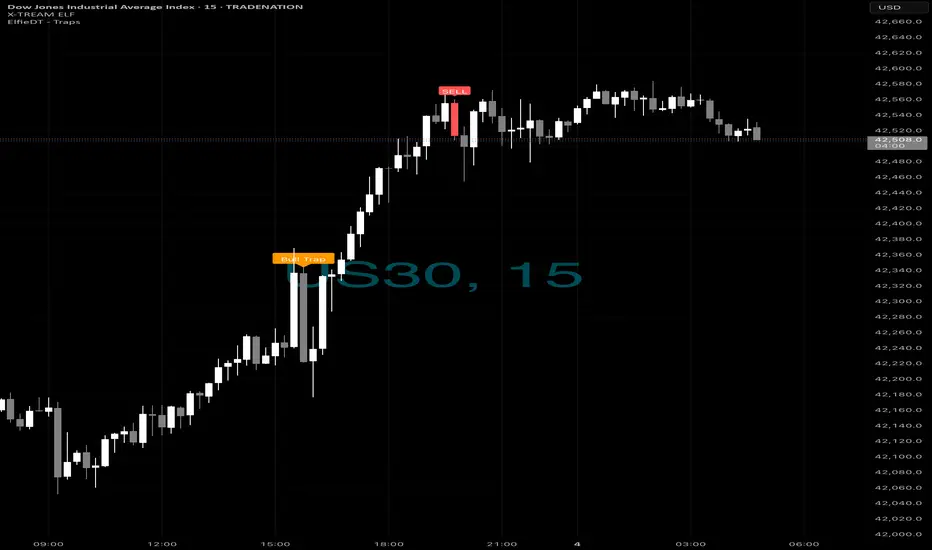
US30 SELL OPPORTUNITY (Trade what you see on not what you feel)Everything explained on the picture.
1. 3rd Touch
2. FVG
3. Possible break of TL
1 + 2 + 3 = Sell

DOW JONES starting the new Bullish Leg.Dow Jones (DJI) is rallying off its 4H MA50 (blue trend-line), shortly after making a new Higher Low on its 6-week Channel Up. Technically that is the start of its new Bullish Leg.
With the 4H RSI being identical to the Bullish Leg at the start of the Channel Up, we expect it to again rise by +4.30% and touch the 2.0 Fibonacci extension. Target 43600.
-------------------------------------------------------------------------------
** Please LIKE 👍, FOLLOW ✅, SHARE 🙌 and COMMENT ✍ if you enjoy this idea! Also share your ideas and charts in the comments section below! This is best way to keep it relevant, support us, keep the content here free and allow the idea to reach as many people as possible. **
-------------------------------------------------------------------------------
Disclosure: I am part of Trade Nation's Influencer program and receive a monthly fee for using their TradingView charts in my analysis.
💸💸💸💸💸💸
👇 👇 👇 👇 👇 👇

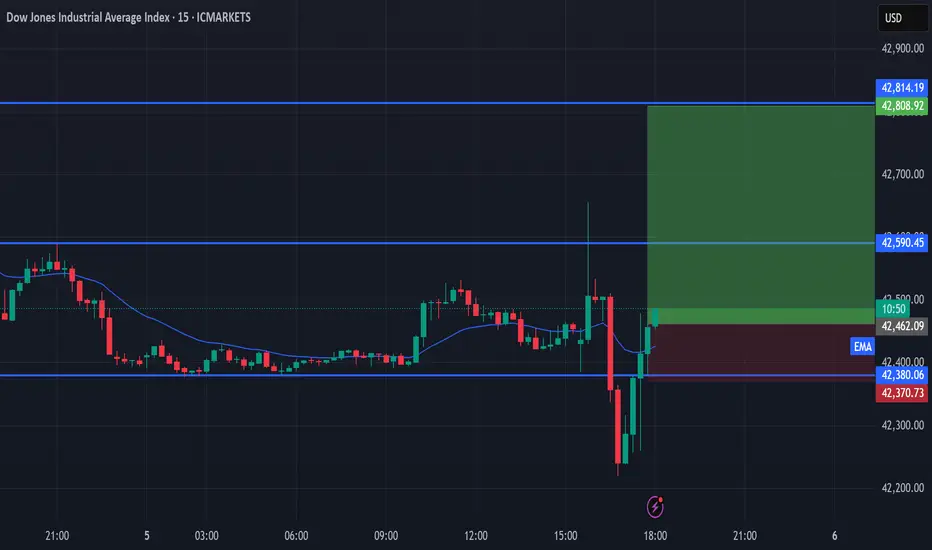
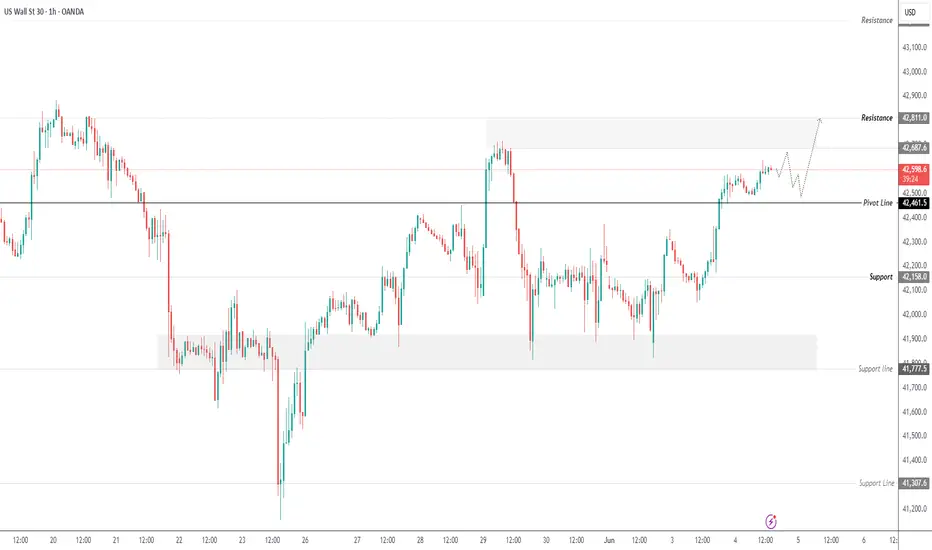
US30 – Key Resistance at 42690 Ahead of ADP-Driven VolatilityUS30
The indices market is expected to be highly volatile today due to upcoming data releases, especially the ADP employment report.
Dow Jones (US30) appears to be continuing its bullish scenario toward 42690.
A break above 42690 may push the price further toward 42810, and if momentum holds, toward 43200.
However, stability below 42690 could trigger a strong correction toward 42460.
A sustained move below the pivot line at 42570 would shift the trend to bearish.
Resistance: 42690, 42810, 43200
Support: 42460, 42260, 42080
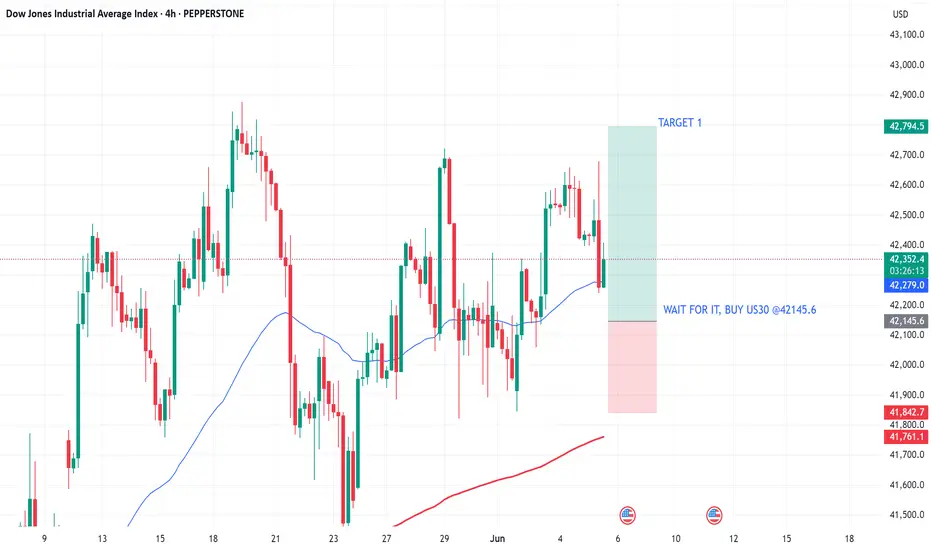
USA30 trading I deaHi traders is mpho again this is my trading plan for dow it's a clear set up, however fundamentals can violate set up as.we are trading under tarrrif territory but am encouraging you to stick in the trend n counter tarrif n not overthink n quickly take a decision to change the directions make sure you have confirmations before jump into any trends,as always nothing much analysis speak for it selfs more than words can,I wish you all the best 👍

DOW SHORTS?what do you think?
Reasy for the drop?
When tou use our indicators - you can have a view from all timeframes,,,,,
Multi-Time Frame Analysis (MTF) — Explained SimplyWant to level up your trading decisions? Mastering Multi-Time Frame Analysis helps you see the market more clearly and align your trades with the bigger picture.
Here’s how to break it down:
🔹 What is MTF Analysis?
It’s the process of analyzing a chart using different time frames to understand market direction and behavior more clearly.
👉 Example: You spot a trade setup on the 15m chart, but you confirm trend and structure using the 1H and Daily charts.
🔹 Why Use It?
✅ Avoids tunnel vision
✅ Aligns your trades with the larger trend
✅ Confirms or filters out weak setups
✅ Helps you find strong support/resistance zones across time frames
🔹 The 3-Level MTF Framework
Use this to structure your chart analysis effectively:
Higher Time Frame (HTF) → Trend Direction & Key Levels
📅 (e.g., Daily or Weekly)
Mid Time Frame (MTF) → Structure & Confirmation
🕐 (e.g., 4H or 1H)
Lower Time Frame (LTF) → Entry Timing
⏱ (e.g., 15m or 5m)
🚀 If you’re not using MTF analysis, you might be missing critical market signals. Start implementing it into your strategy and notice the clarity it brings.
💬 Drop a comment if you want to see live trade examples using this method!

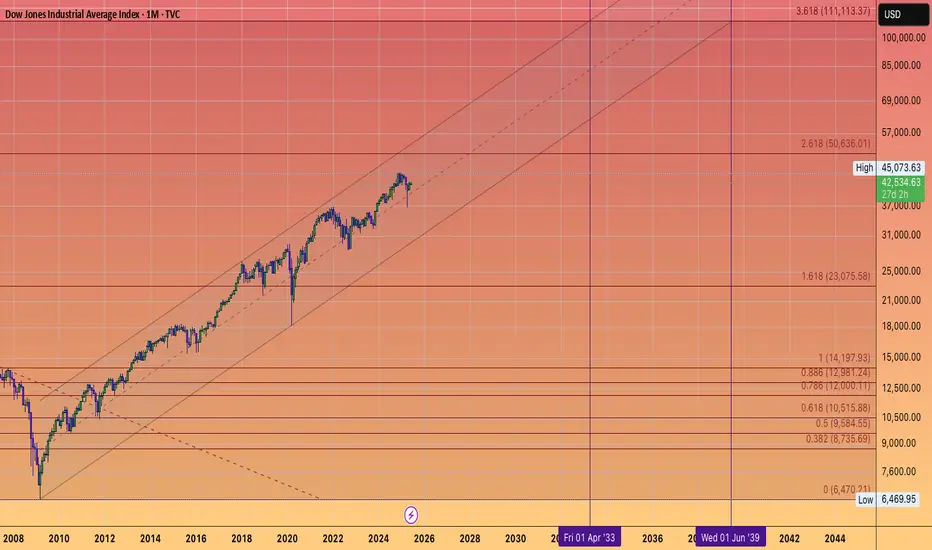
DOW JONES TO 111 THOUSAND..in the the 2030's.
as an investor you must be thinking 2 decades down the line.
NOT 2 quarters.
They can not
stop
printing #FIAT
it's in the code.
A 8% compound rate puts the Dow Jones at 85,000 in 2034.
I'm long forever.
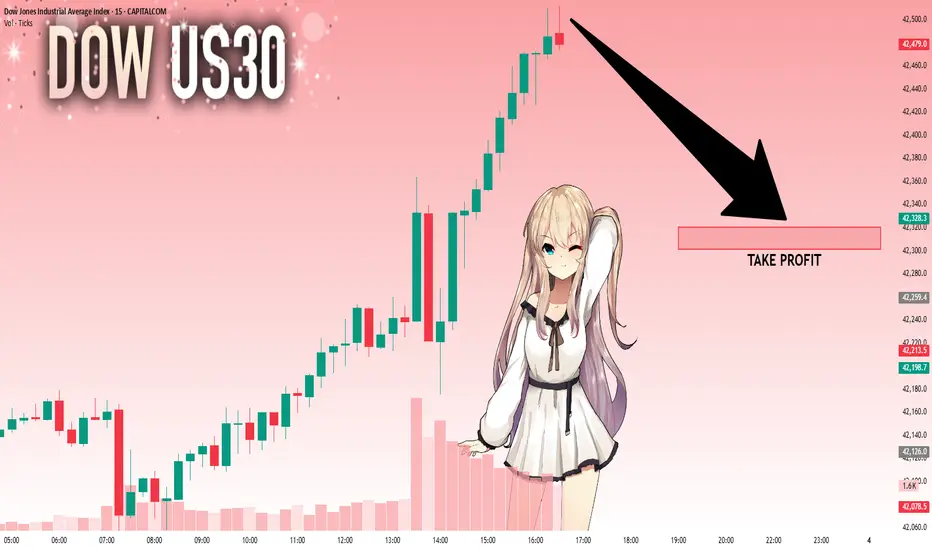
US30: Next Move Is Down! Short!
My dear friends,
Today we will analyse US30 together☺️
The recent price action suggests a shift in mid-term momentum. A break below the current local range around 42,499.2 will confirm the new direction downwards with the target being the next key level of 42,320.2.and a reconvened placement of a stop-loss beyond the range.
❤️Sending you lots of Love and Hugs❤️