Dow Jones Industrial Average Index forum
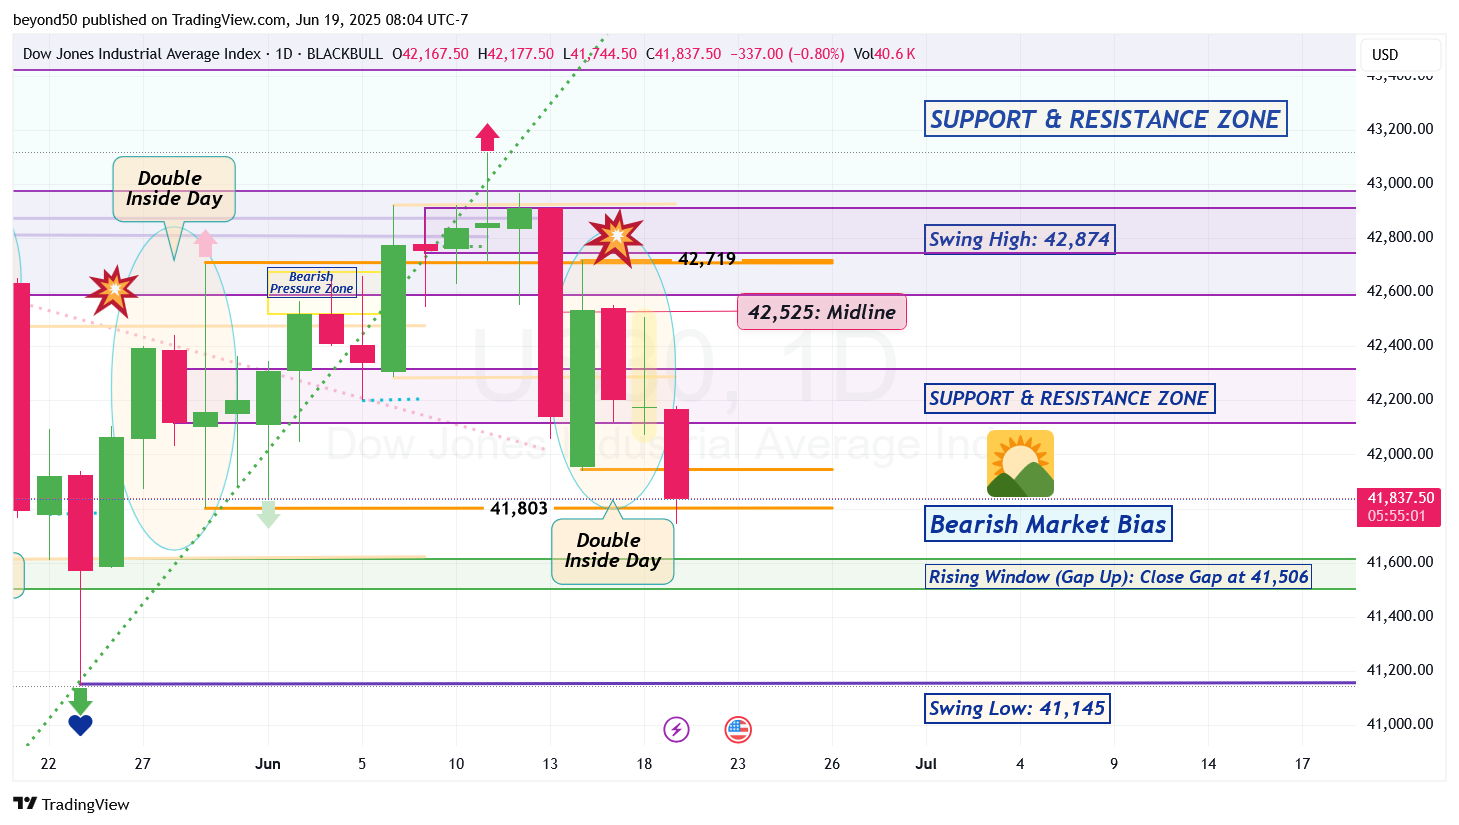
Looking at the Daily, it is in Bearish (directional) Market Bias. A Doji showed up within the bearish descent. The pattern is telling us that the drop can continue until a bottom reversal pattern shows up.
With a continuation of the bearish trend, that Gap may finally get closed with a candle close at 41,506 to continue downward and breach the Swing Low of 41,145. We'll see if it happens.
*Side Note:
If the bears drop down further in the trading days to come, it would be the 5th attempt at closing the Rising Window (Gap Up) that showed up on May 9th.
Also, a Double Inside Day appeared, so a very BIG move is coming this trading week or next that can look epic on the lower timeframes.
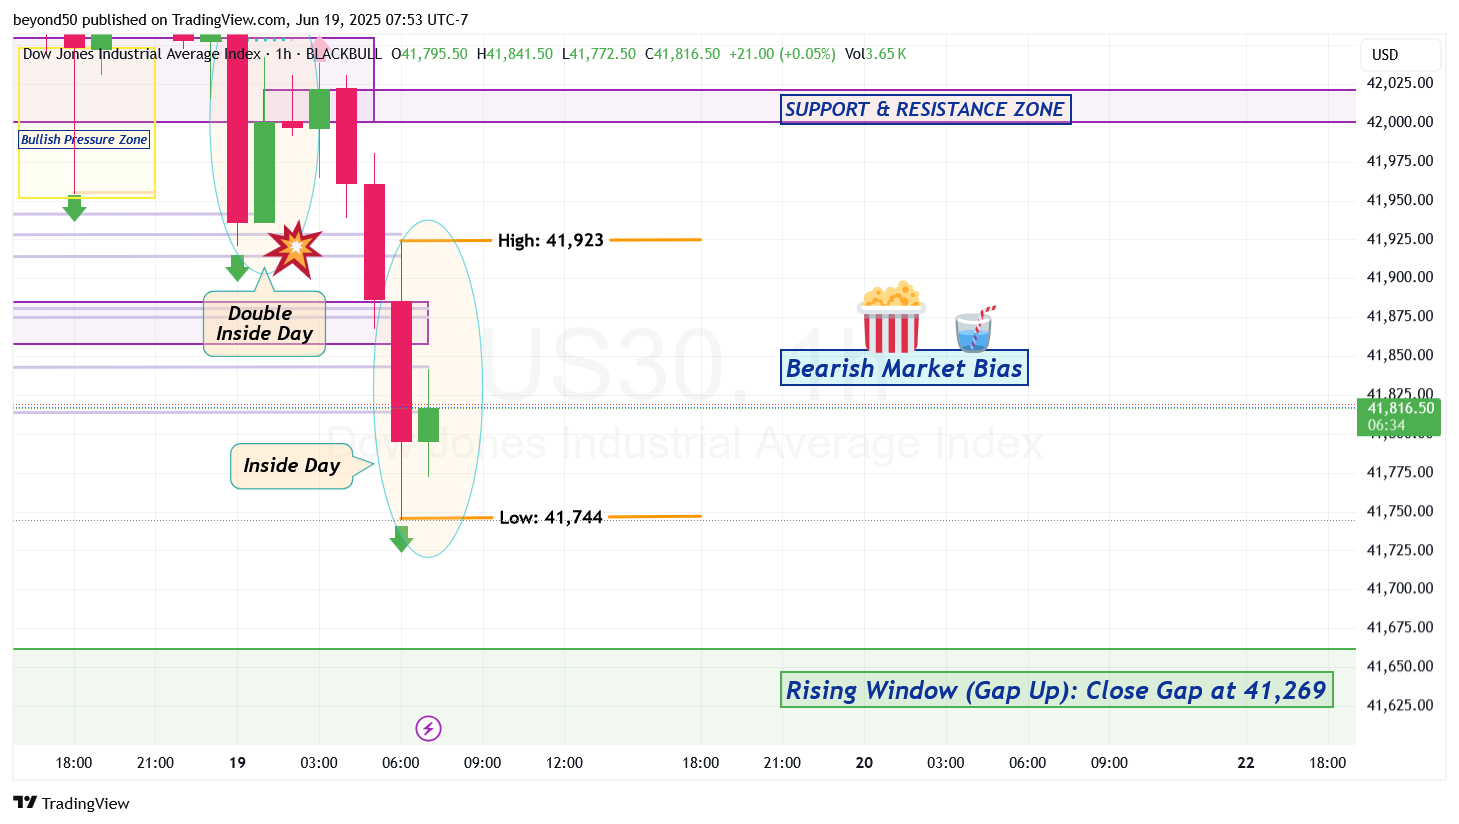
A Double Inside Day formed, which means that the market is in a pause with no clear direction. No surprise after the long and stunning drop. Price action will consolidate until a breakout from the pattern - either from the Inside Day's high of 41,923 or low of 41,744.
Also, a retrace is due from price action being in Oversold territory. It could be a shallow or proper retrace to 42,022 from Mean Reversion. Watch to see if the bulls can cross through the S&R Zone (that starts at 42,000) above them to rise above it. If not, then the bears will take the market down again.
Today?
2/2 Summary of Key Levels
Daily & 4-Hour Support and Resistance
Daily Support Levels: 41,940, 41,800, 41,600
Daily Resistance Levels: 43,116, 43,300, 43,500
4-Hour Support Levels: 41,900, 41,750
4-Hour Resistance Levels: 42,200, 42,500
Exponential Moving Average (EMA) Levels
Daily Time Frame:
EMA 50: 42,050
EMA 100: 41,800
EMA 200: 41,600
EMA 400: 41,200
4-Hour Time Frame:
EMA 50: 42,100
EMA 100: 41,900
EMA 200: 41,700
EMA 400: 41,500
Weekly and Daily Pivots
Weekly Pivots:
Pivot Point: 42,000
Resistance 1: 42,300
Support 1: 41,700
Daily Pivots:
Pivot Point: 42,000
Resistance 1: 42,200
Support 1: 41,800
Fibonacci Retracement Levels
23.6%: 42,200
38.2%: 41,800
61.8%: 41,500
Fundamental Analysis and Upcoming USD News
As we look ahead, it's essential to consider the impact of fundamental factors on the US30 index. Upcoming USD news events that may influence market sentiment include:
Federal Reserve Interest Rate Decision: Scheduled for next week, this decision will significantly impact the USD and, consequently, the US30 index. Traders should be prepared for increased volatility around this announcement.
Consumer Price Index (CPI) Data Release: Expected later this month, the CPI data will provide insights into inflation trends, affecting monetary policy and market sentiment.
Unemployment Claims Report: Due for release next week, this report will shed light on the labor market's health, which is crucial for economic growth and market performance.
These events are likely to create fluctuations in the US30 index, and traders should remain vigilant and adjust their strategies accordingly.
Conclusion
In conclusion, the US30 index is currently navigating through critical support and resistance levels, with various technical indicators providing insights into potential market movements. As we approach significant economic events, traders should remain informed and adapt their strategies to capitalize on opportunities in this dynamic market.