NAS100 Potential ReversalHi there,
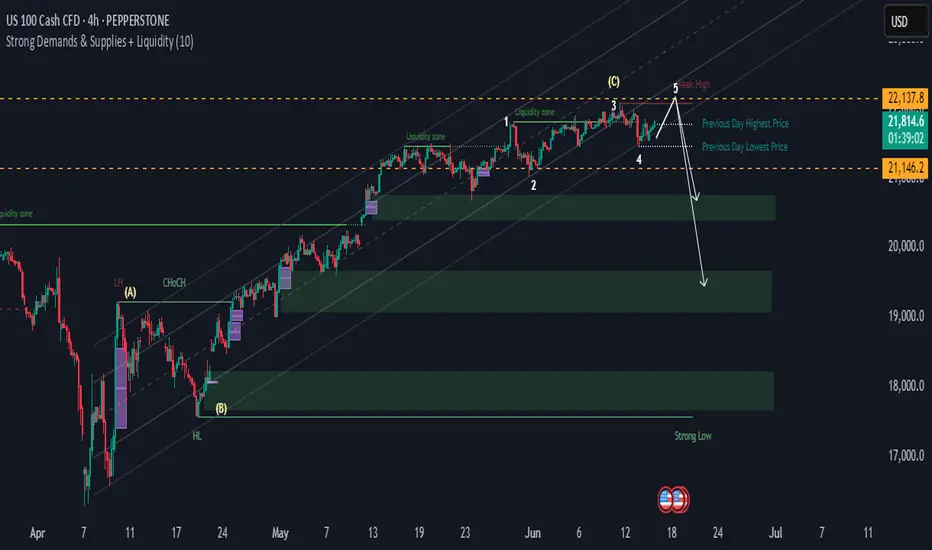
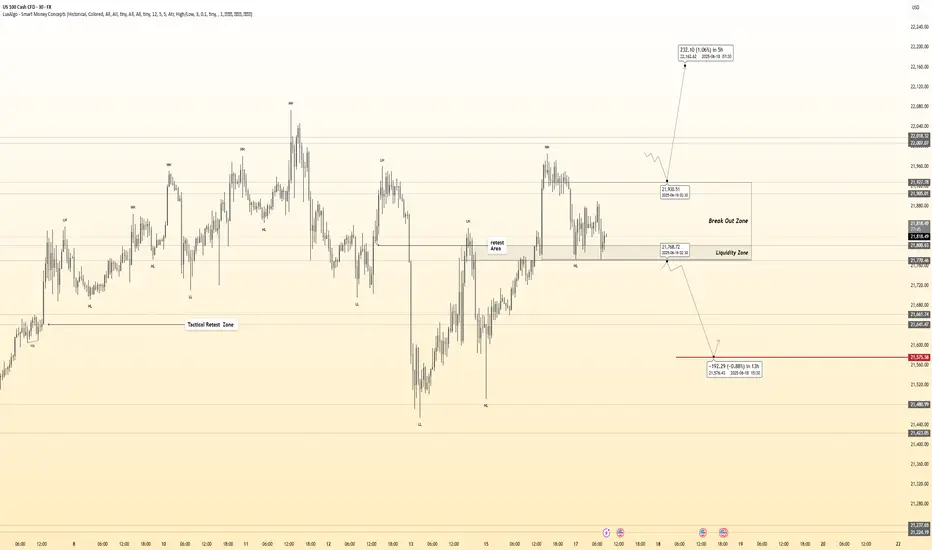
The NAS100 is slightly bullish and fairly stagnant. It is consolidating between two key levels (orange lines). A break below the price might fall into deeper demand zones.
Short Notes
- **Elliott Wave**: 5-wave structure appears complete at resistance (22,137.8), signalling a possible reversal.
- **Liquidity Zones**: Price is at/near a major liquidity zone, increasing reversal risk.
- **Break High**: There's a potential for a false breakout above wave 5 before dropping.
- **Support Levels**: The 21,800.6 (previous day high) and 21,146.2 (previous day low) for first support.
- **Demand Zones**: Strong demand below 21,146.2, with deeper support near 20,000 and 18,800.
- **Overview: A possible bearish move ahead from current highs, targeting lower demand zones.
Happy Trading,
K.
Not trading advice
USTEC trade ideas
Reversal in Play or Institutional Continuation? | NAS100USDCritical Zone with VEP Trader ⚠️
Nasdaq 100 (NAS100USD) is showing mixed signals — and it’s exactly in these types of setups that our VEP Trader strategy shines. Here's what I'm seeing and how we're breaking it down step by step.
🔍 1. Trend Confirmation (1D)
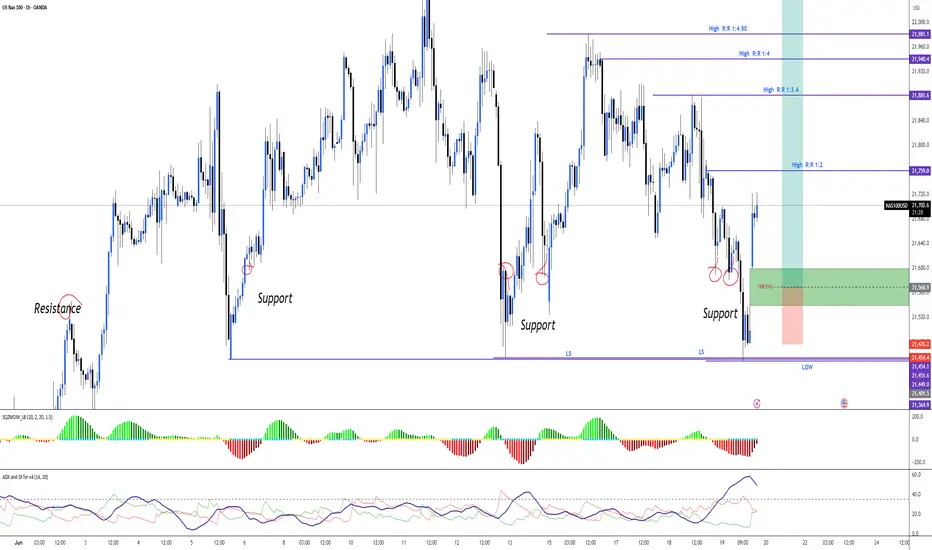
On the daily timeframe, NAS100USD is showing a weak bullish trend based on the Support & Resistance and the Squeeze Momentum indicators.
📉 However, the most recent daily candle swept liquidity from two key days:
📅 June 6
📅 June 13
This triggers an alert in our VEP strategy: liquidity taken = institutional zone possibly in play.
💧 2. Liquidity Sweep + FVG (Fair Value Gap)
After the sweep, switching to the 1-hour timeframe (1H) reveals a large Fair Value Gap (FVG) just below the cleared liquidity zone.
This offers a potential setup — only if price returns to that FVG, and the structure validates the trade:
Retest the FVG zone
Show signs of reversal structure
Confirm with bullish Squeeze Momentum on lower timeframes
🛠️ 3. Execution with VEP Trader
🎯 If price pulls back into the FVG, we’ll be watching for:
Bullish reaction after liquidity has been swept
Clear bullish divergence in momentum
Previous support and EMA alignment in 5M/2M charts
🟢 If all conditions align → possible CALL entry based on VEP structure.
⛔ Stop Loss & 🎯 Take Profits (VEP Guidelines)
Suggested SL: below the FVG or last clean low
TP1: immediate reaction zone or recent high
TP2: next liquidity zone above. Up to four TP
Or target the last pullback for a more secure exit
✅ Final Thoughts
This is a classic scenario where we don’t guess — we wait for institutional confirmation.
The VEP Trader Strategy guides us with Vision, Execution, and Precision.
👉 What do you think?
Is NAS100USD gearing up for a new leg up — or was that just a liquidity flush before a deeper move?
Drop your take in the comments 👇
#NAS100USD
#VEPTrader
#FairValueGap
#LiquiditySweep
#SmartMoneyConcepts
#PriceAction
#TechnicalAnalysis
#InstitutionalTrading
#MarketStructure
#CleanSetup
#DivergenceSetup
#MomentumAnalysis
#GapTrading
#TradeWhatYouSee
#ScalpingForex
#AlgoPro
#ForexNAS100
#LiquidityZones
#SqueezeMomentum
#IntradaySetup
#BreakdownStrategy
#SupportResistance
#ReversalWatch
#PrecisionTrading
#TradingPlanReady
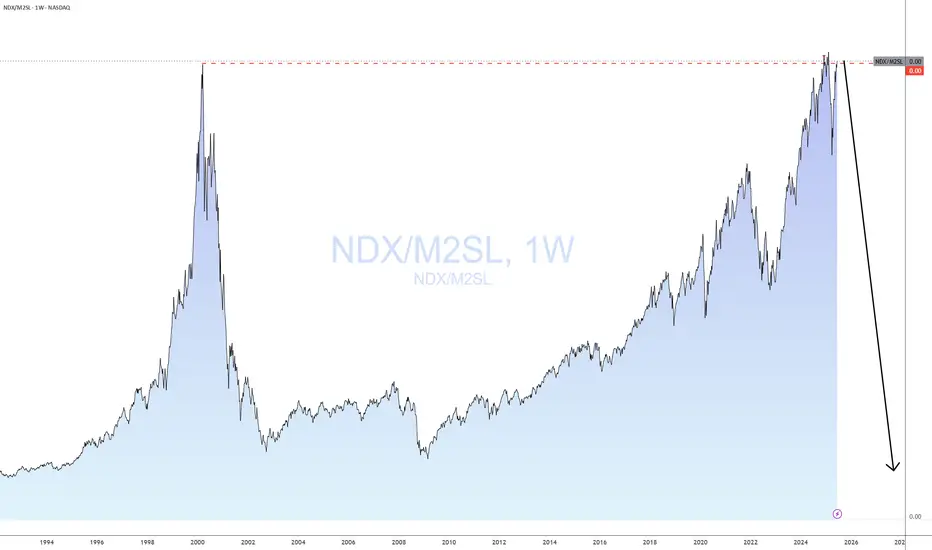
QQQ - NASDAQ Has Never Been This ExpensiveQQQ relative to the money supply reveals that markets have never been this expensive in history. Despite the significant amount of money pumped in during the COVID-19 pandemic, the economy has not kept pace with all the zeros added to Gov debt.
If we can't lower deficits now at max employment, when will we?
Tulips!
Caution is in order despite what "experts" may tell you.
Click like Follow Subscribe, let's get to 5,000 followers.
USNAS100 - Mideast Conflict & Fed Uncertainty Pressure FuturesWall Street Futures Edge Lower Amid Prolonged Mideast Conflict
U.S. stock index futures slipped slightly on Tuesday as the ongoing Middle East conflict entered its fifth day, weighing on global sentiment ahead of the Federal Reserve’s upcoming policy meeting.
Technical Outlook:
Price action remains in a sensitive zone, but the bias stays bearish below 21930.
🔻 A confirmed 1H close below 21790 would likely trigger a deeper move toward 21635, and potentially 21470.
🔺 On the upside, a break above 21930 would indicate renewed bullish momentum, opening the path toward 22065 and 22200.
📌 If price holds above 21790, a test of 21930 is likely.
Any positive geopolitical developments or ceasefire negotiations could spark a stronger upside move.
Key Levels:
• Pivot: 21790
• Resistance: 21930 / 22065 / 22200
• Support: 21635 / 21470 / 21375

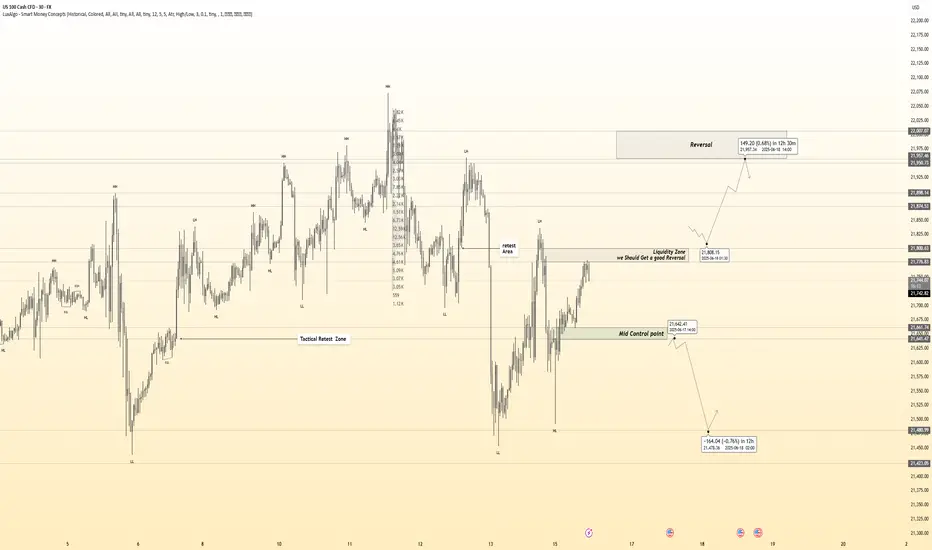
Hanzo / Nas100 30 Min ( Accurate Tactical Break Out Zones )🔥 Nas100 – 30 Min Scalping Analysis (Bearish Setup)
⚡️ Objective: Precision Breakout Execution
Time Frame: 30-Minute Warfare
Entry Mode: Only after verified breakout — no emotion, no gamble.
👌Bullish After Break : 21810
Price must break liquidity with high volume to confirm the move.
👌Bearish After Break : 21640
Price must break liquidity with high volume to confirm the move.
☄️ Hanzo Protocol: Dual-Direction Entry Intel
➕ Zone Activated: Strategic liquidity layer detected — mapped through refined supply/demand mechanics. Volatility now rising. This isn’t noise — this is bait for the untrained. We're not them.
🩸 Momentum Signature Detected:
Displacement candle confirms directional intent — AI pattern scan active.
— If upward: Bullish momentum burst.
— If downward: Aggressive bearish rejection.
🦸♂️ Tactical Note:
The kill shot only comes after the trap is exposed and volume betrays their position.
NASDAQ TRADING ROADMAP 16 - 20 JUNI 2025📉 NASDAQ TRADING ROADMAP – STRATEGY OUTLOOK 📉
The NASDAQ has rejected Magnet Area (SpH4) 21767.00 – 22067.00, signaling potential downside movement.
As long as price stays below Magnet Area (dmD) 21736.00 – 21863.00, the market is likely to continue its decline toward Magnet Area (dmH4) 21136.00 – 21020.00, especially if price breaks through Magnet Area (dmH4) 21524.00 – 21445.00.
📌 Roadmap Summary:
🔻 Rejection confirmed from (SpH4)
⬇️ Bearish bias valid while below (dmD)
🚨 Breakout trigger: (dmH4) 21524.00 – 21445.00
🎯 Target zone: (dmH4) 21136.00 – 21020.00
⚠️ DISCLAIMER:
This content is for educational purposes only and does not constitute financial advice. Trading involves substantial risk. Always conduct your own analysis and apply proper risk management before making any trading decisions.

Hanzo / Nas100 30 Min ( Accurate Tactical Break Out Zones )🔥 Nas100 – 30 Min Scalping Analysis (Bearish Setup)
⚡️ Objective: Precision Breakout Execution
Time Frame: 30-Minute Warfare
Entry Mode: Only after verified breakout — no emotion, no gamble.
👌Bullish After Break : 21930
Price must break liquidity with high volume to confirm the move.
👌Bearish After Break : 21770
Price must break liquidity with high volume to confirm the move.
☄️ Hanzo Protocol: Dual-Direction Entry Intel
➕ Zone Activated: Strategic liquidity layer detected — mapped through refined supply/demand mechanics. Volatility now rising. This isn’t noise — this is bait for the untrained. We're not them.
🩸 Momentum Signature Detected:
Displacement candle confirms directional intent — AI pattern scan active.
— If upward: Bullish momentum burst.
— If downward: Aggressive bearish rejection.
🦸♂️ Tactical Note:
The kill shot only comes after the trap is exposed and volume betrays their position.
Hanzo / Nas100 30 Min ( Accurate Tactical Break Out Zones )🔥 Nas100 – 30 Min Scalping Analysis (Bearish Setup)
⚡️ Objective: Precision Breakout Execution
Time Frame: 30-Minute Warfare
Entry Mode: Only after verified breakout — no emotion, no gamble.
👌Bullish After Break : 21840
Price must break liquidity with high volume to confirm the move.
👌Bullish After Break : 21930
Price must break liquidity with high volume to confirm the move.
👌Bearish After Break : 21755
Price must break liquidity with high volume to confirm the move.
☄️ Hanzo Protocol: Dual-Direction Entry Intel
➕ Zone Activated: Strategic liquidity layer detected — mapped through refined supply/demand mechanics. Volatility now rising. This isn’t noise — this is bait for the untrained. We're not them.
🩸 Momentum Signature Detected:
Displacement candle confirms directional intent — AI pattern scan active.
— If upward: Bullish momentum burst.
— If downward: Aggressive bearish rejection.

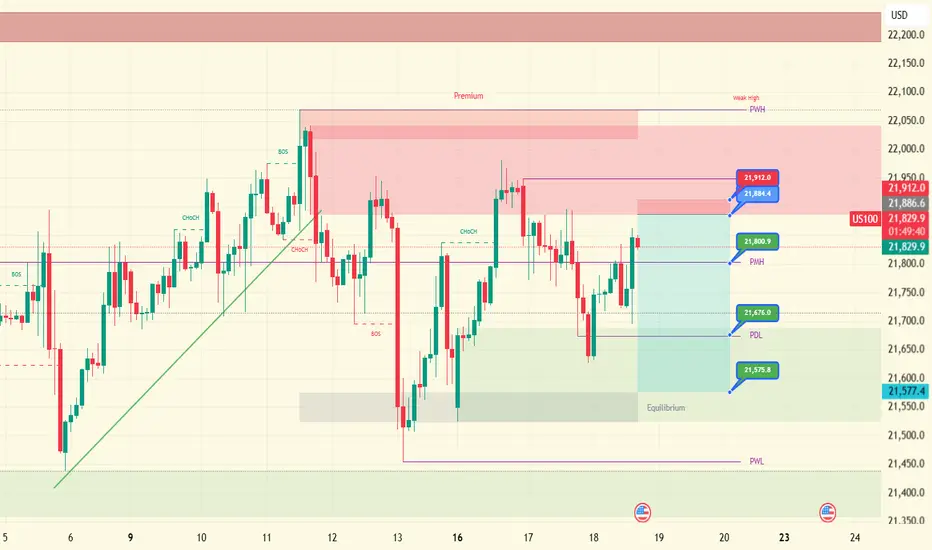
FOMC short: waiting for this short entry to get activated.1. Entry ~21,884.4
Why here? Price has rallied into that red “supply” zone (fair-value gap + bearish order block), then chopped down and back up to retest its lower edge. That level also coincides with the broken swing pivot (Change-of-Character from bull→bear). We short the retest, expecting supply to push price lower.
2. Stop-loss 21,912.0
Why there? Just above the top of the supply zone/weak high. If price climbs above 21,912, it’s cleared the zone and negated the bearish bias—so we get out.
3. Take-Profits
TP1 at 21,800.9 (the old swing-high turned support, labeled “PMH”)
First support zone—locks in quick gains and covers your risk.
TP2 at 21,675.0 (the previous day’s low, labeled “PDL”)
A deeper support area where sellers will likely pause or flip to buyers.
(Optional TP3 at 21,575.8 if you want a final scalp into the gray “equilibrium”/demand zone.)
Hanzo / Nas100 30 Min ( Accurate Tactical Break Out Zones )🔥 Nas100 – 30 Min Scalping Analysis (Bearish Setup)
⚡️ Objective: Precision Breakout Execution
Time Frame: 30-Minute Warfare
Entry Mode: Only after verified breakout — no emotion, no gamble.
👌Bullish After Break : 21840
Price must break liquidity with high volume to confirm the move.
👌Bullish After Break : 21930
Price must break liquidity with high volume to confirm the move.
👌Bearish After Break : 21755
Price must break liquidity with high volume to confirm the move.
☄️ Hanzo Protocol: Dual-Direction Entry Intel
➕ Zone Activated: Strategic liquidity layer detected — mapped through refined supply/demand mechanics. Volatility now rising. This isn’t noise — this is bait for the untrained. We're not them.
🩸 Momentum Signature Detected:
Displacement candle confirms directional intent — AI pattern scan active.
— If upward: Bullish momentum burst.
— If downward: Aggressive bearish rejection.
🦸♂️ Tactical Note:
The kill shot only comes after the trap is exposed and volume betrays their position.
Hanzo / Nas100 30 Min ( Accurate Tactical Break Out Zones )

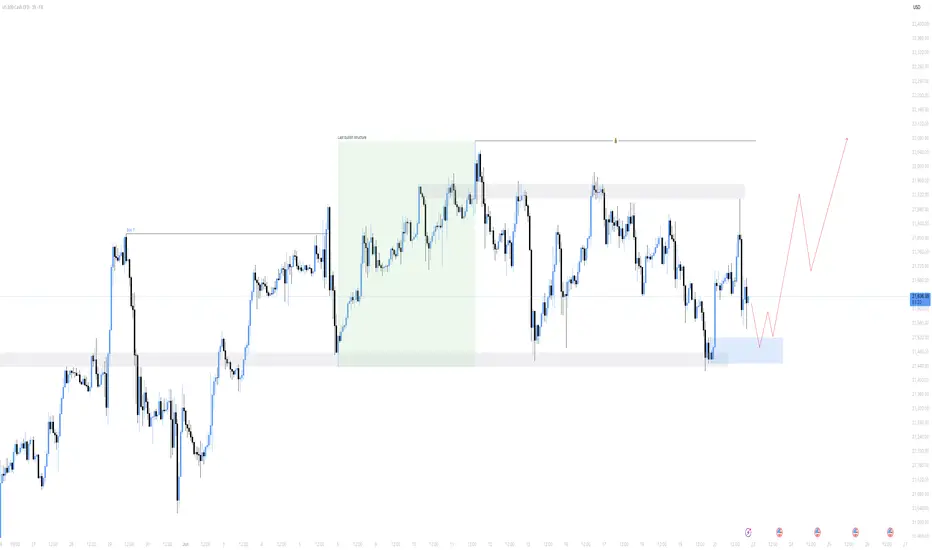
Nasdaq longThe last bullish structure never did a deep mitigation, reach an demand and trade up to higher highs. Price is in a HTF consolidation, bears and bulls are pushing price between a large range at the moment.
Upcoming week will show a lot of high impact news events, I'm expecting price to continue bullish. It's a matter of time.
Bearish SignalPrice is currently at the highest resistance NAS100 ever reached in its lifetime and failed to break, the last time it tested the resistance it dropped dismally confirming it’s a very strong resistance. There’s also a dynamic resistance supported by the trend line in green which was a support zone prior. Im very confident the resistance won’t break, if it were to ever break it’ll need a strong pull back which will definitely suppress TP1

Nasdaq 100 Trade idea for the day and bias.This is what I'm expecting Nas100 to do today looking at the higher timeframe structure.

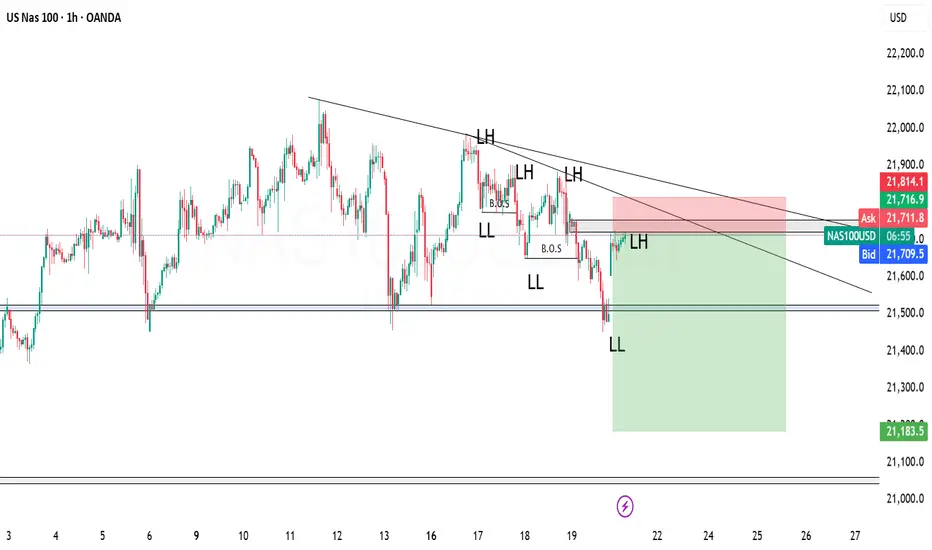
SELL NAS100 - TEXT BOOK SET UPFollowing the trend. The trend has been making LHs and LLs. I am just following the trend nothing much.
US100 / NASDAQ TodayUS100 / NASDAQ Today is still bearish
My SSM Reversal Pattern is comming.
This is just my view of course

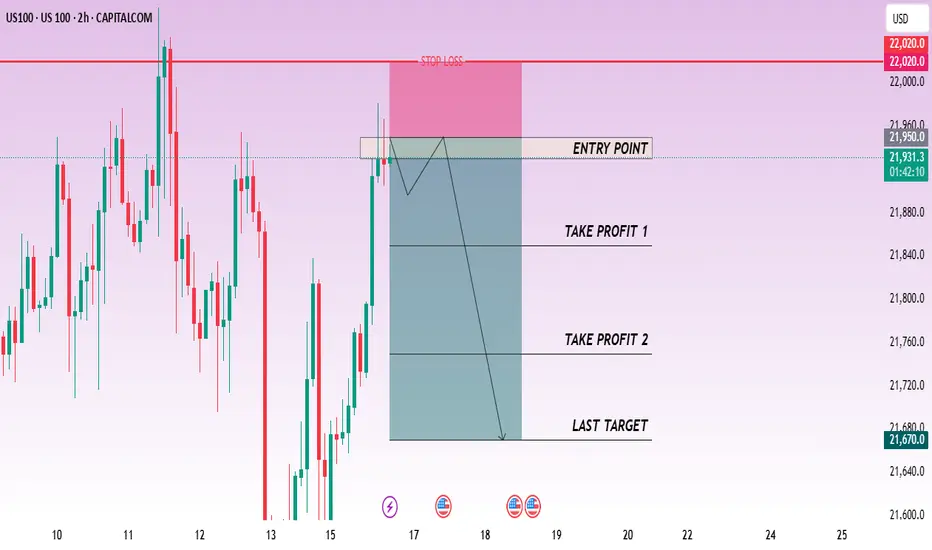
CHECK US100 SIGNAL READ CAPTAINus 100 sell now ✅
entry point (21950) (21930)
TAKE PROFIT 1: (21850)
TAKE PROFIT 2: (21750)
LAST TARGET (21650)
STOP LOSS (22020)
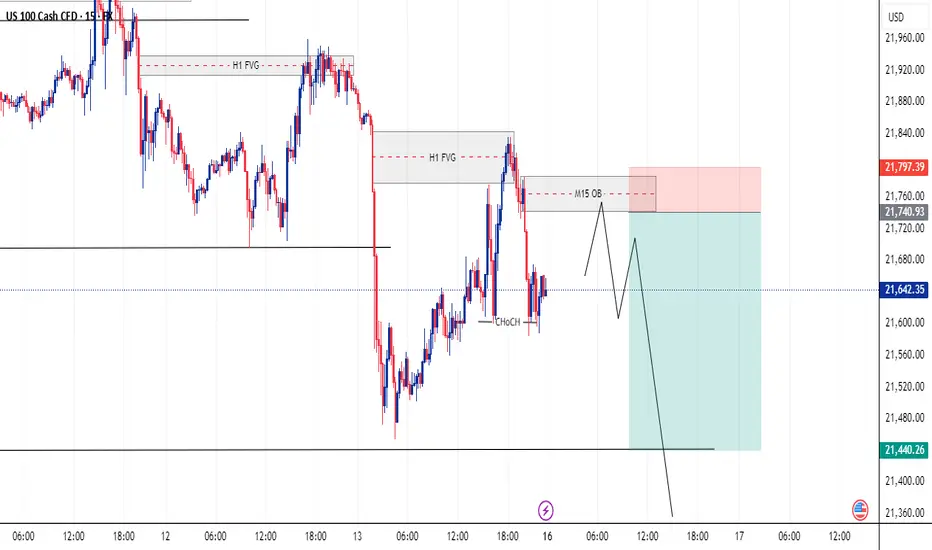
My trade idea on NASDAQ 100 For the coming week I'm seeing NAS100 dropping lower to pull/draw on liquidity below there heading to where we have what looks like a strong POI...
Drop your comment below if you're seeing something totally different from what I'm seeing here and lets have a discussion about our views.
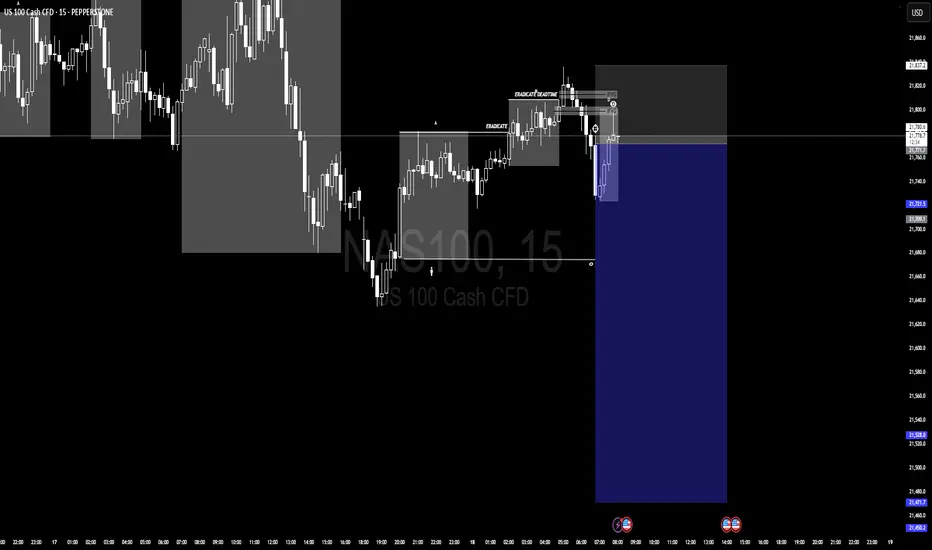
NQ! SHORT SCALPE1.Entry method 15 minutes IFVG.
2.Entry 21768.41
3.Stoploss:21831.77
4.Takeprofit:21471.40
This not not financial advice as im using this platform to journal trading forex and CFD involves risk so apply your own strategy PEPPERSTONE:NAS100
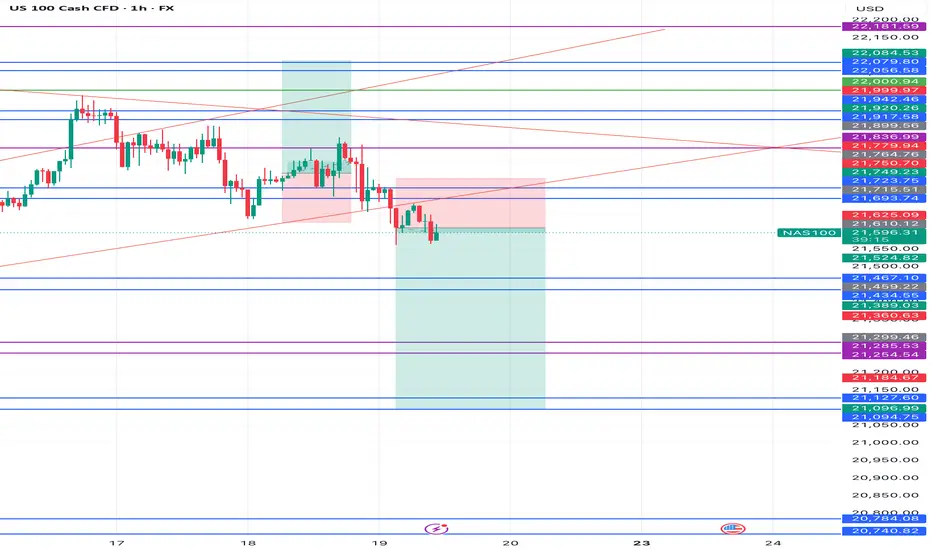
NASDAQ Consolidation: Why Sitting Out Is Sometimes the Best PlayI'm currently monitoring the NASDAQ (US100) closely, and on the 4-hour chart, we can clearly see that the market is in a phase of consolidation 🔍
Yesterday, I was anticipating a bullish breakout, which could have signaled the start of a structure with higher highs and higher lows — something that would have presented a clean long opportunity 📈. However, during the U.S. session, the NAS100 momentum shifted and we instead saw a bearish breakdown, invalidating the previous setup 🚫
As things stand now, there's no clear directional bias on the 4H — just a sideways range with neither bulls nor bears in full control 🤝. This type of environment calls for patience and discipline.
It's worth noting that knowing when not to trade is just as important as knowing when to pull the trigger. Sitting on the sidelines and allowing the market to make the next move — whether that’s a break above or below this consolidation range — is a valid and often wise decision 🧘♂️📊
At the moment, my preference is to remain neutral and let price show its hand before committing to a position.
⚠️ Disclaimer:
This analysis is for educational purposes only and does not constitute financial advice. Always do your own research and apply proper risk management when trading.

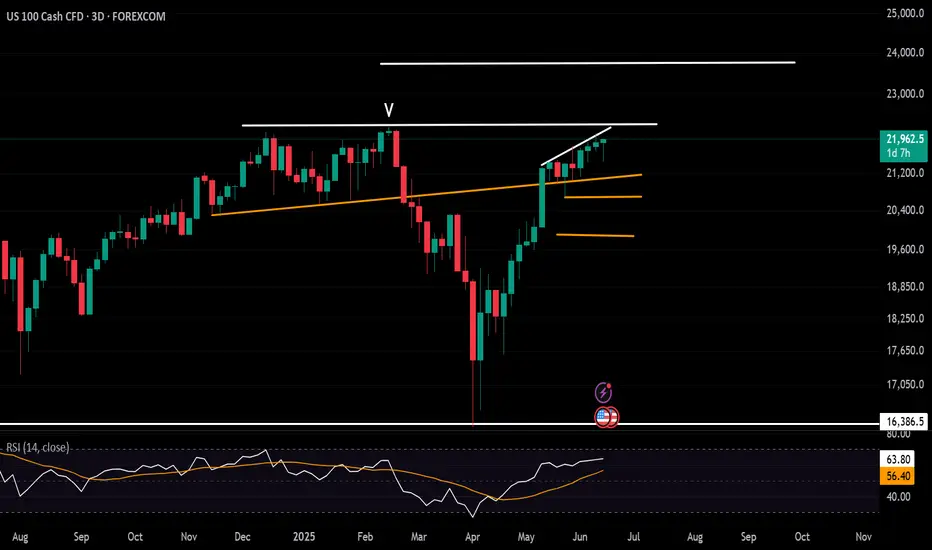
Nasdaq Challenges Record HighsNasdaq continues to trade just below a one-month resistance line, which connects consecutive higher highs formed between May and June 2025. This line has capped the index just shy of the 22,000 mark, as price action navigates the push and pull between summer momentum, geopolitical tensions, and economic uncertainty.
To the upside, a decisive break and hold above 22,200 would be a bullish trigger, potentially opening the path toward the 23,700 resistance zone. This level notably aligns with the 0.618 Fibonacci extension, projected from the 2023 low, 2025 high, and 2025 retracement low.
On the downside, risks remain for a deeper correction if the index retraces toward the 21,000–20,600 region. This zone represents the neckline of the December–January double top, and stands as a critical threshold separating a bullish continuation scenario from the possibility of a deeper bearish pullback.
- Razan Hilal, CMT
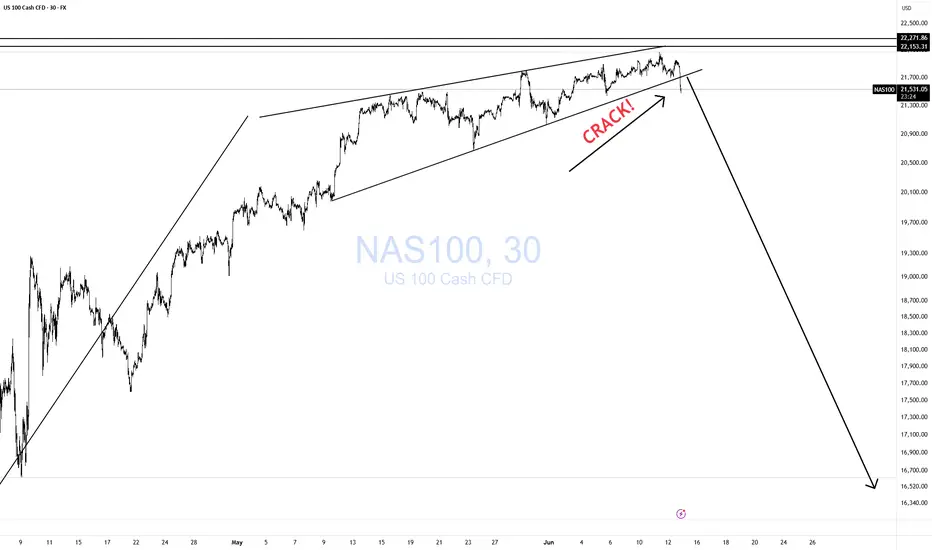
NDX CRACK!I will keep this simple.
The rising wedge broke. Markets are in trouble.
The Trump disaster keeps escalating every day.
This is what the world looks like without the US
strong leadership defending freedom and democracy. CHAOS!
NAS100 is about experience a big fallfrom the chart, you can find out that nas100 is about to be bearish...
Reason;
1, Double top pattern
2, Ascending triangle
