ICX/USDT – Bullish Breakout Confirmed, Eyeing Higher Targets
Date: June 9, 2025
ICX/USDT has officially broken out of a key consolidation range and is now entering a new bullish phase. With momentum rising and volume supporting the move, the path of least resistance remains to the upside.
📊 Technical Overview:
Current Price: $0.1672
Key Support Zone: $0.
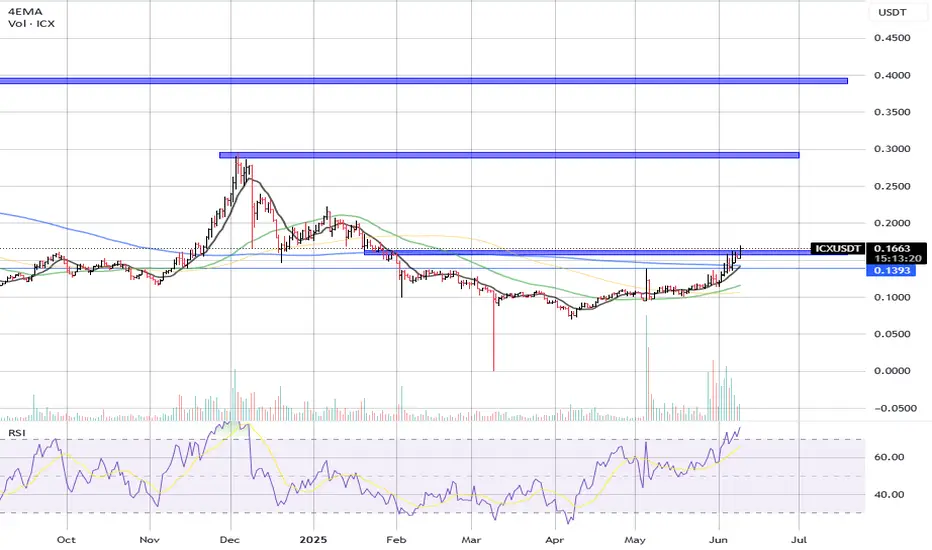
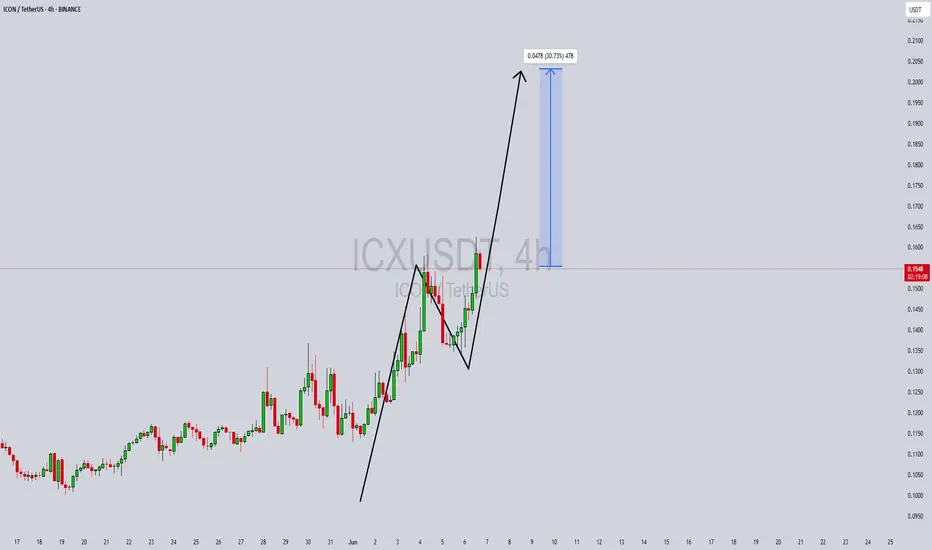
ICXUSDT Forming Bullish impulseICXUSDT has recently shown a strong bullish impulse, followed by a healthy pullback forming a classic bull flag or V-shaped recovery pattern. This setup often signals continuation of the uptrend, especially when supported by solid trading volume, as seen in the recent sessions. The consolidation and
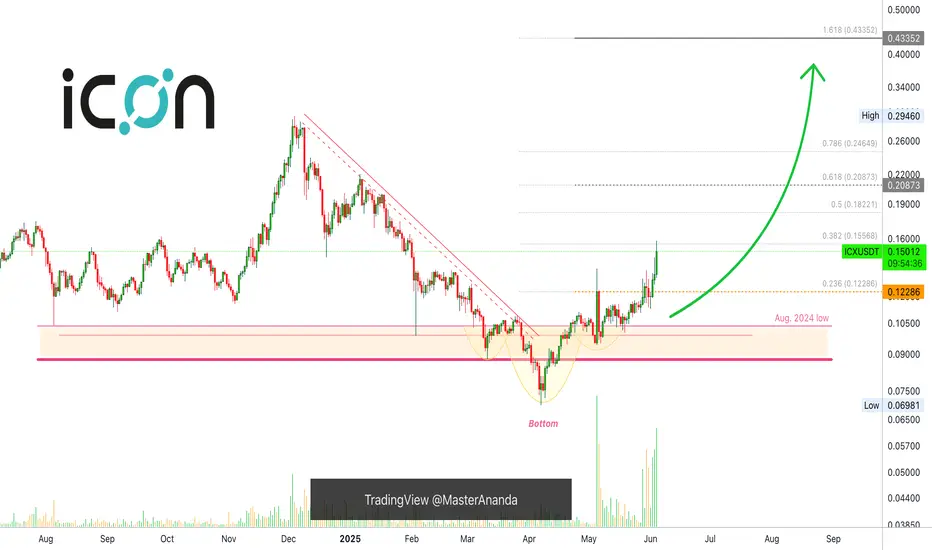
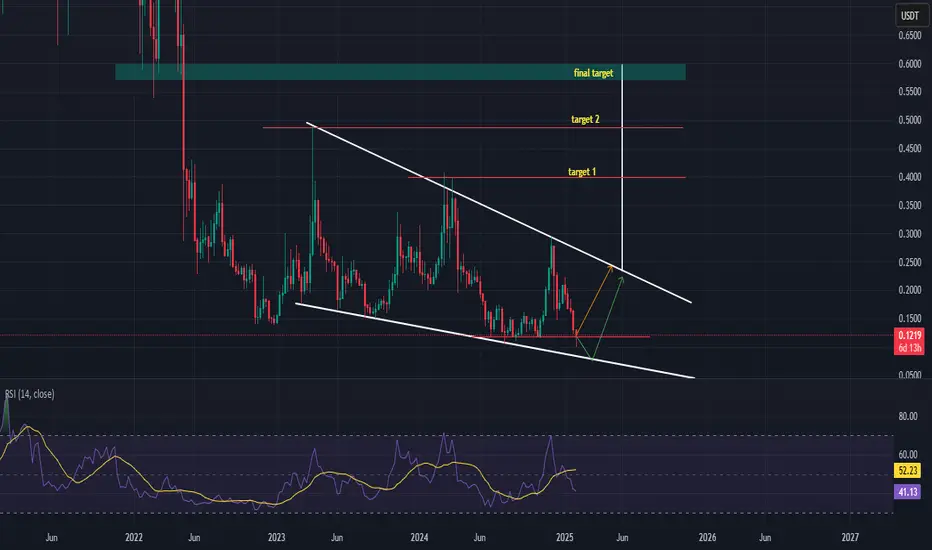
ICX on the massive discounthi traders,
The price broke the support and made a new low.
The same happened for ZECUSDT in July 2024. Soon after ZEC reclaimed the support, the price rose almost 400 %.
I expect something similar for ICXUSDT.
If the price recovers the support, it should go higher so we should retest at least the

The Trading Rookie, How I Don't Make Money Fast & Waste TimeThe bottom is set and once the bottom is in bullish momentum builds up and grows. Bullish momentum is now present on this chart coupled with really high volume. The high volume is what confirms the current move being real and strong. ICXUSDT daily.
When they are not moving nothing can move them. Bu
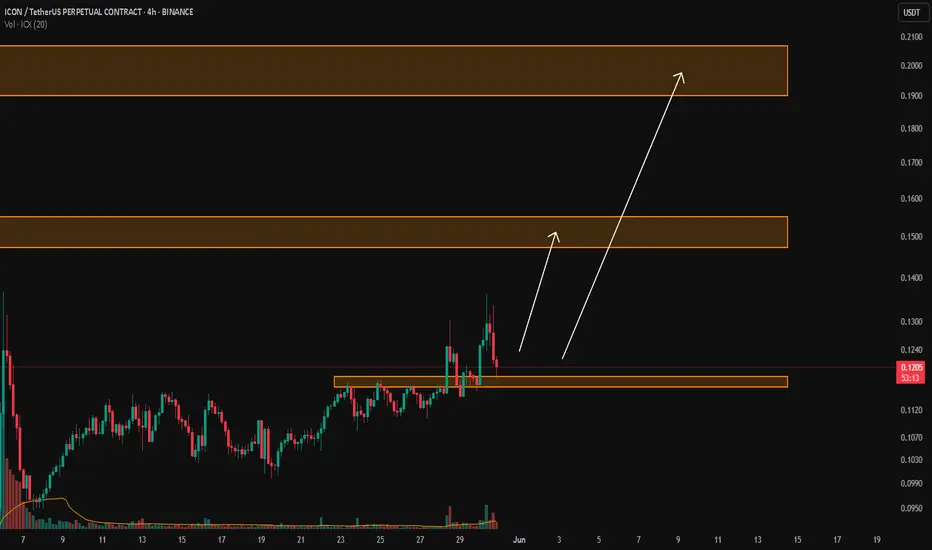
ICX/USDTKey Level Zone: 0.1265 - 0.1285
HMT v8.1 detected. The setup looks promising, supported by a previous upward/downward trend with increasing volume and momentum, presenting an excellent reward-to-risk opportunity.
HMT (High Momentum Trending):
HMT is based on trend, momentum, volume, and market str
Check if it can rise above 0.1135
Hello, traders.
If you "Follow", you can always get new information quickly.
Please also click "Boost".
Have a nice day today.
-------------------------------------
(ICXUSDT 1D chart)
In order for a medium- to long-term uptrend to begin, the price must be maintained above the M-Signal indicat

ICXUSDT 1DICX ~ 1D Analysis
#ICX Buy after successfully penetrating this resistant line with a short -term target of at least 15%+ from here.

ICXUSDT - falling wedgehi traders,
Let's have a look at ICXUSDT on 3D time frame.
Yesterday we published this analysis on the monthly time frame:
Having a closer look on the 3D chart, makes me even more confident that ICX will see higher prices within the next few weeks/months.
The falling wedge is a bullish pattern
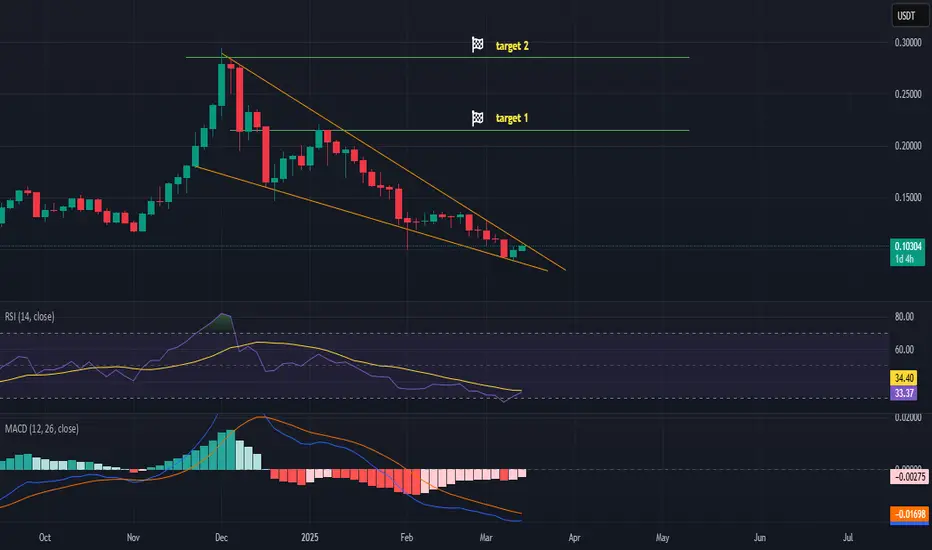
ICXUSDT - the bottom is in or very closehi traders,
Unfortunately, the market was brutal for us last night and all altcoins crashed hard.
The good news is that the bottom is already in or it's very close.
Don't be surprised if ICX makes new all-time low before starting the uptrend.
The falling wedge pattern should result in a bullish br
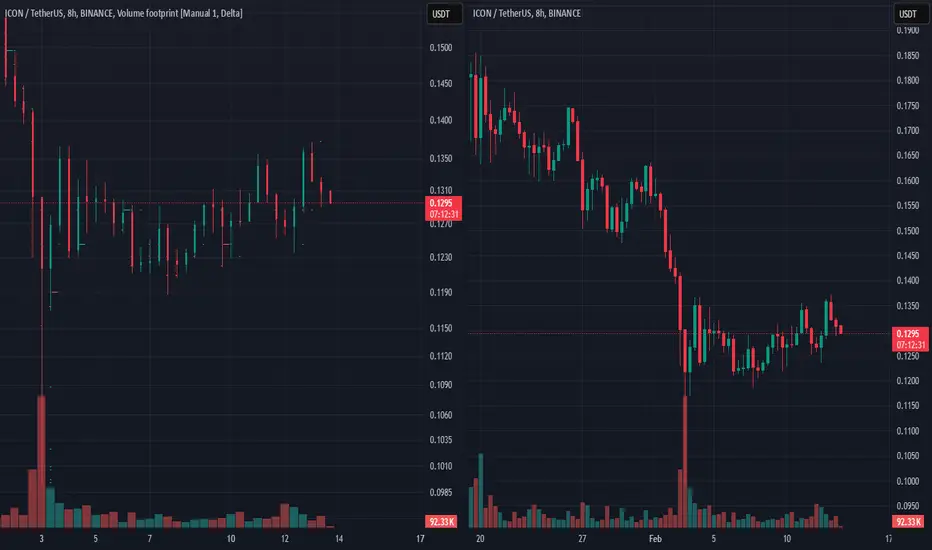
SPOT ICX LONG 13.02.2025Pinning after exhaustion of sales.
💰I enter at the market price.
🔏The trade be closed manually or with a limit order by:
0.1973
I'll let you know when I record it manually.
‼️Risk per trade: 1% of the allocated funds for spot trading.
Thank you!
See all ideas
Summarizing what the indicators are suggesting.
Oscillators
Neutral
SellBuy
Strong sellStrong buy
Strong sellSellNeutralBuyStrong buy
Oscillators
Neutral
SellBuy
Strong sellStrong buy
Strong sellSellNeutralBuyStrong buy
Summary
Neutral
SellBuy
Strong sellStrong buy
Strong sellSellNeutralBuyStrong buy
Summary
Neutral
SellBuy
Strong sellStrong buy
Strong sellSellNeutralBuyStrong buy
Summary
Neutral
SellBuy
Strong sellStrong buy
Strong sellSellNeutralBuyStrong buy
Moving Averages
Neutral
SellBuy
Strong sellStrong buy
Strong sellSellNeutralBuyStrong buy
Moving Averages
Neutral
SellBuy
Strong sellStrong buy
Strong sellSellNeutralBuyStrong buy
Displays a symbol's price movements over previous years to identify recurring trends.
Curated watchlists where ICXUSDT.P is featured.

Interoperability Crypto: Communication station
14 No. of Symbols

Smart contracts: Make the smart decision
36 No. of Symbols
See all sparks