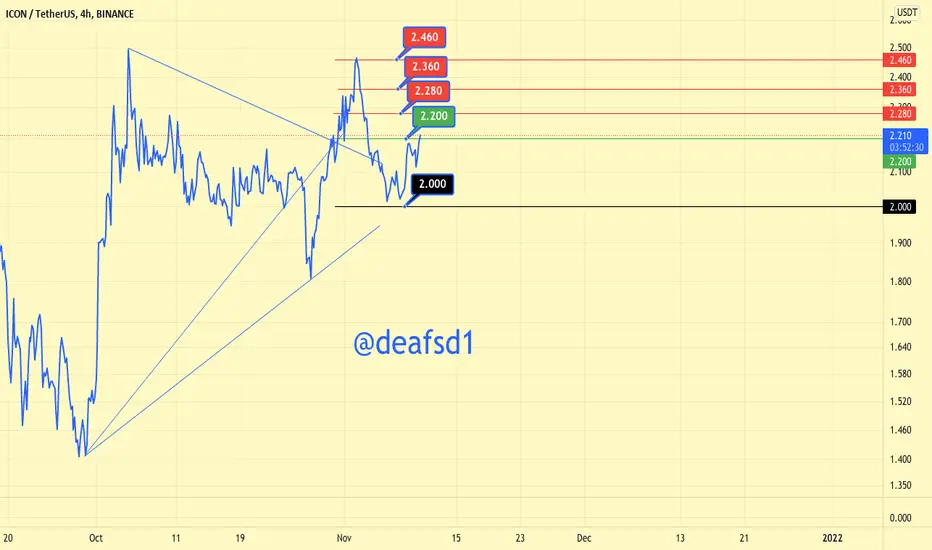
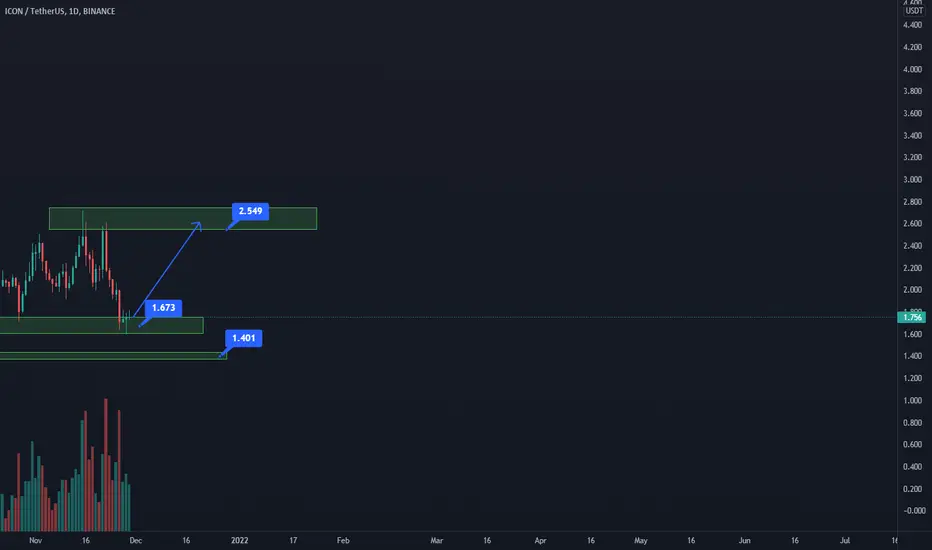
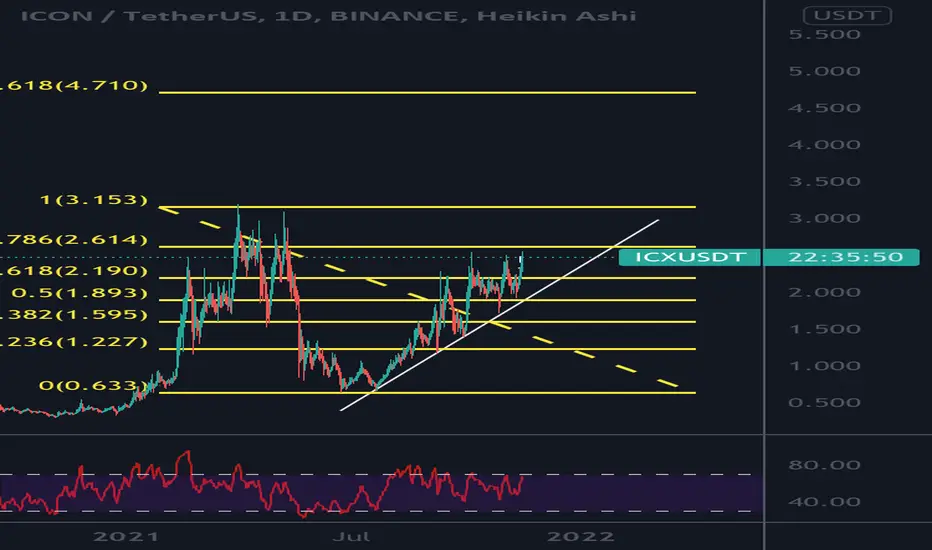
ICX/USDT TRADING PLANNING FOR SPOTICX/USDT
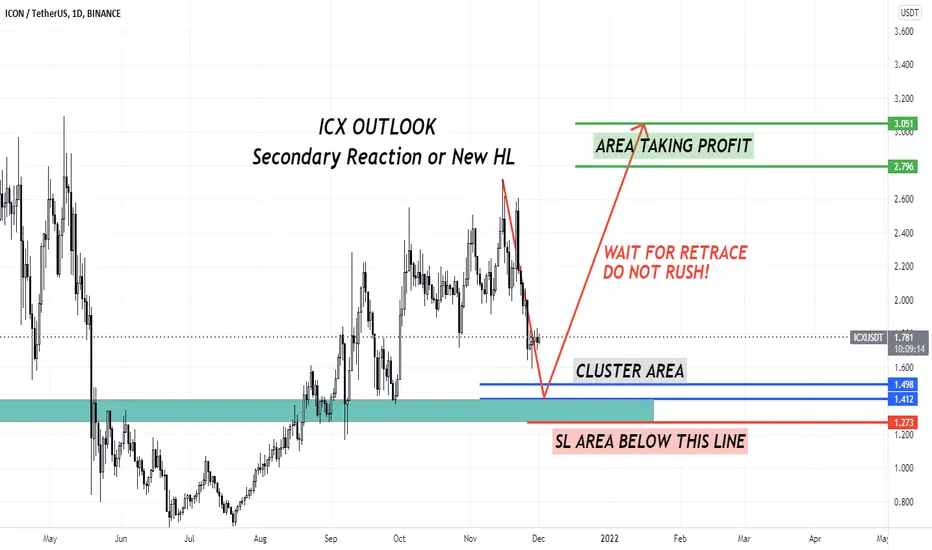
I think ICX will make secondary reaction or new Higher Low before the new primary trend
So we can also call it correction, so do not be hurry
We wait and catch it dont push yourself into trading guys!
Thanks for the support!!
#indonesia #tipsfotradingplanning
ICXUSDT.P trade ideas
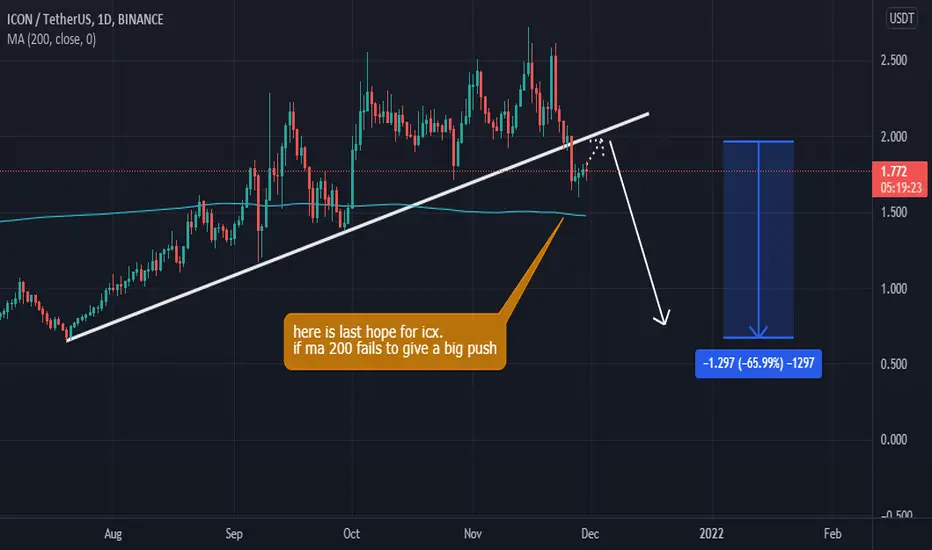
last hope for icx and i am looking 65% short postionicx is on verge of decline be ready keep your positions tight because its not a good sign it breaks its uptrend now last hope for icx is MA 200 if this time it fails no one will stop crash.
Binance: ICX buy / long 1DBinance: ICX buy / long 1D
Entry: 1,6 - 1,7
SL: 1d close below 1,4
TP: 2,5
ICON is a decentralized blockchain network focused on interoperability. With ICON’s “blockchain transmission protocol”, independent blockchains like Bitcoin and Ethereum can connect and transact with each other. This opens up cross-chain use cases that are impossible without an interoperability layer like ICON.
ICON Network describes itself as a general-purpose blockchain protocol based on the native cryptocurrency ICX that can run smart contracts, adopt the BFT-DPoS (Delegated Proof-of-Stake) consensus protocol, and use an economic-governance protocol called DPoC (Delegated Proof-of-Contribution). The ICON Network is powered by a proprietary blockchain engine called 'loopchain' and has the ability to handle hundreds of transactions per second. The ICON project was started to ensure the integrity and transparency of data shared between institutions and companies, and to move mutual assets on heterogeneous blockchains without a centralized organization. In the long term, ICON Network aims to become an 'interchain' that connects multiple blockchains based on BTP technology.
The ICON blockchain is powered by loopchain, a blockchain engine designed by ICONLOOP. ICONLOOP is responsible for loopchain’s government and enterprise adoption in South Korea. Loopchain is the Seoul Metropolitan Government’s standard blockchain platform.
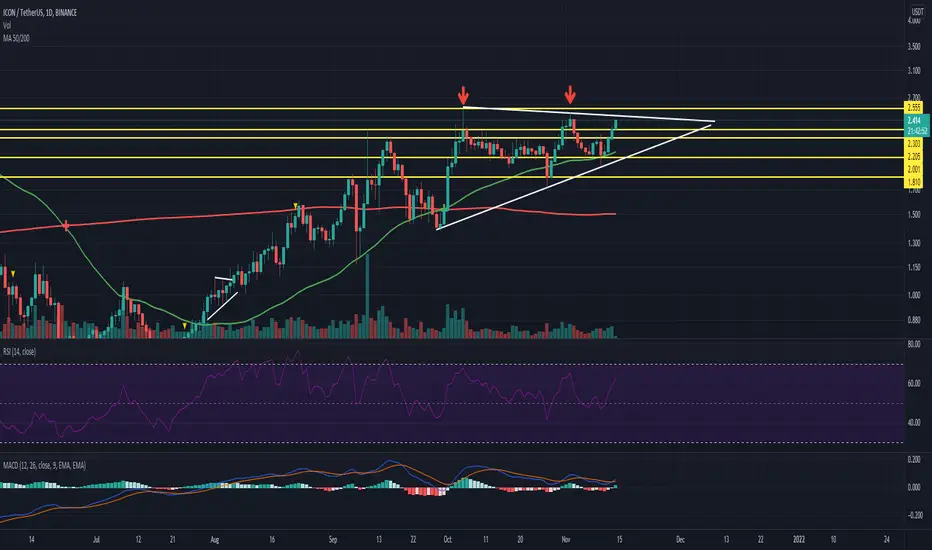
ICX found support and ready to continue its uptrend? I've been watching/ swinging ICX for the last few months as it's continued to form an ascending triangle from the May sell-off.
The most recent Black Friday discount dump put it below its long term trend line but not for long.....????
We've found support in the area around the 200ema and the .382 fib which has flipped between s/r plenty of times this year.
The #BPT #AlphaPrime has just printed a BPT Long following a recent TD9 buy and on the two occasions those two have printed in confluence this year have both resulted in 90%+ gains!!!
Add to this we've just printed a bullish butterfly harmonic on the 16hr, bullish divergence on the 4hr & 1hr and the RSI has plenty of headroom on most longer timeframes.
I'd like some more volume and a break and close above the long term trend line before I go balls deep into this but a little Monday morning YOLO with a tight stop under the 200ema/ .382 fib area is offering enough RR to get involved.
Entry $1.7057 - $1.7872
TP's $1.91/ $2.21/ $2.65


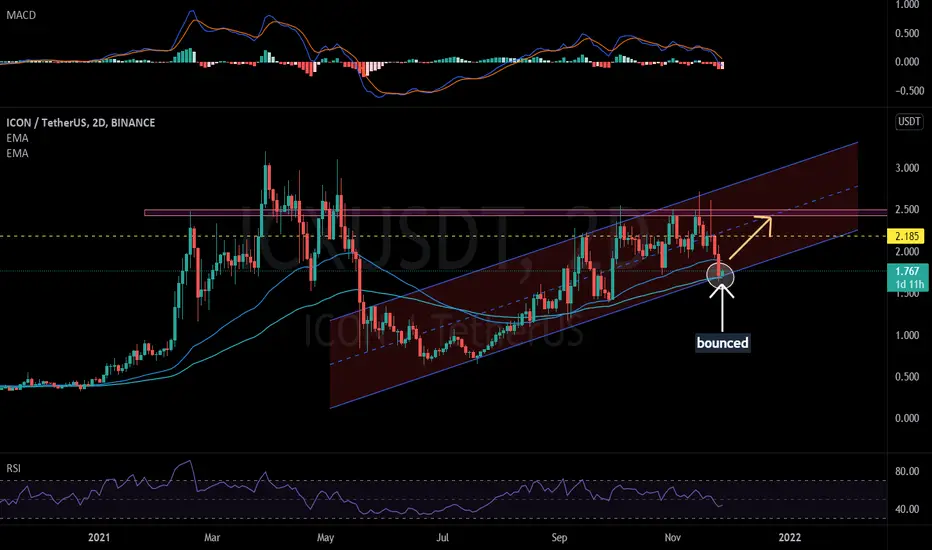
ICXUSDT 2DICX bounced off the support line of ascending channel + EMA100. Max target should be $2.50

ICX icon bullish ideaLooks like icon is following a trend you can range trade in should be an easy 10% from 2.2 good luck traders not financial advice
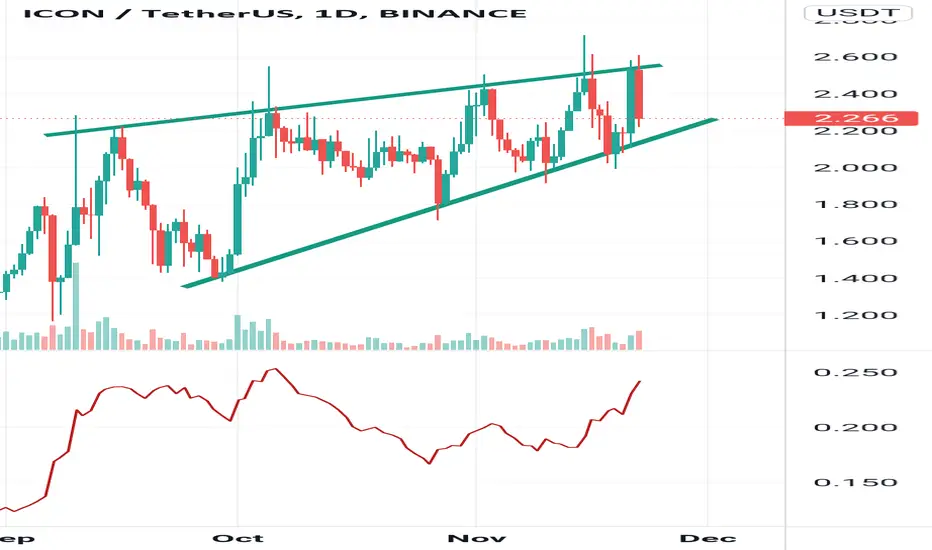
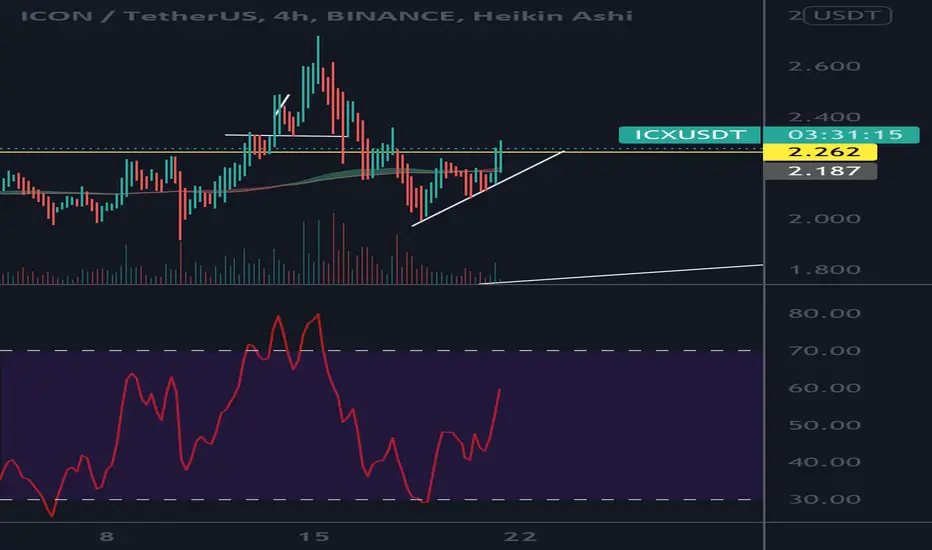
IcxBeautiful double bottom here. If we can close another 4 hour candle body above 2.26 this should be a confirmed breakout stops below 2$ for a long play. This is looking excellent
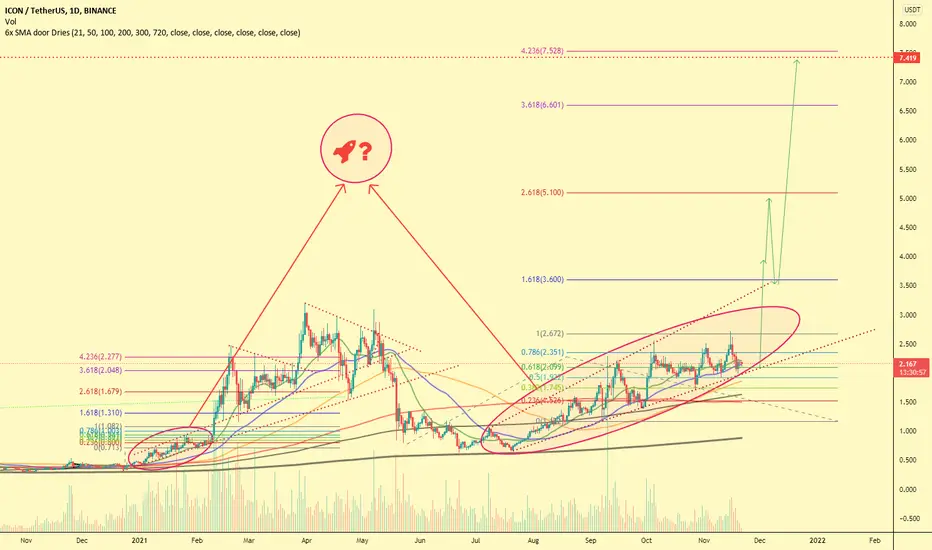
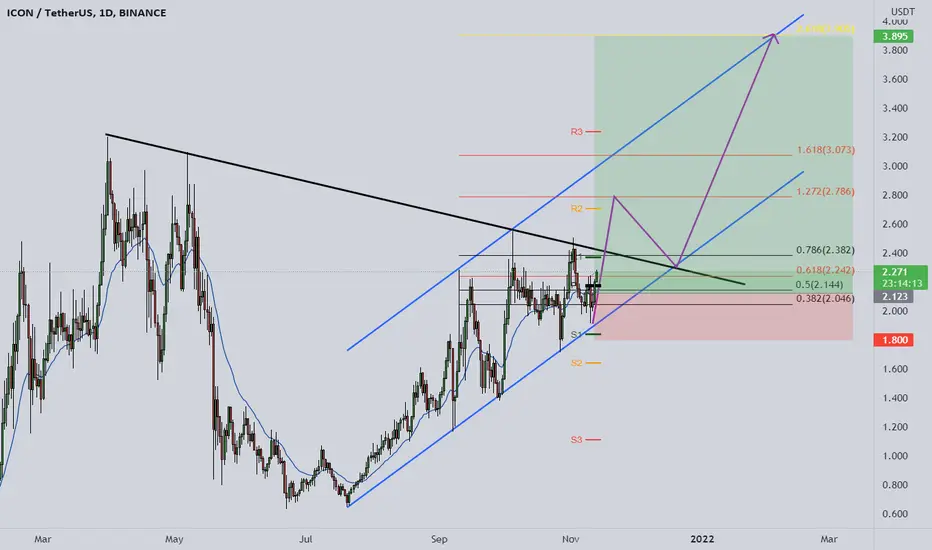
History lesson - ICX to 4.263 fibIs ICX repeating previous pump?
Historical indications are no guarantee, but when comparing the setup at the moment it looks nice.
This kind of chart pattern is what could be in store for ICX in the short term. This is just an idea, do not see this as advice.
If you do want in here, be sure to set an SL right under the bottom line of the rising wedge.
Grtz

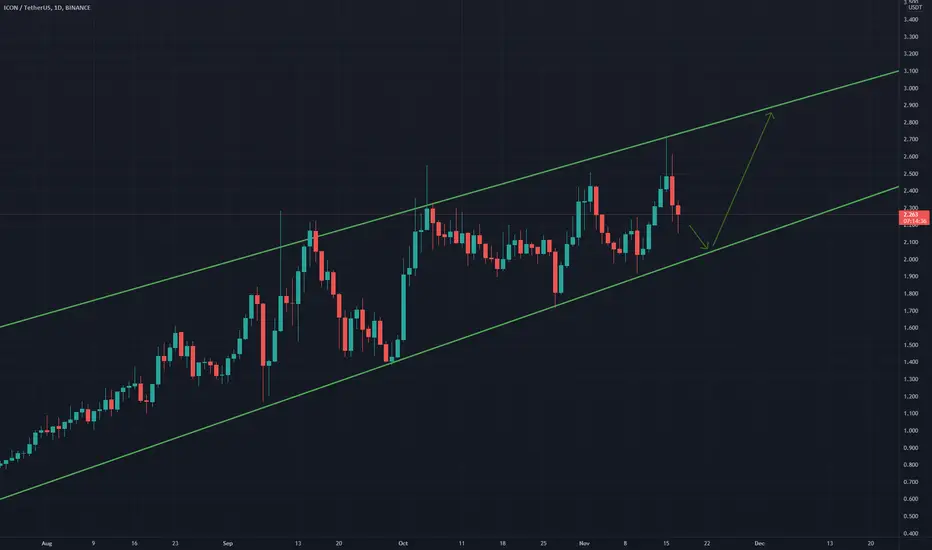
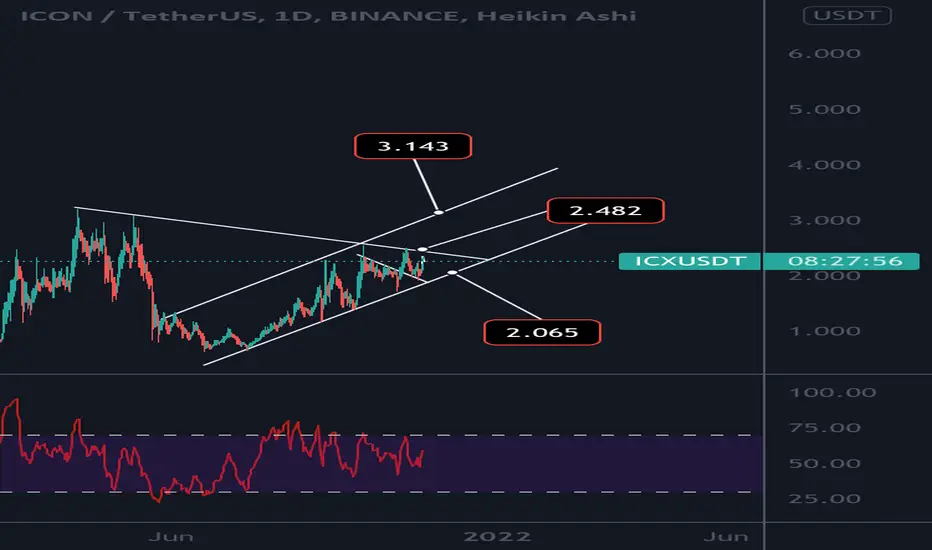
ICX longExpecting to go high after hitting the bottom at 2.08 if it doesn't break through the dynamic support.
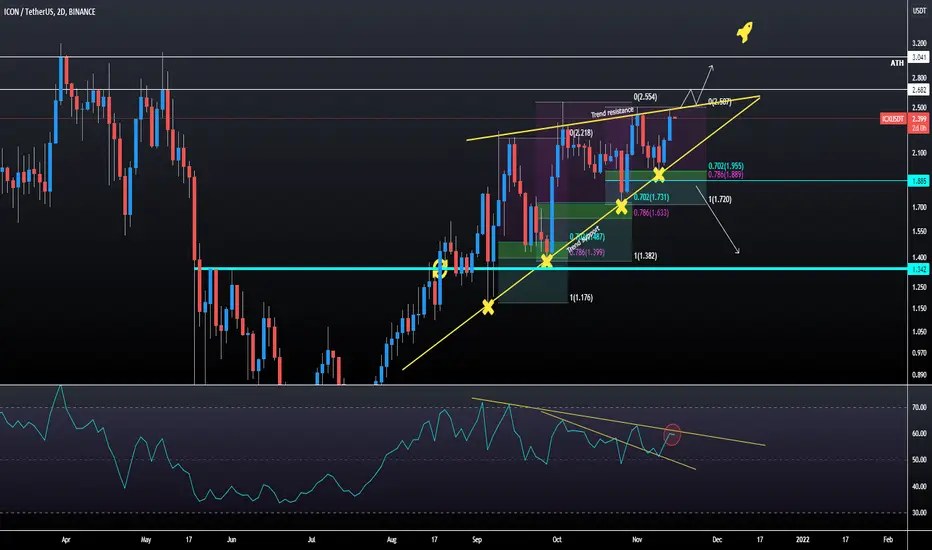
IcxNothin but ripping since I posted about it around 2.00$. We have .786 fib at 2.61. 2.55 is the previous wick high. If we can break 2.61$ And hold we should ripppp to 3.15 first target area it’s soo close to a monster move. Has been backtestinf previous reistance as new support. It’s been performing so great
ICXUSDTICX after breaking the $1.34 resistance, icx been grinding up towards April high.
While printing higher high and lower within is a rising wedge pattern, the Resistance line is yet to be validated. Every dips bouncing of 0.702-0.786 fib.
A rising wedge is formed when the price consolidates between upward sloping support and resistance lines.
Here, the slope of the support line is steeper than that of the resistance.
This indicates that higher lows are being formed faster than higher highs. This leads to a wedge-like formation, which is exactly where the chart pattern gets its name from!
With prices consolidating, we know that a big splash is coming, so we can expect a breakout to either the top or bottom.
If the rising wedge forms after an uptrend, it’s usually a bearish reversal pattern. However giving where the market is at, I’ve seen plenty of rising wedges break out upwards
ICX/USDT currently trading at $2.39
The ideal buy zone would be under 2.15$
Invalidation point = below $1.88 daily base
Potential targets 2.68 – 3.04 and moon long term
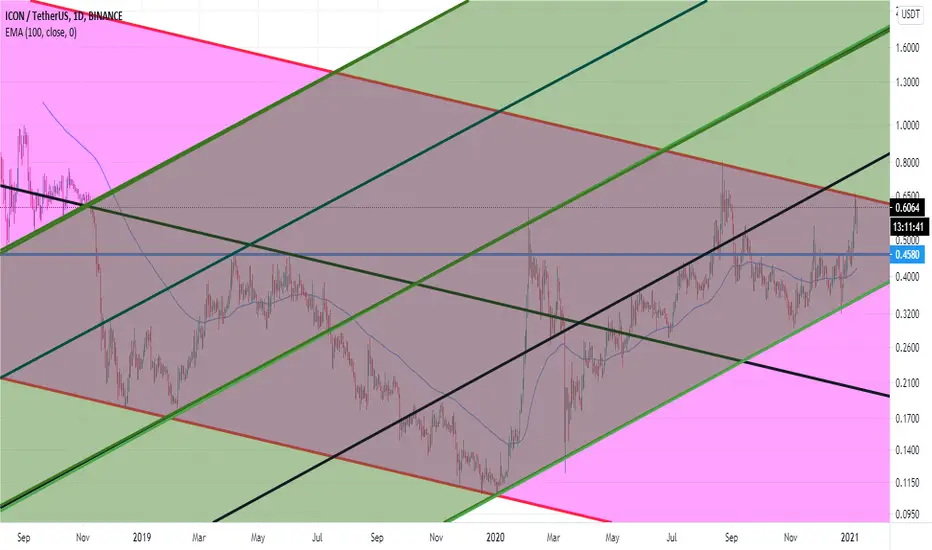
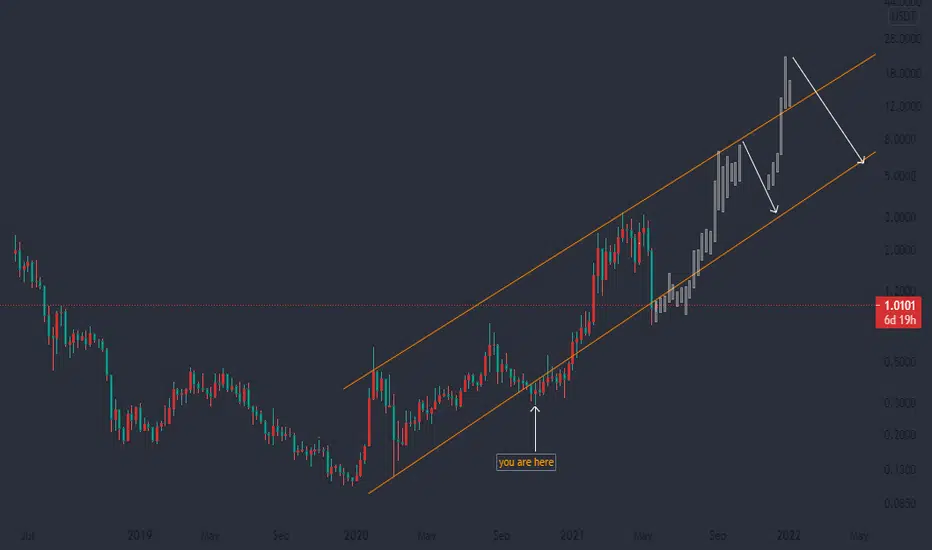
ICX/BTC
The real party start for icx is once icx flipped 0.000050k sat as support expect icx tp push towards $5+
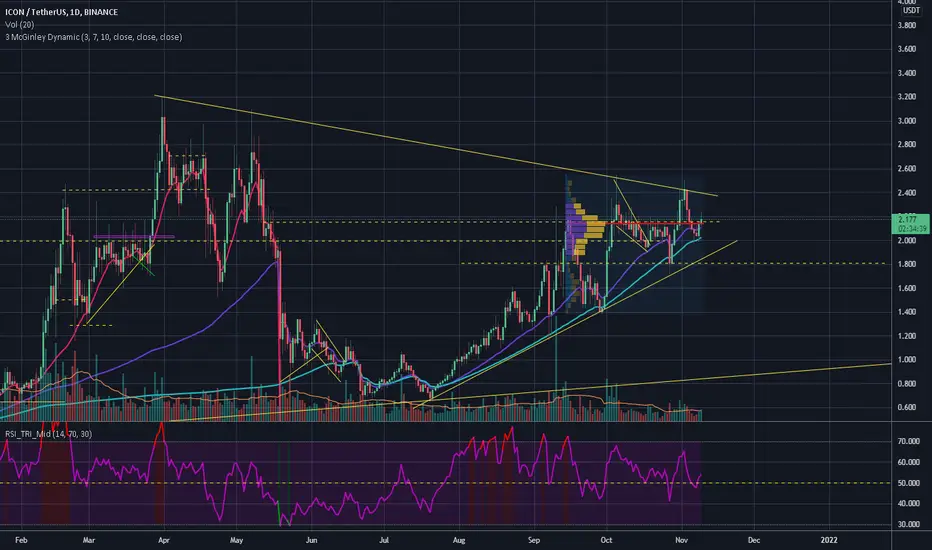
ICX might pump I had this triangle for some days but I was waiting to see if price kept going up. At the moment I think that in 3-4 days we might see some action from ICX assuming off course that BTC doesn't dump. For a move upward we need this daily candle to close over current VLPR's control line, once we breakout I expect ICX to go 2x (although this won't happen in few days). if instead we go down the triangle's bottom line is the major support, the dashed line is the second one.
I expect ICX to reach at least 2017 price before the cycle end.
Good luck
ICX ICX/usd. Support around 1.86$-2$ rang. Getting extremely tight. Upper rising Chanel reistance 3.10$. Monster ichumochi cloud indicator support around 1.98$. Stops below 1.70$ tarhet is 5$. Break 2.50 cpuld see a big move. Would be worth risk to reward on this as long as we don’t lose 1.70s
ICX-USDT LONG/BUYMulti-time Frame Analysis.
Entry=2.12-2.24, SL=1.8, TP1=2.78, TP2=3.07, TP3=3.9. R/R=5.5
Good luck with your trading !
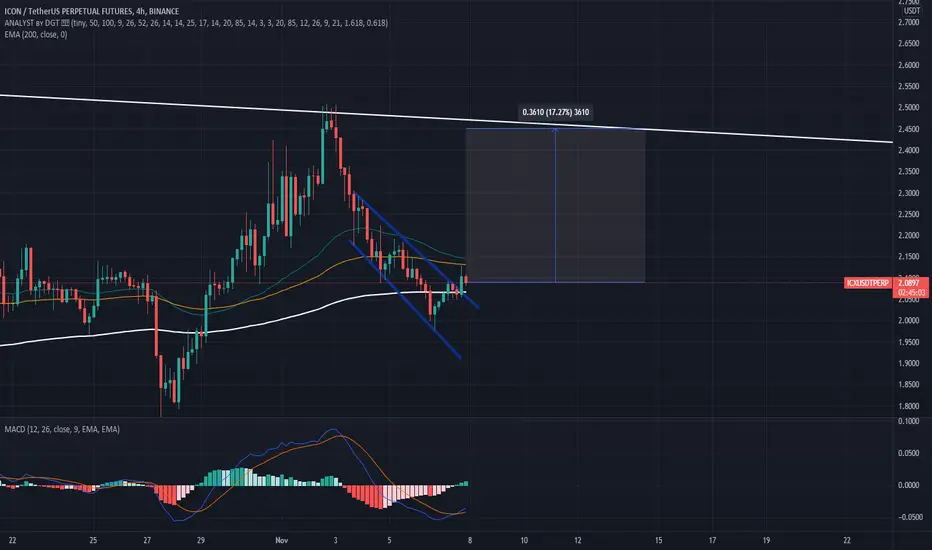
ICSUSDTPREP 4H LONG SETUPFinally ICX breakout from the bullish flag and it will go high. Buy it and hold for some days.
BUY SETUP:
BELOW 2.09
SELL SETUP:
TARGET 1: 2.15
TARGET 2: 2.25
TARGET 3: 2.4
STOP LOSS: 2.00
GET READY GUYS...YOU WILL GOOD PROFIT.
LIKE IT WILL BE MUCH APPRECIATED...