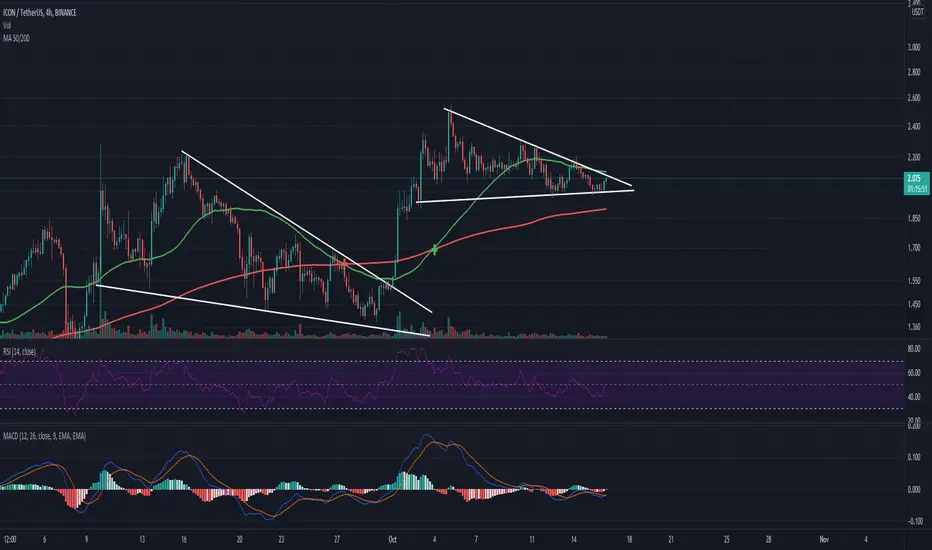
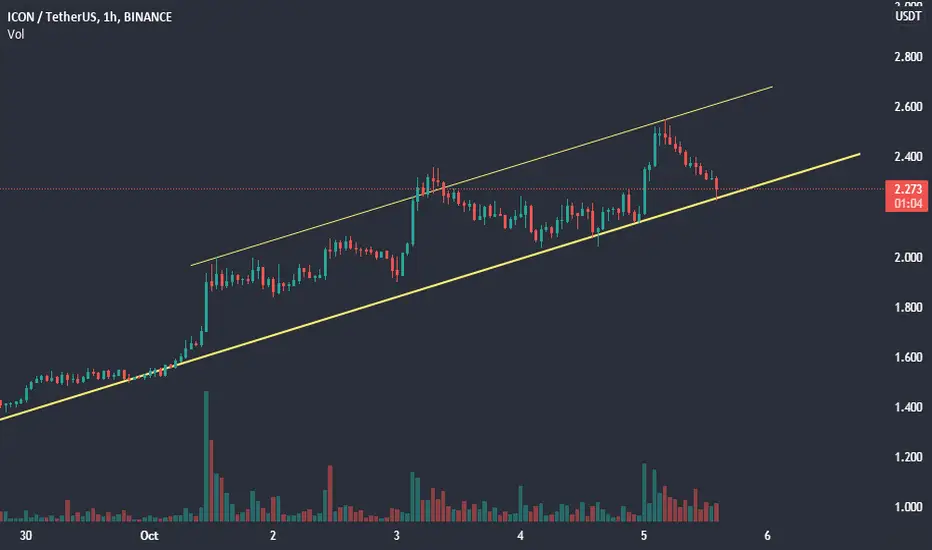
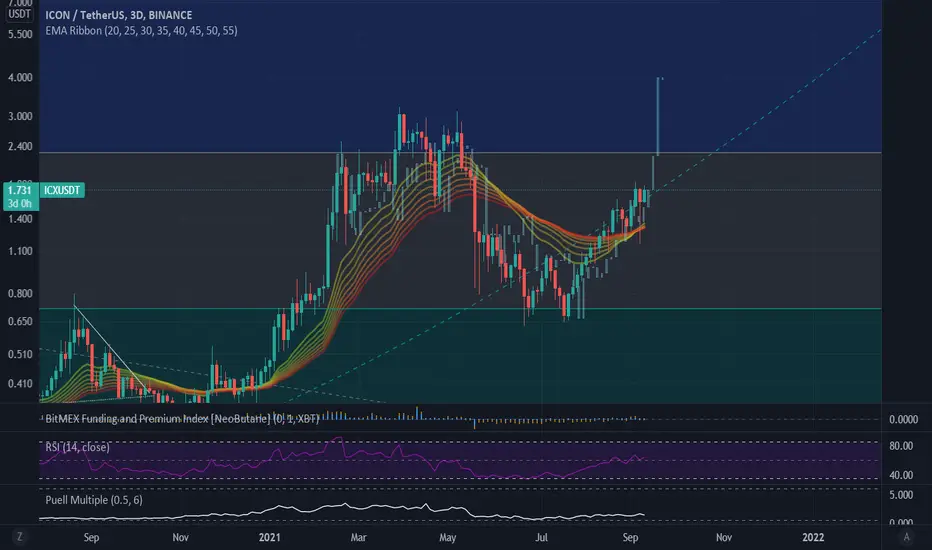
ICX UpdateLooking for more volume with ICX here as is ready to finally break out of this long term wedge formation, testing resistance now however volume is the issue. Keep an eye on this.
ICXUSDT.P trade ideas
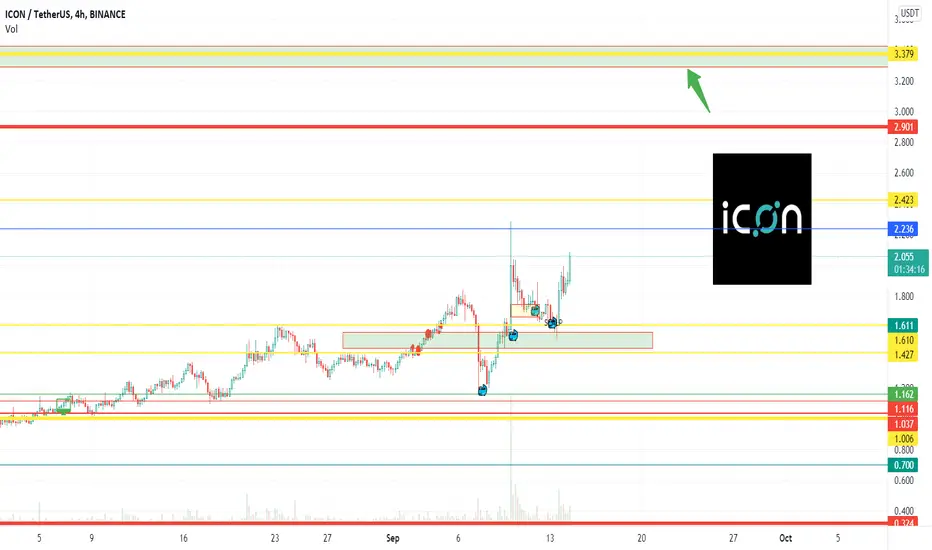
ICX/USDTICX closing daily candle above 2.3 will call the range of 2.9-3. Stop loss should be daily closing below 2

Perfect Entry Strategy - Bullish Engulfing in Key LevelsHello everyone, you are here to read about one of my best crypto-tested entry strategies, Bullish Engulfing in Key Levels . It’s a price action strategy and I’m going to explain its details but, even if you are not good at price action stuff, you could use it as well as I can. There are no requirements for dealing with this strategy except using two indicators.
The base success rate of this strategy was over 60% for me and by applying some filters and considering some best practices and being experienced in it, I could increase its success rate up to 76%.
This strategy is a combination of a Bullish engulfing candlestick pattern, pivot points, and key levels. By key level, I mean a trend line or a horizontal resistance/support line drawn by you or your added indicator. We can assume the base requirement of the strategy meet if a Bullish Engulfing (BE) pattern takes place near a key level or a pivot point.
We will use the Trend Key Point indicator to draw horizontal key levels and key points. It marks pivot points with a sign above and below the candles. If the pivot point is important, the indicator will draw a horizontal line as a key level. In this strategy the LL pivots are important to us. All necessary details will be applied to your chart by adding the indicator to it. You can also read more about Trend Key Point guide and best practices here .
There is also an indicator for finding and highlighting Bullish Engulfing patterns called Common Candlestick Patterns . By adding the indicator, you will see too many highlighted patterns because there are active by default. Therefore, after adding the indicator to your chart, you need to open its options and uncheck all except the Show Bullish Engulfing one to highlight just Bullish Engulfing patterns.
After adding indicators, you need to wait and capture entry points in a suitable state. But there are some tips and best practices we need to jot down to distinguish between good and bad states and increase the success rate of the strategy. I list below:
Ignore a BE pattern that does not occur at a key level or is far from key levels.
It’s a good sign if the BE pattern occurs on an LL pivot point (a candle that has a star under it) which meets a key level.
BE pattern must have an acceptable and strong body. You can ignore weak candles.
Ignore the BE pattern formed just below a resistance or potential reversal area.
It excites me to see a BE pattern at the lower point of the price but a BE at the end of correction sounds good too.
If the BE pattern occurs on the LL pivot seeing a key level and the volume also confirms that by crossing the VMA20 (volume moving average length 20), you can enter definitively.
If the entry requirements are met, the closing price of the BE pattern will be my entry point.
Do not enter if the green candle of the BE pattern is abnormally big. You can wait for a pullback or you can ignore the pattern.
BE pattern in the bottom of a range box could also be a good chance to enter but you have to be careful where the range is.
As you read before, this article is about finding the entry point and after clarifying that it's time to find out where you need to put your stop loss and your take profit but, these topics not fit in this article. You can refer to the other available resources covering these topics.
Both of the indicators mentioned are developed by myself, so I tried to apply my best practices to them. I hope it was useful for you. Feel free to submit your comment to improve the strategy or the indicators.

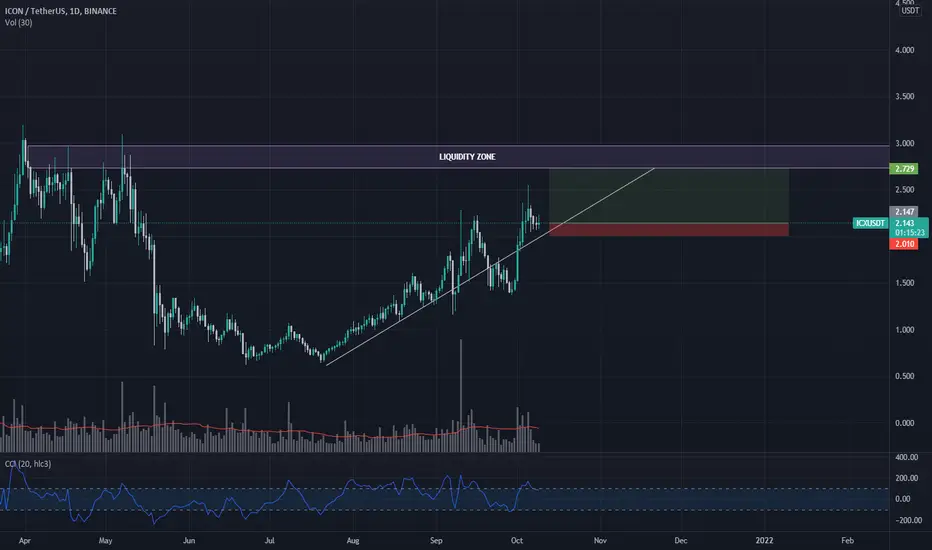
ICX main net launchICX have made a massive pivot this bull market and have scheduled in there main net launch towards the end of this month.
Its been trending nicely since august apart from a drop down at the end of September but has reclaimed that trend again since bitcoin made a come back.
Looking at targeting the liquidity zone around 2.7 before the end of the month, although if it drops off pace closer to the end of the month I will bail, looking for fast price action here with the hype
ICXUSDT What's up guys!
I'm looking for a good buy setup as price has been respecting a major support and demand zone
looking for price to break the previous high and a beautiful cross of the EMA 14 over the EMA 50 !
what do you guys feel ?
ICXUSDTit i gonna touch the end end of channel with a long shadow and good position to enter and move uptrend to 2.6$.
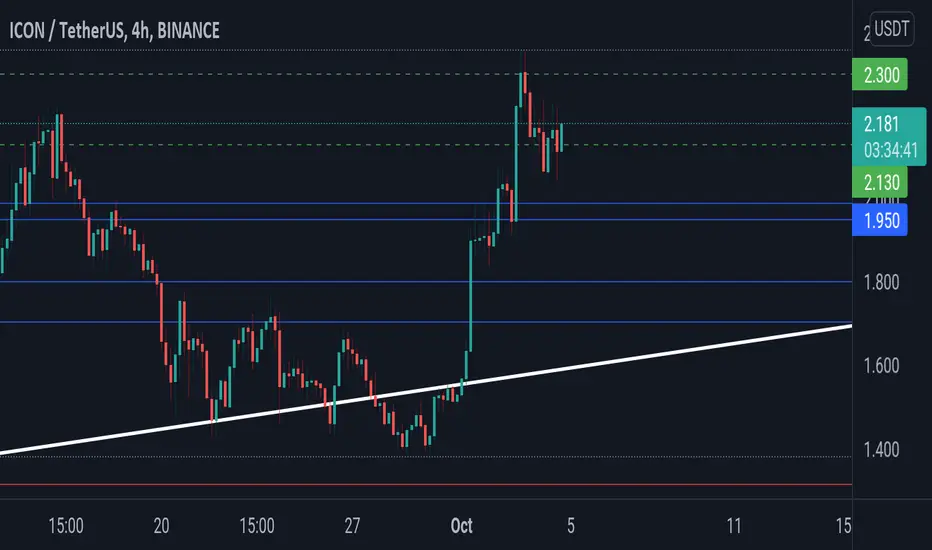
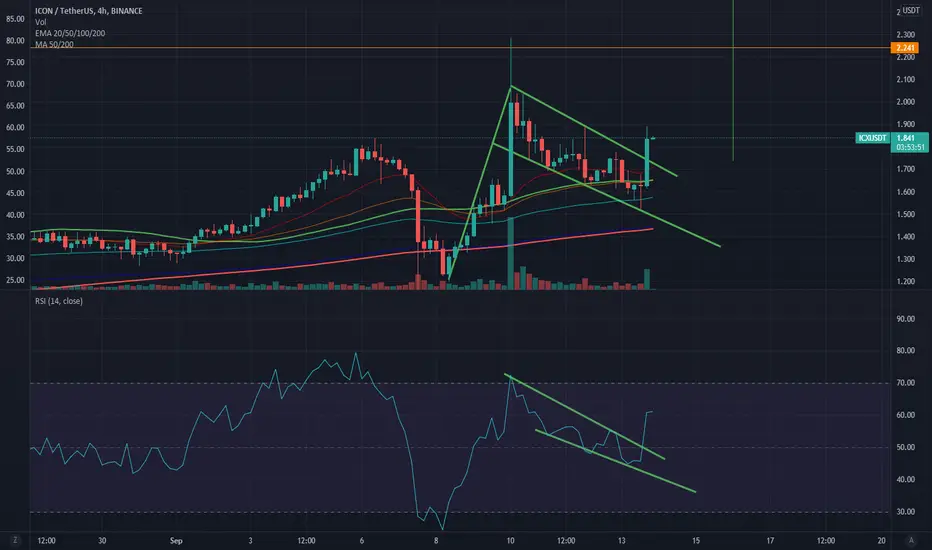
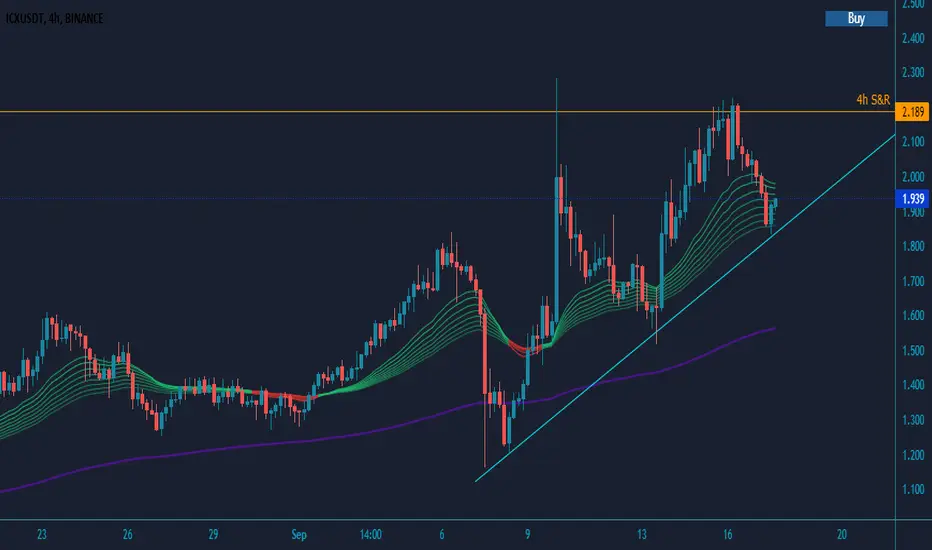
ICXUSDT is testing the 4h resistance 🦐ICXUSDT is testing the 4h resistance after the breakout from the descending channel.
IF the price is going to have a breakout, According to Plancton's strategy (check our Academy), we can set a nice order
–––––
Follow the Shrimp 🦐
Keep in mind.
🟣 Purple structure -> Monthly structure.
🔴 Red structure -> Weekly structure.
🔵 Blue structure -> Daily structure.
🟡 Yellow structure -> 4h structure.
⚫️ Black structure -> <4h structure.
Here is the Plancton0618 technical analysis, please comment below if you have any question.
The ENTRY in the market will be taken only if the condition of the Plancton0618 strategy will trigger.

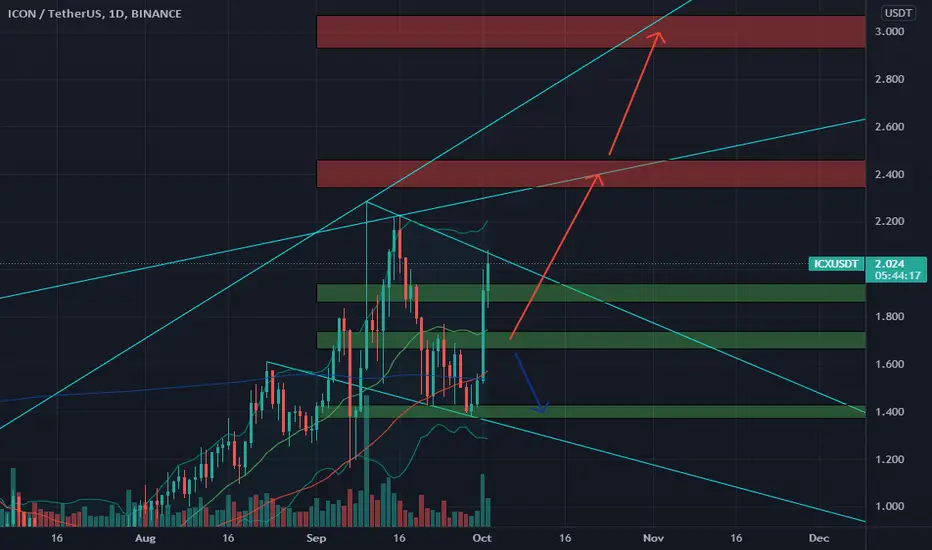
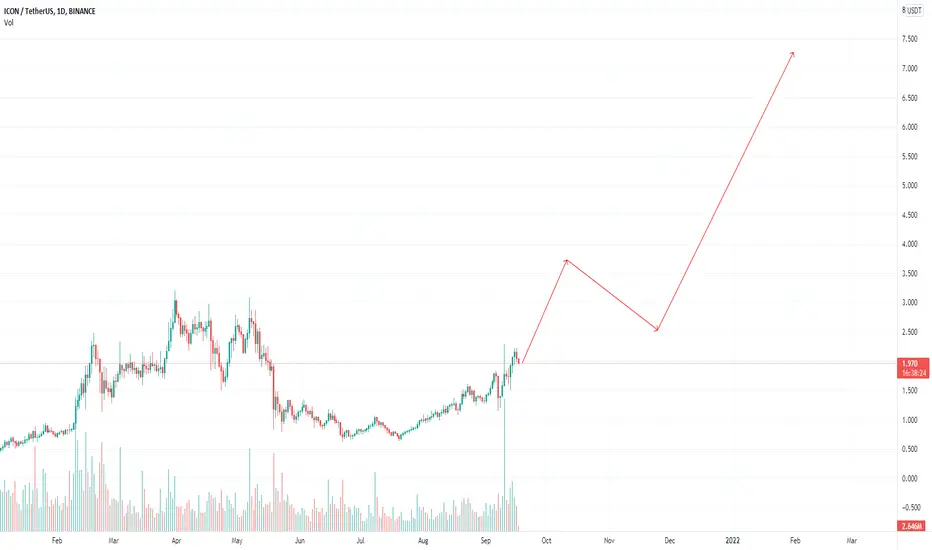
🆓ICON (ICX) Oct-2 #ICX $ICXICX has been pumping too strong for 2 days, so it would take us some days before making another pumps up to 2.4$ and 3$ zones in October. We will keep accumulating ICX because it is very potential in future. But if it loses the 1.7$ zone, it will fall down to at least 1.4$ zone
📈RED PLAN
♻️Condition : If 1-Day closes ABOVE 1.7$ zone
🔴Buy : 1.9 - 1.7
🔴Sell : 2.4 - 3
📉BLUE PLAN
♻️Condition : If 1-Day closes BELOW 1.7$ zone
🔵Sell : 1.7
🔵Buy : 1.4
❓Details
🚫Stoploss for Long : 10%
🚫Stoploss for Short : 5%
📈Red Arrow : Main Direction as RED PLAN
📉Blue Arrow : Back-Up Direction as BLUE PLAN
🟩Green zone : Support zone as BUY section
🟥Red zone : Resistance zone as SELL section
🅰️A : The Close price of 1-day candlestick is Above the zone
🅱️B : The Close price of 1-day candlestick is Below the zone
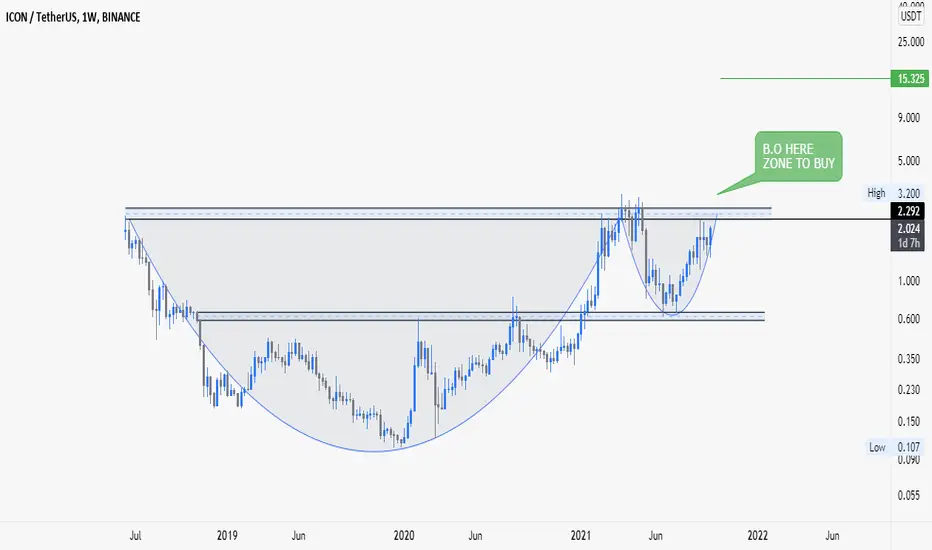
#ICXUSDThello guys
i have this opinion about icx (icon)
as you see we have a pattern (cup and handle )
so wait to breakout this zone and pattern
after we can buy at new zone to new high
with the hope of profit for everyone
put your stop lose at 1.35 if you are trading
ICX ALGO FractalAlgorand fractal that I thought looked similar to the current icx price action. Essentially hopium, send this shitcoin to $3-4.
ICXUSDT - Trend AnalysisICXUSDT - Trend Analysis
Fibonacci
Timeframe: Daily
Target: $9 Based on 0.382 Fibonacci
ICON / TETHERUS#ICX
Rebounded from a strong support area
It is forming a double bottom reversal pattern
Entry/ 1.6
Objectives/Illustrated
profit / 2.22
stop loss/ 1.4

ICXUSD - keep an eye on itKeep an eye on ICX. The last pump was huge.
Is the breakout coming from the red zone?
Support at 21-EMA-Weekly: 1,4 USD
Just an idea.
ICX reached the support of broadening wedge with hidden bullish ICX reached the support of broadening wedge with hidden bullish divergence
ICXUSDT Long Trade Idea BINANCE:ICXUSDT [/symbol;
ICXUSDT looking good for a trade to the upside after 50% Fibonacci Retracement took place and rejected S&R Levels by Respecting the Trendline
Target 2.180
*Please take note this is not Financial Advice and is Intended for Educational Purposes Only!
ICX - THE SLEEPING GIANT COULD GET UNEXPECTED WHALE INCREASEHello trading friends,
Also with this small breakdown trend, ICX is very interesting, and we have seen before how it did recovery from 1 USD + to a huge trend. - there are still interesting targets on it, also if BTC breakdown, we expect that ICX will come huge back, also with the new trends that are coming.
✅ICX trends show still Target of 3 USD + coming time.
A whale increase of 44%+ could make a good change into the trend of ICX - coming days are important for ICX.
Have a great day.

Icx/usdt long tempIcx/usdt long temp
Entry: 1.945
Stoploss: 1.52
Take Profit 1: 3.7
Take Profit2: 7.2
ICXafter many months of correction it appears that ICX has begun to push into 5 wave impulsive move higher. I expect a nice run here above $3 soon.

ICX NEED NEW 44%+ TO INCREASE TO TARGETHello trading friends,
This is a trend price update for ICX.
WE need a new whale increase with 44%+ then we have hit the Trend Target of ICX.
✅In the best trend, ICX could hit the 3.37+

ICX - ABOVE 2 USD AND ON WAY TO OUR MAIN TARGETHello trading friends,
ICX is above 2 USD and on way to our main target.
Since 1.34 and we update about ICX increase, because of more details.
- Know that crypto is really risky, and you should have a goal and target, sometimes there are manipulations on-trend, but as long you trade with Spot for hodl you are on a good way.
Have a great day.!
LOOK AT MY PREVIOUS CHART!!!!Hello to my ICX FAM! I hope everywhere you are, you made a good profit. Just look at my previous ICX chart, you will see the day i was expecting to ICX going higher. RSI og MACD is look very good way to the moon. We are closer to our first target over $4 and I'm taking profit later at $120. What do you think?

Icon (ICX) possible breakout with the target of 3.3$ICX just went above the flag. If btc behaves there is a posibility ICX might reach 3.3$