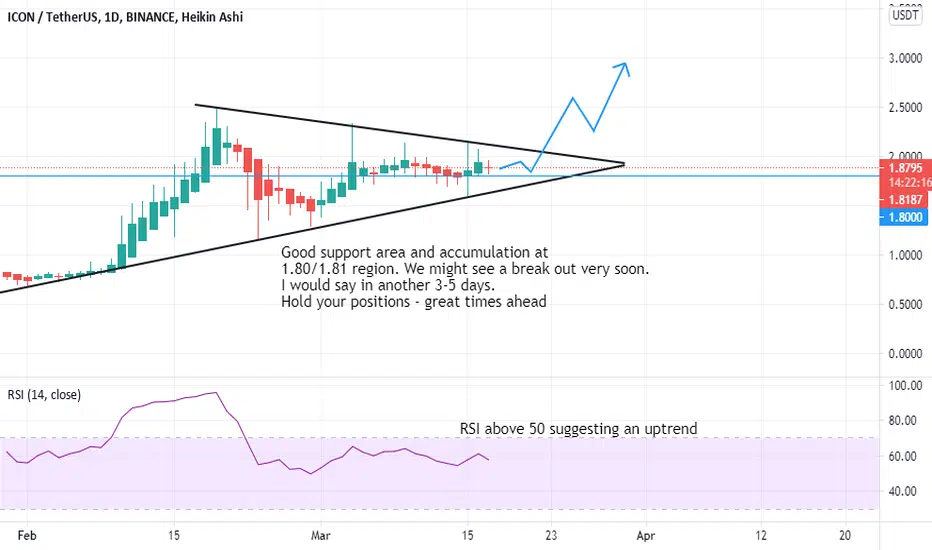
Up Trend Flag, get in before its too lateEverything is explained in the chart
what an amazing ART !!
Im in
GooD luck guys
ICXUSDT.P trade ideas

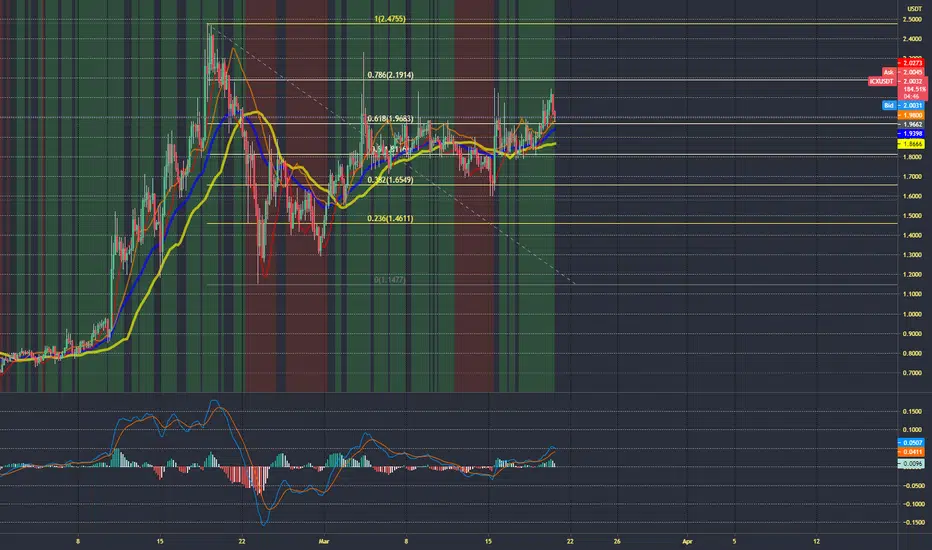
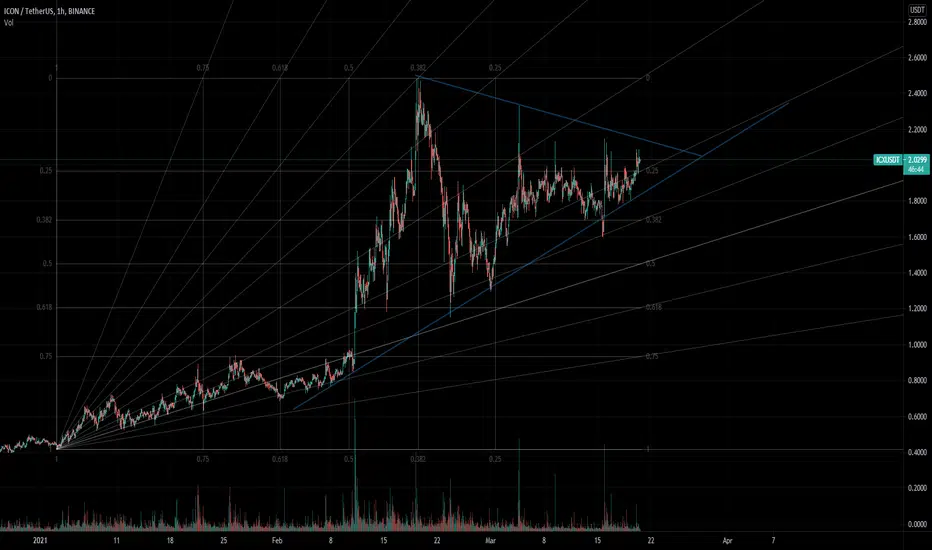
Ascending asymetrical triangle ICX has already tested the triangle resistance several times, the chart pattern shows we're into a trend of lower highs and eventually I think price will break out. As you can see there was a fake one but I'm convinced that this triangle will go up, even because ICXBTC pairs is into another kind of triangle but always a bullish one.
The fact that there was a double bottom below the 0.618 Fib level makes me think that the retracement is over and now we're into another leg up. Off course this is valid only if BTC doesn't go crazy.
To be totally sure the breakout has happened check and see if the price goes over past high. South Korean government is still using this blockchain and now is expanding it's use so I expect ICX value to reach and probably go over his own ATH of 2018
ICX - Ready to break upside or down ?ICX is at the verge and is ready to break, Keep an eye based on that a long or short can be opened.
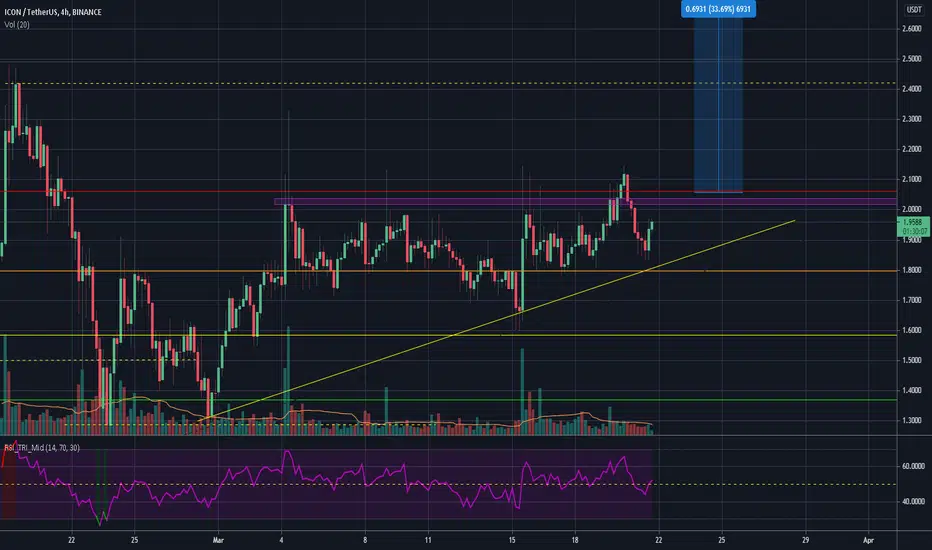
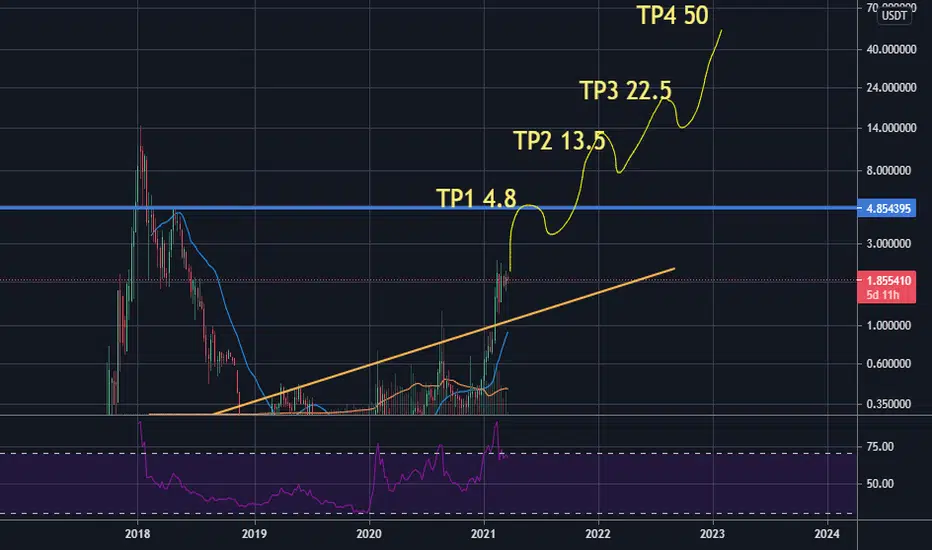
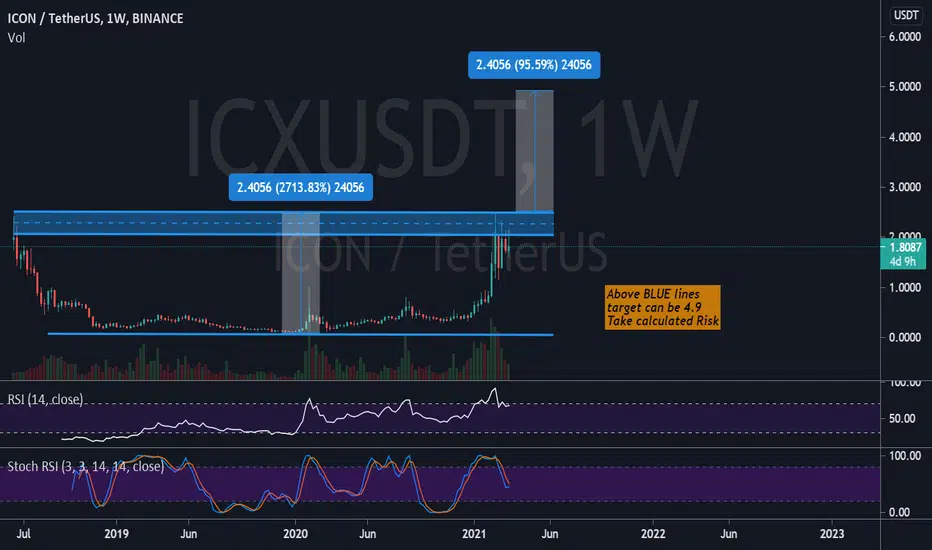
ICX huge movment after $2.5The party will start above $2.5.
The target on the chart.
A lot of good nwes will come this week and the next week.
Be ready
ICX Potential Long!Hi,
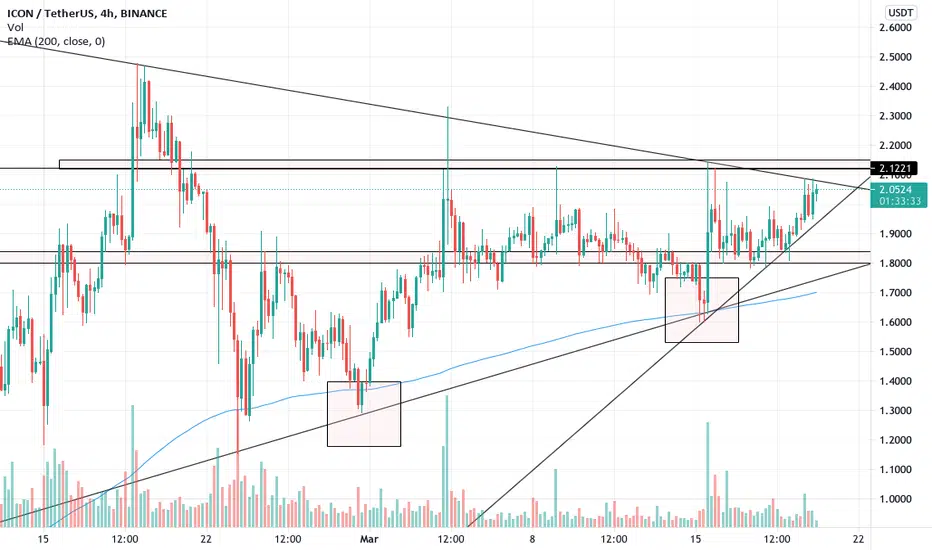
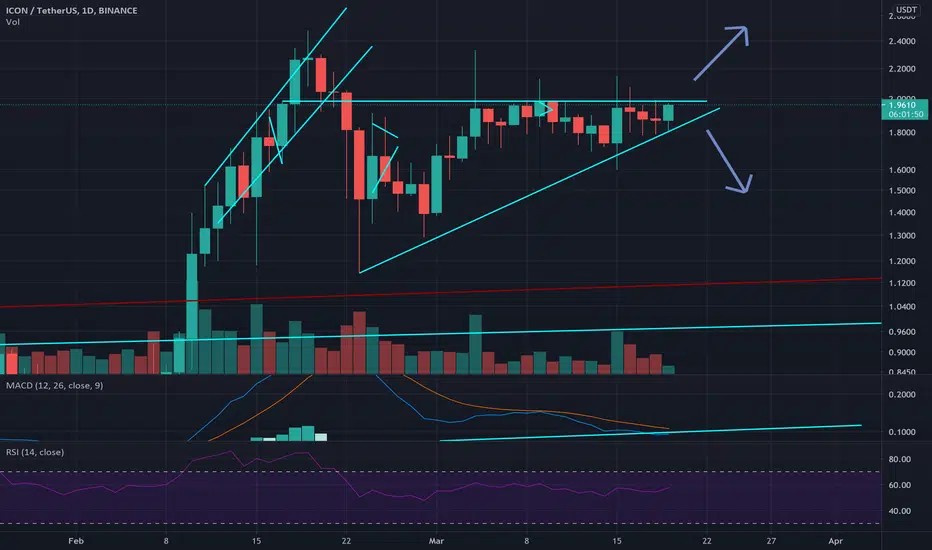
I believe that ICX is on the verge of a breakout in the coming days! I am waiting for the daily MACD to cross and the triangular breakout to the upside to be confirmed. So far its looking quite bullish consolidating in its triangle in the 4hrly, 1hrly and daily timeframes. This might be due to the potential reversal from BTC.
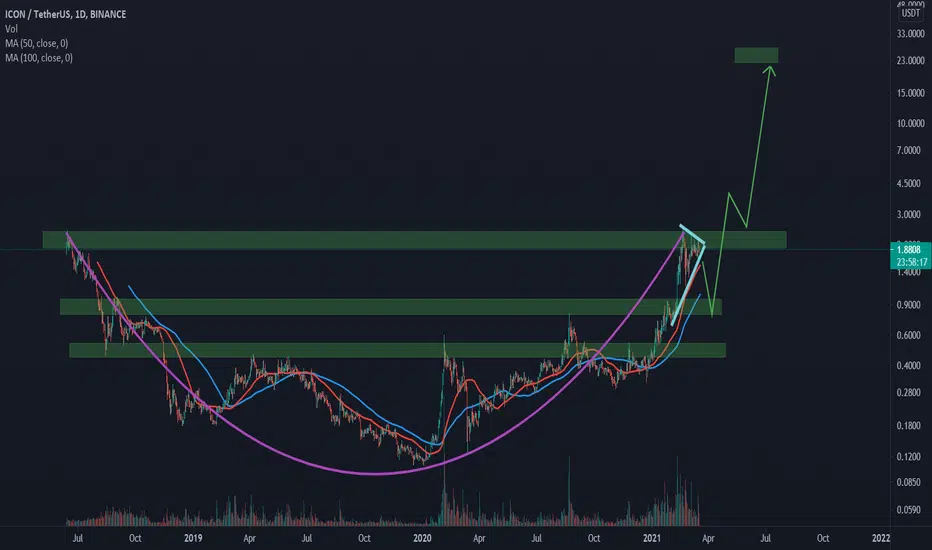
Icon ICXUSDT - Head and Shoulders + Symmetrical triangle- Icon (ICX) Rank 77 on coinmarketcap is increasing every week.
- South Korea government use ICON coin as enterprise adoption and solutions.
- Market Cap $1,166,202,128 ### 24h volume $101,688,807 ### Max Supply: Infinite.
- The price is above the HaS neckline and currently forming symmetrical triangle - bullish continuation pattern.
- Expected duration of the trade, probability, stop loss, profit target, entry price and risk to reward ratio (RRR) - For more information, please check my signature below ↓
- 3th Elliott impulse wave is now in progress, we do not really know, how strong the 3rd wave is going to be.
- Profit target is below ATH level, but of course, after a retracement - I am expecting new all time highs!
- If you want to see more of these ideas, hit "Like" & "Follow"!

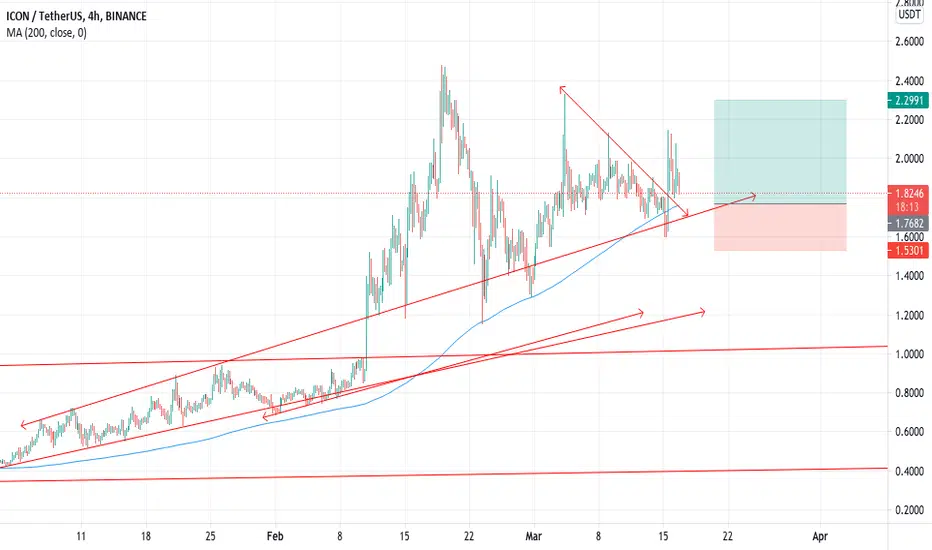
ICX close above descending line?Feeling quite good about my entry at 1.8, will be adding more if retest and continues.

ICX About to BreakoutICX will have a balanced DeFi launch on the end of March, this fundamental may drive the technical to a breakout and a possible surge to the upside:)
See you guys on the end of March:)

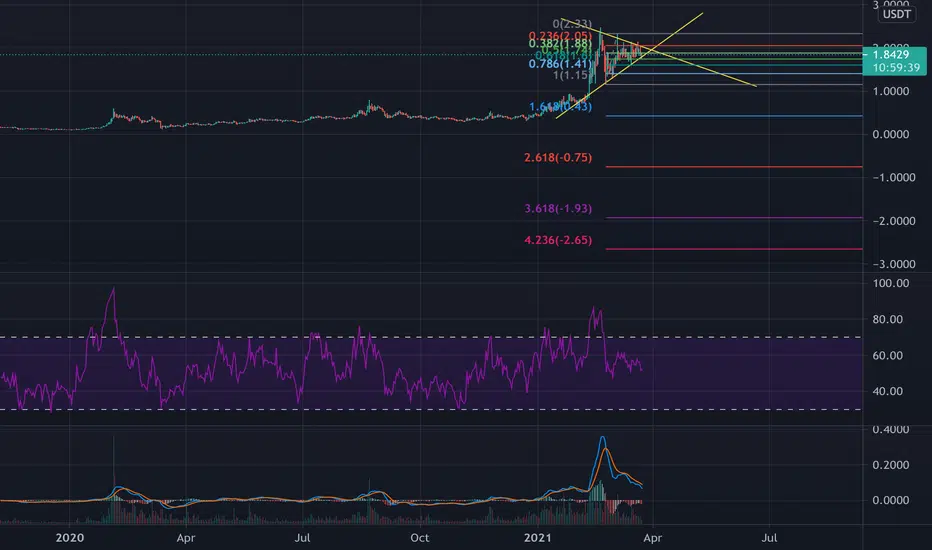
ICON (ICX) Touching Support. Ready to launch or will it fall? We are touching and testing the 38% fib + monthly structural zone. If and only if the area is treated as support with confirmation buy otherwise see a fall to he 78% zone. The targets are based on fib extensions and have 100% - 500% return target points.

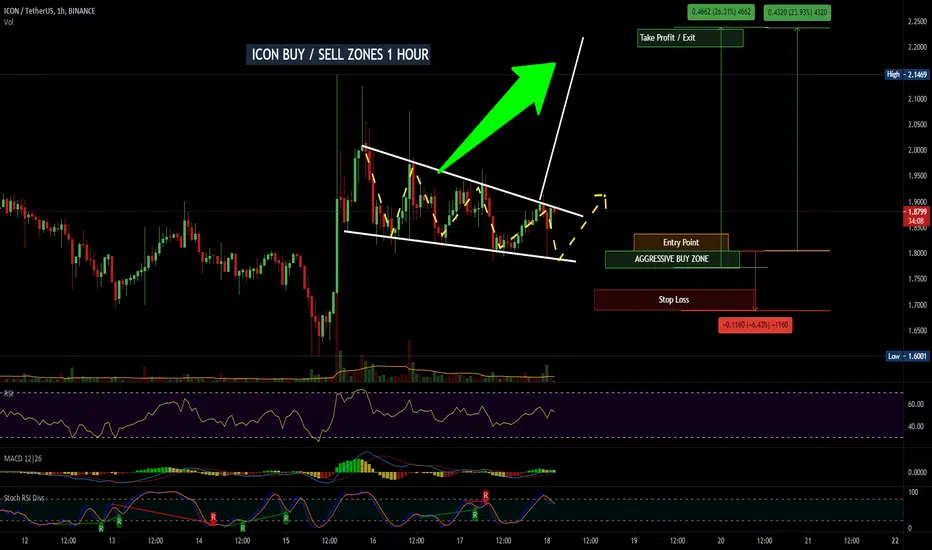
ICON BUY / SELL ZONES 1 HOUR ICON BUY / SELL ZONES 1 HOUR
Forget #DOGE #DOGECOIN Try #icon add us to your like / watch list
We hope you find our charts of use, please hit the like button if you found this chart useful.
Safe trading everyone
Original chart in the related ideas below.
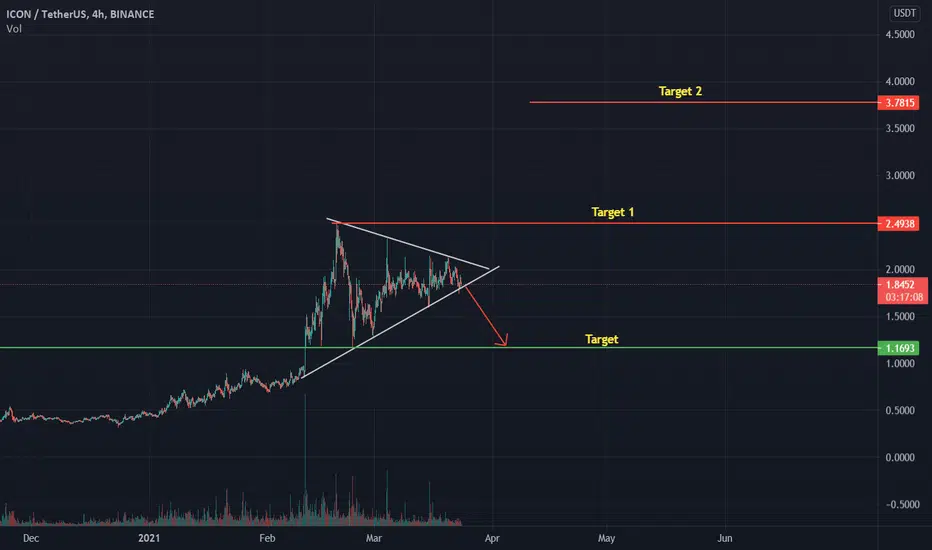
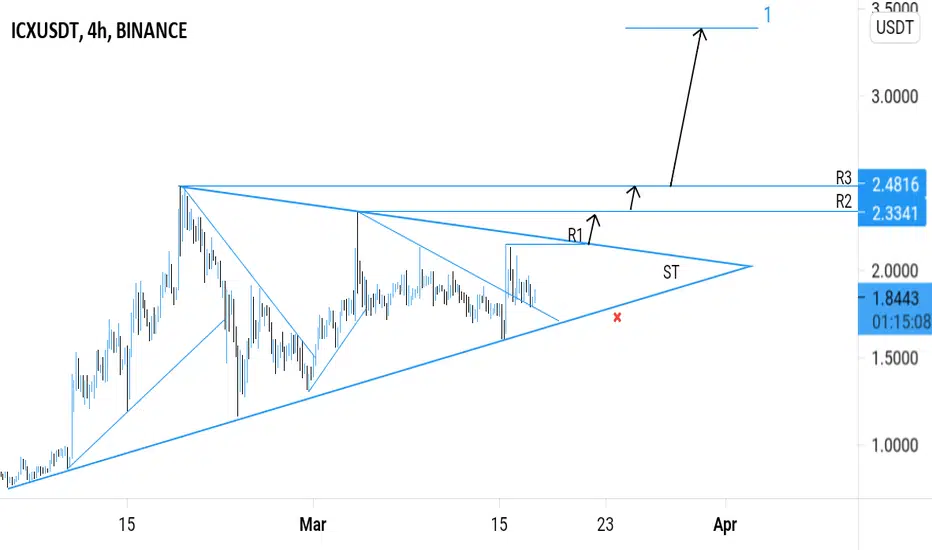
ICXUSDT (ICON) - POTENTIAL BREAKOUT ANALYSIS 🔎
- ICXUSDT is consolidating in a symmetrical triangle (ST) pattern .
- A relatively big move is imminent.
- There's a breakout potential.
BUY ENTRY ⬆️
- Conservative entry : breakout above the symmetrical triangle's inclined resistancenamd horizontal resistance level (R1).
- Aggressive entry : market price.
TARGETS 🎯
- Horizontal resistance level (R2).
- Horizontal resistance level (R3).
- Fibonacci extension levels.
SETUP INVALIDATION ❌
- Breakdown below the symmetrical triangle's inclined support.
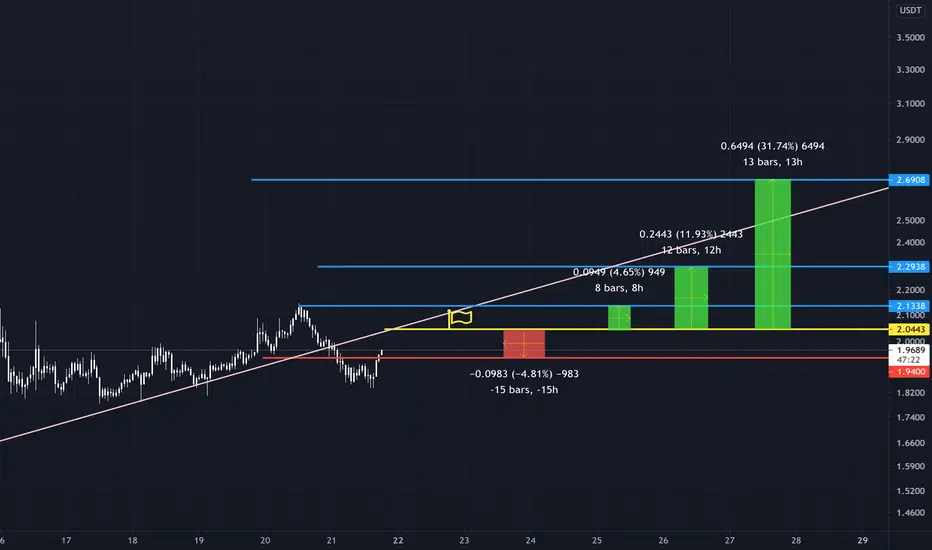
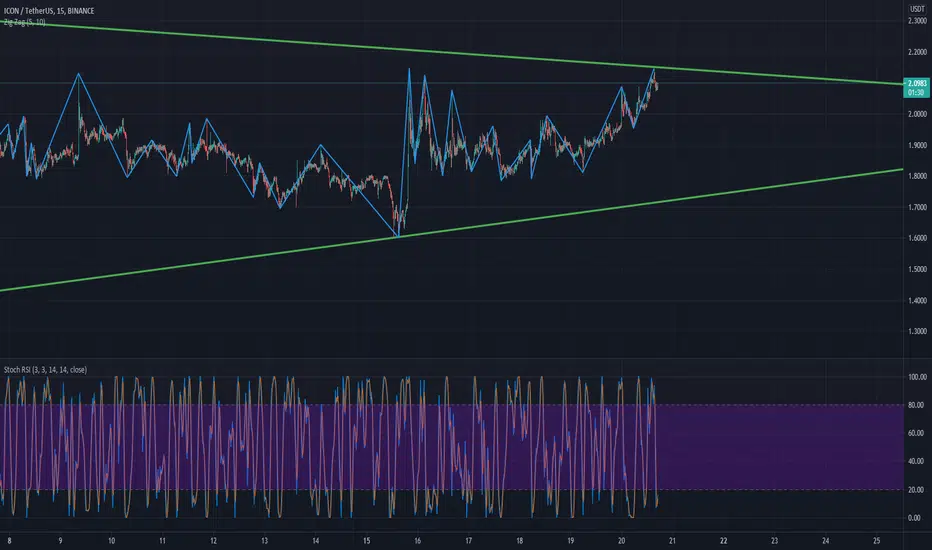
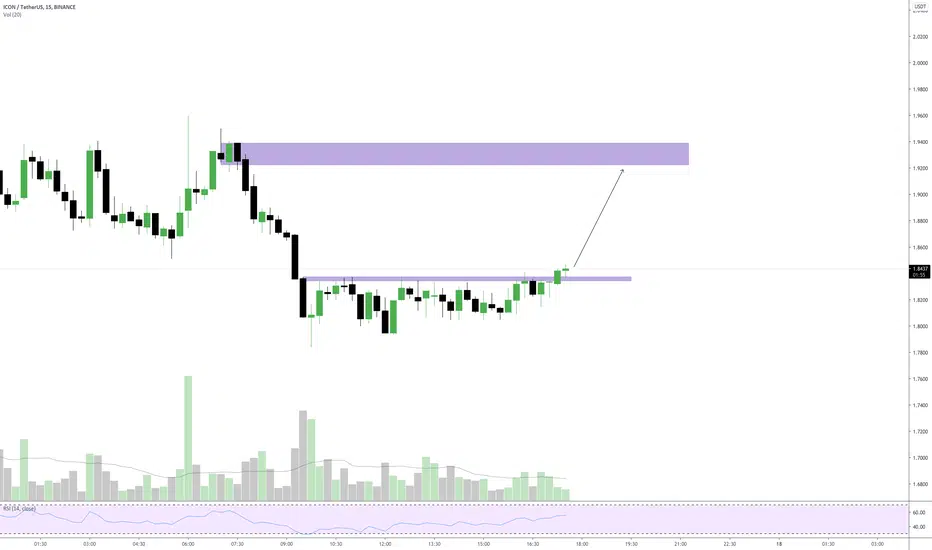
ICXUSDT - 15 min ICX broke horizontal resistance and we can target now the next major supply zone.
A long time ago i posted a icx chart where i'm really proud at, i will try to find it!
For every new follower i will add a new idea :)
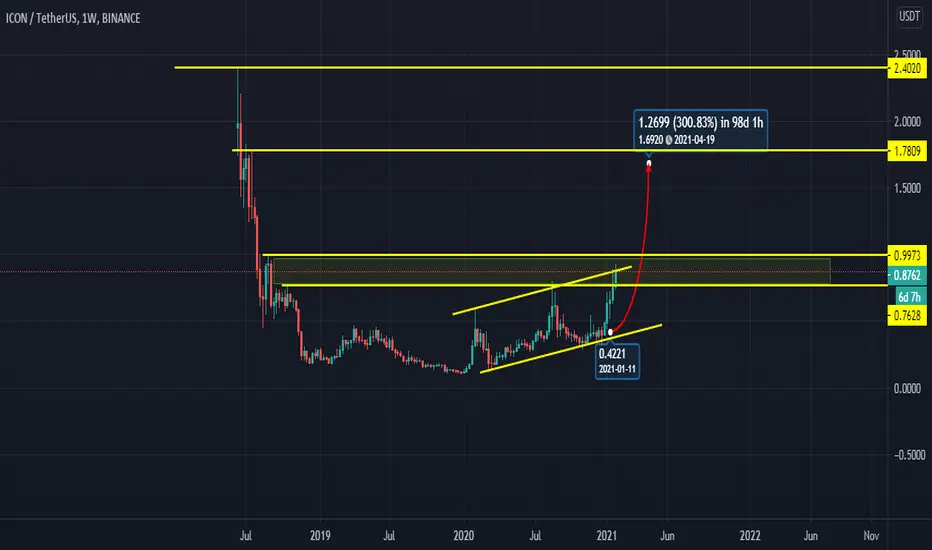
ICXUSDT 25th JanAs you can see, the pair currency moves in ascending channel. consolidating above 0.762 , breaking 0.992 level. ICUSDT will move toward 1.71 after that 2.402$