Dow Jones eyeing a breakout as war fears de-escalate!Dow Jones Industrial Average (DJIA) stands at 42,581.78 points, reflecting a 0.9% increase from the previous day. This uptick is attributed to investor optimism following a restrained retaliatory missile strike by Iran on a U.S. base in Qatar, which was perceived as non escalatory. Additionally, comments from Federal Reserve Governor Michelle Bowman suggested support for a potential interest rate cut in July, contingent on sustained low inflation .
The DJIA's performance this year shows a modest gain of 0.1%, underperforming compared to the S&P 500's 2.4% increase and the Nasdaq's 1.7% rise. Notably, the index is approximately 6.4% below its all-time high of 45,073.63 reached in December 2024 .
From a technical perspective, the DJIA is trading just above the 42,000 level, with key support around 41,500 and resistance near 43,000. The index has recently faced challenges breaking through the 42,600 mark, indicating potential short-term volatility. Market participants are closely monitoring upcoming economic data and Federal Reserve decisions, which could influence the index's trajectory in the near term.
For investors, the current environment presents opportunities to assess the DJIA's performance relative to other indices, considering factors such as geopolitical developments and monetary policy expectations.
"The forecasts provided herein are intended for informational purposes only and should not be construed as guarantees of future performance. This is an example only to enhance a consumer's understanding of the strategy being described above and is not to be taken as Blueberry Markets providing personal advice."
DOW trade ideas
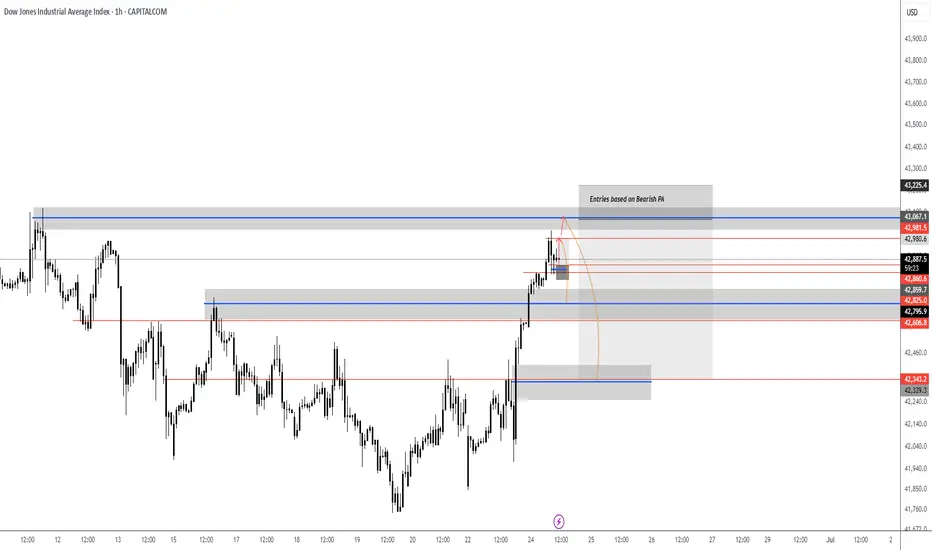
US30 - Intraday long scalp then short Looking for that intraday scalp on the long around 120 points can hold potentially further up to our higher supply level. If bearish PA is confirmed around the 43,000 level can look to take this short. All dependent on PA.
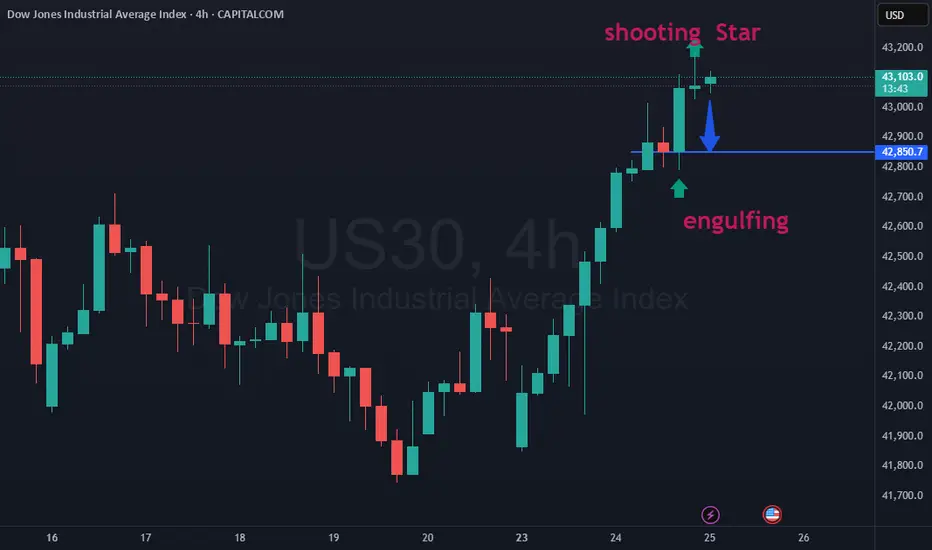
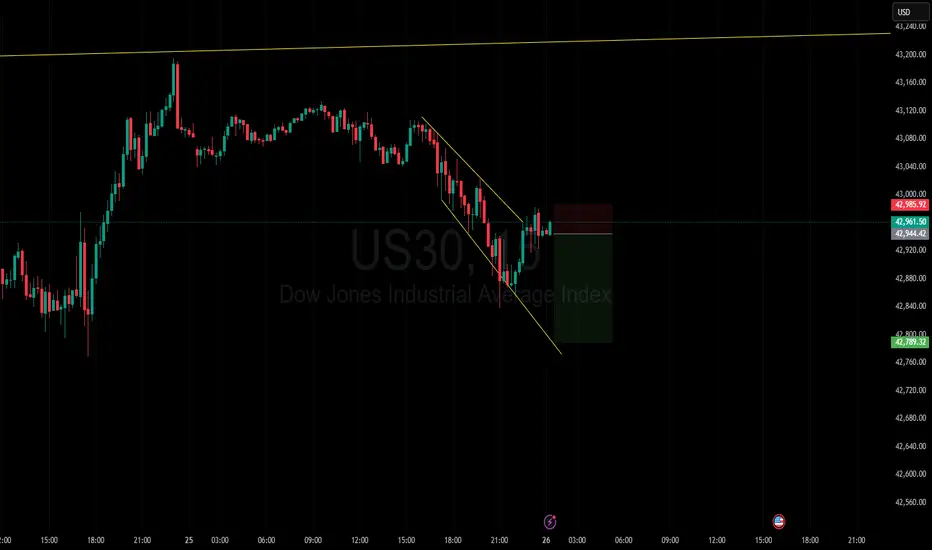
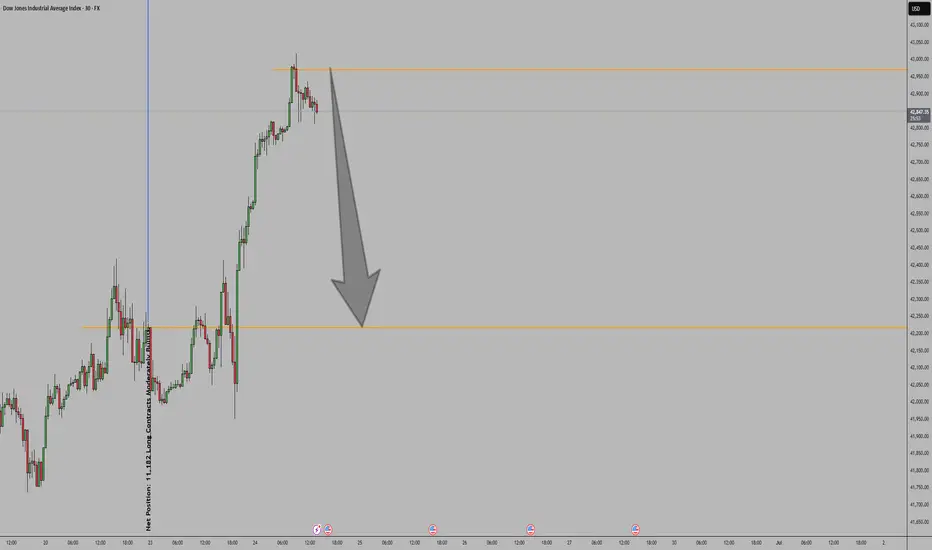
us30 analysis 25-06-2025There was engulfing in the 4 hour candle and the next candle was a shooting star. So there is a lot of liquidity in the previous engulfing. So the market can come to 22092 to grab this liquidity. However, to take an entry, you should take confirmation of lower time frames like 1 minute, 5 minutes.
Dow Jones Potential UpsidesHey Traders, in today's trading session we are monitoring US30 for a buying opportunity around 41,900 zone, US30 is trading in an uptrend and currently is in a correction phase in which it is approaching the trend at 41,900 support and resistance area.
Trade safe, Joe.

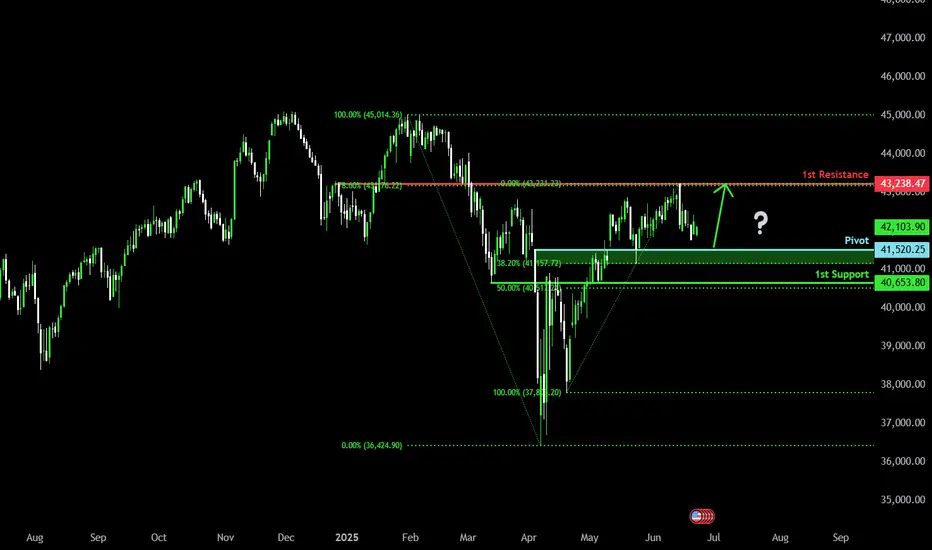
Falling towards major support?Dow Jones (US30) is falling towards the pivot and could bounce to the 1st resistance that aligns with the 78.6% Fibonacci retracement.
Pivot: 41,520.25
1st Support: 40,653.80
1st Resistance: 43,238.47
Risk Warning:
Trading Forex and CFDs carries a high level of risk to your capital and you should only trade with money you can afford to lose. Trading Forex and CFDs may not be suitable for all investors, so please ensure that you fully understand the risks involved and seek independent advice if necessary.
Disclaimer:
The above opinions given constitute general market commentary, and do not constitute the opinion or advice of IC Markets or any form of personal or investment advice.
Any opinions, news, research, analyses, prices, other information, or links to third-party sites contained on this website are provided on an "as-is" basis, are intended only to be informative, is not an advice nor a recommendation, nor research, or a record of our trading prices, or an offer of, or solicitation for a transaction in any financial instrument and thus should not be treated as such. The information provided does not involve any specific investment objectives, financial situation and needs of any specific person who may receive it. Please be aware, that past performance is not a reliable indicator of future performance and/or results. Past Performance or Forward-looking scenarios based upon the reasonable beliefs of the third-party provider are not a guarantee of future performance. Actual results may differ materially from those anticipated in forward-looking or past performance statements. IC Markets makes no representation or warranty and assumes no liability as to the accuracy or completeness of the information provided, nor any loss arising from any investment based on a recommendation, forecast or any information supplied by any third-party.
There is a possibility of a decline and a return to the channelIn compressed channels
The price can hardly pass it
Therefore, the downward trend is expected to continue
In this time form.
The details of the deal have been specified.
good luck. BLACKBULL:US30 BLACKBULL:US30
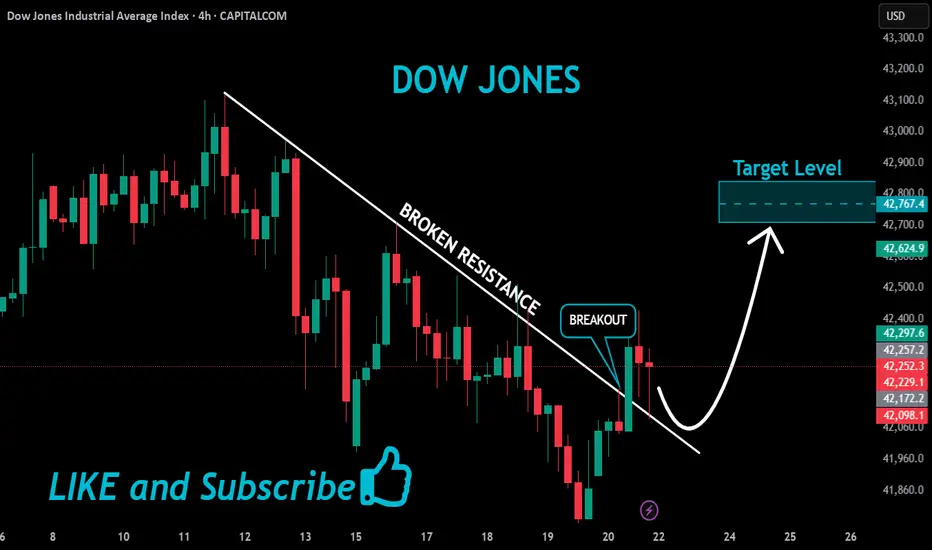
US30 Will Grow!
HI,Traders !
#US30 is trading in an
Uptrend and the Indice
Made a bullish breakout
And a pullback so affter
The retest of the broken
Falling resistance which
Is now a support we will
Be expecting a further
Bullish move up !
Comment and subscribe to help us grow !
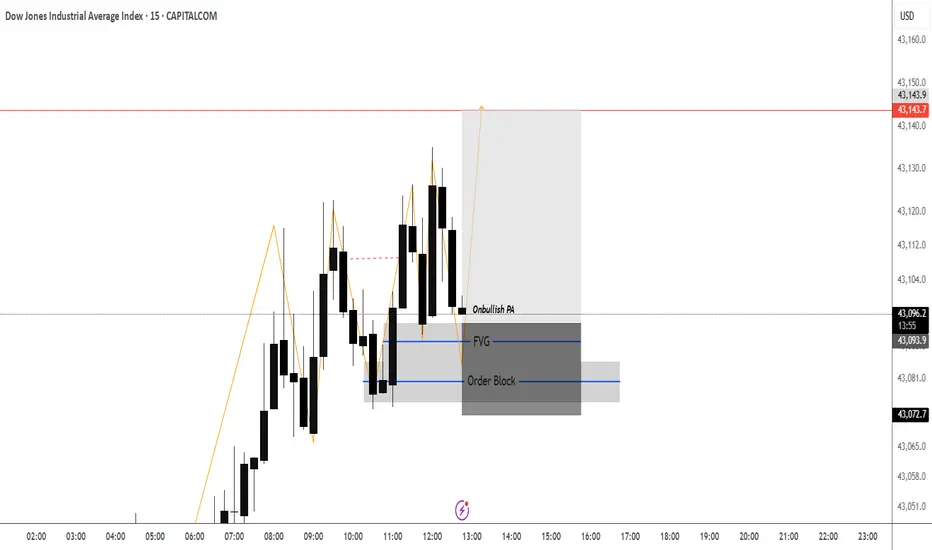
US30 - Long 43,150Still looking for that 43,150 lets get a test of FVG then on bullish PA above we can plan trade. Stops would go below the order block.
US30 Bullish ConfirmationsBullish confirmations to look out for:
1. Break of the double bottom rejection pattern neckline to validate the pattern
2. Breakout and retest of the resistance trendline
3. Creation of new higher lows on H4 and H1 Timeframes following the above confirmations
US30Given the current COT data, technical indicators, and economic factors, the bias for the US30 is bearish. Traders should monitor upcoming economic reports and Federal Reserve announcements for potential shifts in market sentiment.
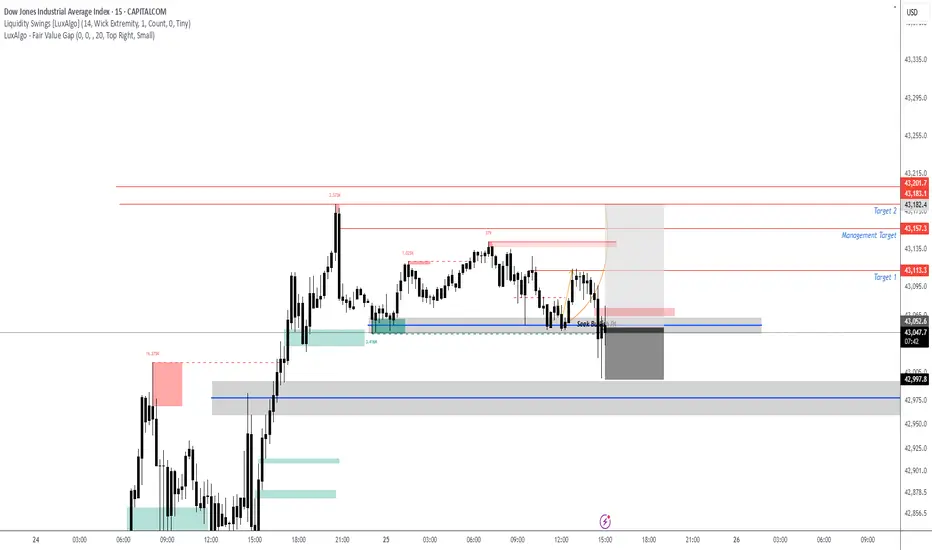
Why I’m Sitting Out: US30 Reaches Critical Range HighI’m currently keeping a close eye on the US30, along with the other major indices 🧐. What stands out the most right now is how overextended this rally has become across the board 📈.
The key concern here is that price has now pushed into a previous external range high, sweeping liquidity resting just above that level 💧. This area is a textbook zone where big money often steps in to offload positions — it’s the perfect place for institutions to find willing counterparties after prior accumulation 📍💼.
Given the aggressive nature of this move and how far price has stretched, I’m extremely hesitant to get involved at this stage 🚫. I have zero interest in buying into a market that’s trading at a premium and sitting at a potential reversal zone ⚠️.
The prudent move here is to wait for a retrace, followed by a bullish break in structure before considering re-entry 🔁📈. Sometimes, the most powerful edge in trading is knowing when not to trade — and for me, today is one of those days.
⚠️ This is not financial advice — just sharing my current perspective on the market.

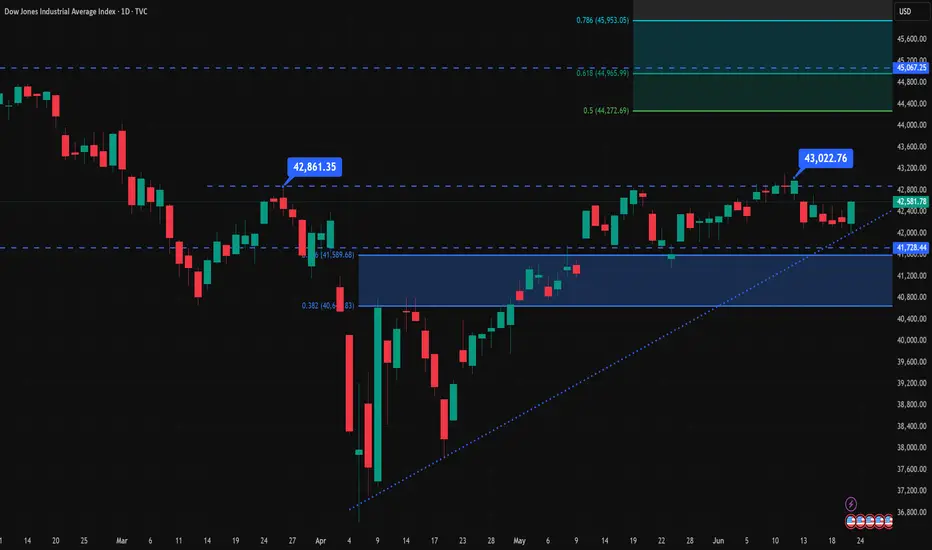
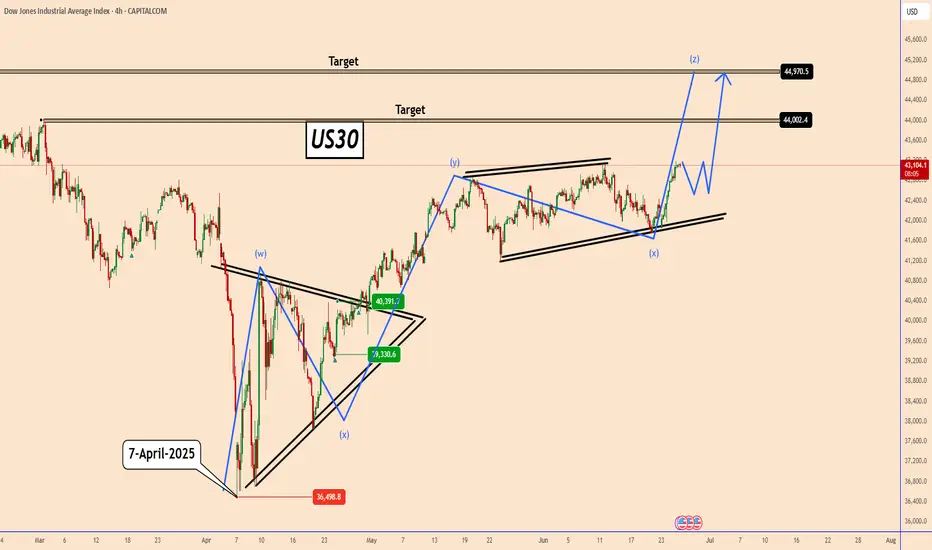
US30: The bullish trend remains in progressUS30: The bullish trend remains in progress
On April 7, 2025, US30 hit its lowest point at approximately 36500. Since then, despite significant concerns regarding Trump's tariffs and the ongoing turmoil in the Middle East, all indices have been on the rise.
Overall the U.S. indicators are showing robust performance.
In a worst-case scenario, we might observe US30 to make a minor correction close to 42500 before it bounces further, potentially retesting the chart level that aligns with its all-time high price as well.
Key target levels: 44000 and 44970
You may find more details in the chart!
Thank you and Good Luck!
❤️PS: Please support with a like or comment if you find this analysis useful for your trading day❤️
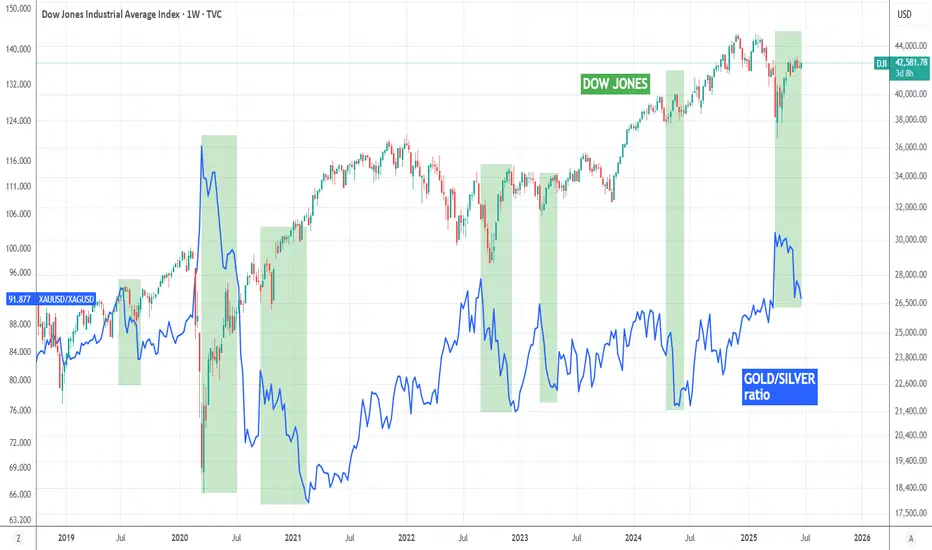
DOW JONES about to skyrocket based on the Gold/Silver ratio!Dow Jones (DJI) has been basically consolidating for the past month or so, following the massive April 7th bottom rebound but there is a very distinct indicator that shows it is about to skyrocket.
That is the Gold/ Silver ratio (blue trend-line). Gold (XAUUSD) as a safe haven, attracts capital in times of market uncertainty. Silver (XAGUSD), as a metal of industrial use, attracts capital in times of economic boom and prosperity.
In the past 6 years more particularly, every time the Gold/ Silver ratio declined, Dow started rising aggressively (exception July-Aug 2019, when the market rose straight after), as investors clearly showed their risk-on appetite by buying Silver (optimism) at the expense of Gold (fear).
Dow's current consolidation indicates that there may be high accumulation in the past month and the ratios extended decline suggests a skyrocket move is up next.
-------------------------------------------------------------------------------
** Please LIKE 👍, FOLLOW ✅, SHARE 🙌 and COMMENT ✍ if you enjoy this idea! Also share your ideas and charts in the comments section below! This is best way to keep it relevant, support us, keep the content here free and allow the idea to reach as many people as possible. **
-------------------------------------------------------------------------------
💸💸💸💸💸💸
👇 👇 👇 👇 👇 👇
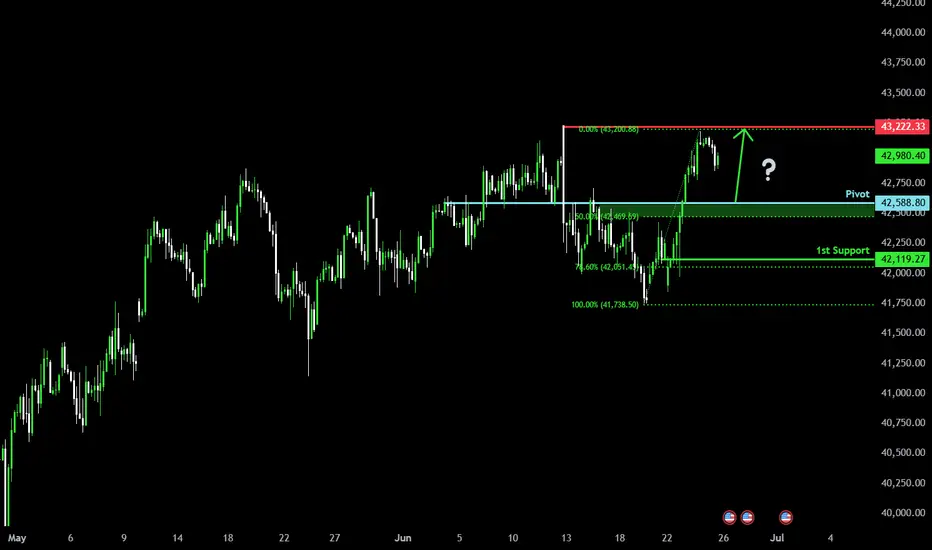
Bullish bounce for the Dow Jones?The price is falling towards the pivot which has been identified as an overlap support and could bounce from this level to our take profit.
Pivot: 42,588.80
1st Support: 42,119.27
1st Resistance: 43,222.33
Risk Warning:
Trading Forex and CFDs carries a high level of risk to your capital and you should only trade with money you can afford to lose. Trading Forex and CFDs may not be suitable for all investors, so please ensure that you fully understand the risks involved and seek independent advice if necessary.
Disclaimer:
The above opinions given constitute general market commentary, and do not constitute the opinion or advice of IC Markets or any form of personal or investment advice.
Any opinions, news, research, analyses, prices, other information, or links to third-party sites contained on this website are provided on an "as-is" basis, are intended only to be informative, is not an advice nor a recommendation, nor research, or a record of our trading prices, or an offer of, or solicitation for a transaction in any financial instrument and thus should not be treated as such. The information provided does not involve any specific investment objectives, financial situation and needs of any specific person who may receive it. Please be aware, that past performance is not a reliable indicator of future performance and/or results. Past Performance or Forward-looking scenarios based upon the reasonable beliefs of the third-party provider are not a guarantee of future performance. Actual results may differ materially from those anticipated in forward-looking or past performance statements. IC Markets makes no representation or warranty and assumes no liability as to the accuracy or completeness of the information provided, nor any loss arising from any investment based on a recommendation, forecast or any information supplied by any third-party.
US30 Under Pressure as Geopolitical Risks Drive VolatilityUS30 – Technical Overview
Dow Jones (US30) futures are trading lower amid escalating tensions in the Middle East, with markets closely monitoring any potential U.S. response that could significantly sway sentiment.
⚠️ Volatility remains elevated, and traders should remain cautious ahead of potential geopolitical developments.
US30 continues to trade below the key level at 42160, maintaining a bearish bias.
As long as the price stays below this level, further downside remains likely.
However, the market is also testing the pivot zone, and a confirmed break above 42160 could trigger a bullish move toward 42410.
Key Levels:
• Pivot: 42160
• Support: 41900 / 41780 / 41310
• Resistance: 42310 / 42410 / 42580

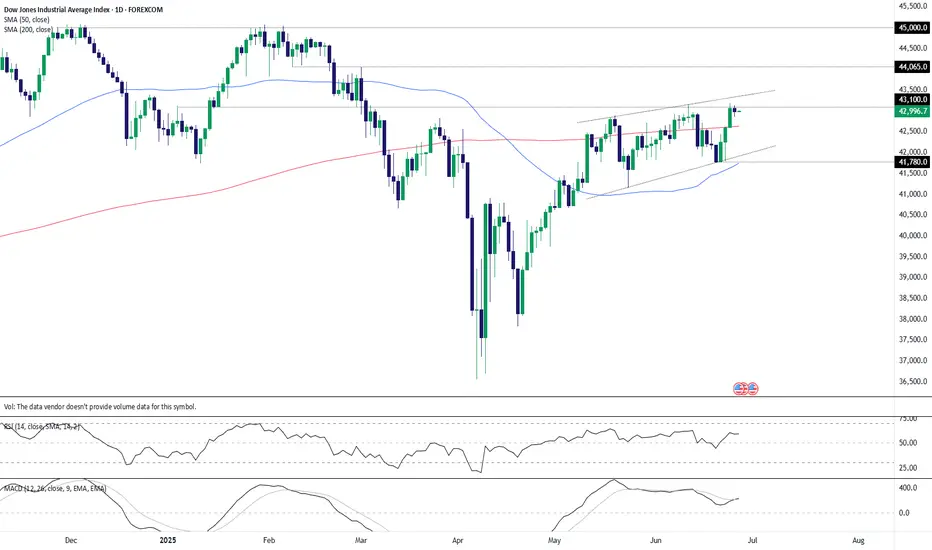
US30: Short setup brewingSitting in a rising wedge with bearish divergence after running into resistance at 43100, the US30 contract finds itself at an interesting juncture on the charts. If it can’t stage a definitive break above these levels, a short setup could be on the cards.
If the contract cannot break and hold above 43100, traders could look to initiate short positions targeting the 200-day moving average initially. If that were to give way, the target could be lengthened to 42000, where wedge support is currently found. A stop above 43100 would protect against reversal.
While MACD has staged a bullish crossover, the momentum signal is countered by what’s still bearish divergence between RSI (14) and price despite the latest bounce.
Given the proximity to month end—a period notorious for window dressing and false signals—the preference would be to wait for another retest and failure at 43100 before initiating the trade.
A de-escalation in trade tensions, lower crude prices and the prospect of a Fed rate cut as soon as July have been tailwinds for the contract over recent days. If it can’t continue to rally in this environment, it questions just what would be required to deliver further upside, just as negative tariff headlines potentially loom.
Good luck!
DS
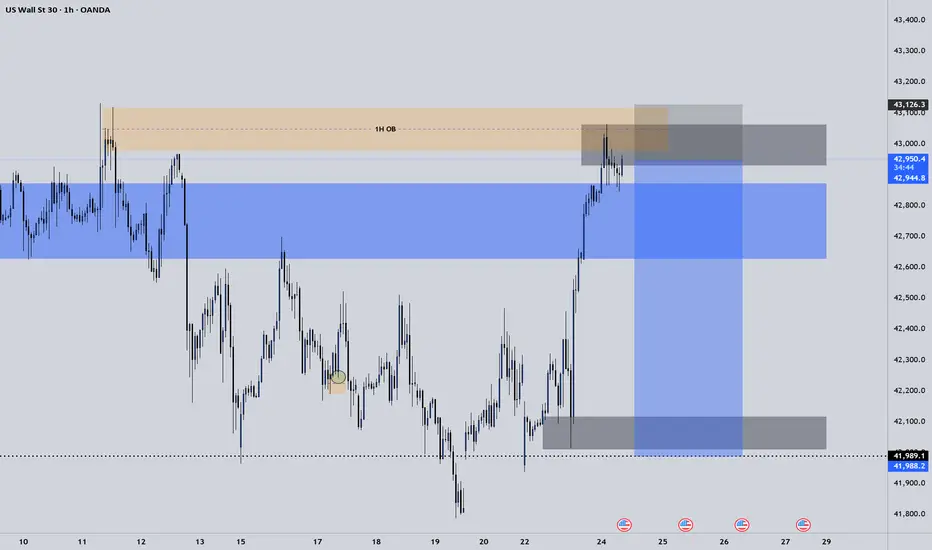
US30 ShortElite Live Analysis – US30
Market Structure: Bearish across the Weekly, Daily, and 4H timeframes.
Key Level: Price has tapped into a significant zone, aligning with higher timeframe bias.
1H Confirmation: Price also tapped into a 1H Order Block and showed clear rejection, further validating downside potential.
Expectations:
Anticipating a strong move to the downside in alignment with market structure.
Targets:
Structured liquidity resting below
Liquidity pools beneath current price
Dow Jones breakout targets 44K and beyondThe Dow Jones is finally breaking out, and the chart suggests a 3 to 4 percent move higher is in play. We analyse the key patterns, trade setups, and risks ahead including market seasonality, war headlines, and economic data. Bitcoin, EURUSD, and Nasdaq also showing strength. Is this the start of a bigger rally?
This content is not directed to residents of the EU or UK. Any opinions, news, research, analyses, prices or other information contained on this website is provided as general market commentary and does not constitute investment advice. ThinkMarkets will not accept liability for any loss or damage including, without limitation, to any loss of profit which may arise directly or indirectly from use of or reliance on such information.

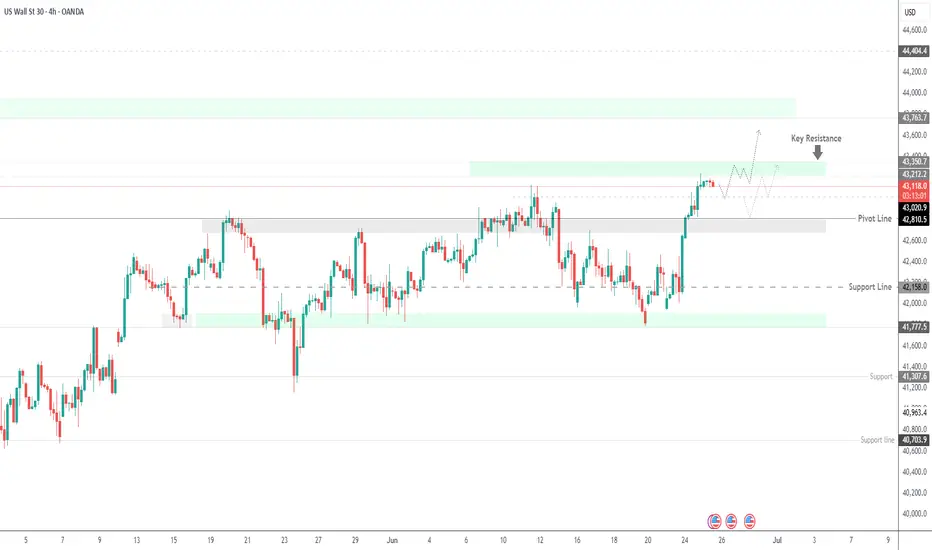
Dow Jones Retesting 43,020 | Bullish Bias Intact Above 42,810US30 OVERVIEW
Dow Jones Holds Bullish Momentum | Eyes on Retest and Continuation
US30 (Dow Jones) remains under bullish pressure, supported by recent macro developments and improving sentiment.
The price appears to be forming a retest toward 43,020, which could act as a springboard for further upside.
As long as the index trades above 42,810, the bullish trend remains intact, targeting 43,350, and potentially 43,765.
However, a confirmed break below 42,810 would shift the outlook to bearish in the short term.
Resistance Levels: 43,350 → 43,765
Support Levels: 43,020 → 42,810
Previous idea:
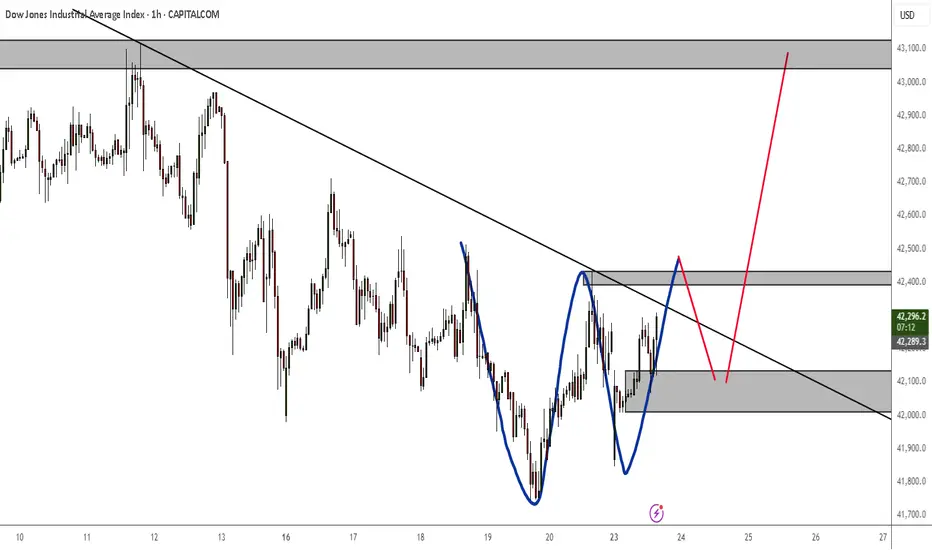
US30 - Entries ActiveAs anticipated got the sweep below then break above our area with a U shape formation. Looking to the upside.
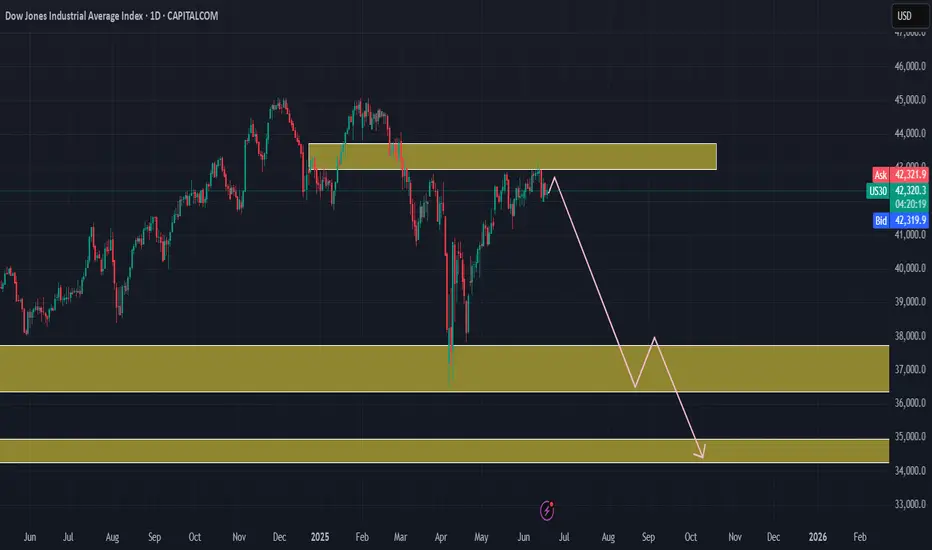
SELL US30US30 is currently testing a macro-level resistance zone that has historically reversed price sharply. The current market behavior hints at a bearish rejection, with a projected move toward 37K first, and potentially 34K later, if broader market sentiment shifts risk-off. This setup provides a favorable risk-reward ratio for swing short traders, especially if confirmed by price action triggers in the coming days.
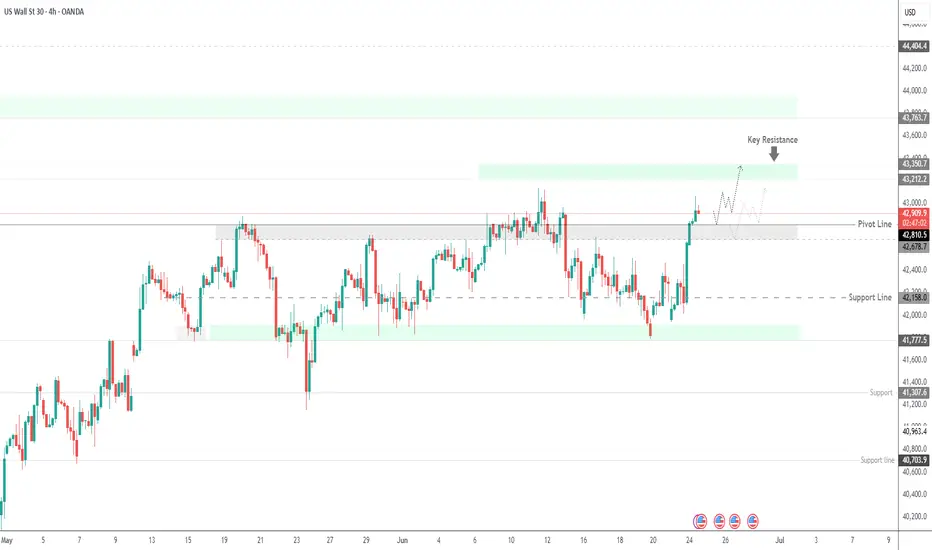
Dow Jones Gains on Rate Cut Hopes and Ceasefire Relief US30 OVERVIEW
Wall Street Rises on Fed Rate Cut Hopes and Geopolitical De-escalation
The Dow Jones (US30) remains under bullish pressure, supported by rising expectations of a Federal Reserve rate cut later this year and a ceasefire agreement between Iran and Israel, which has eased market tensions.
TECHNICAL OUTLOOK – US30
The price maintains a bullish bias as long as it trades above the pivot level at 42,810, with upside potential toward the key resistance at 43,210.
A short-term bearish correction is possible toward 42,810 or even 42,670, but the broader structure remains bullish above these levels.
Resistance Levels: 43,060 → 43,210 → 43,350
Support Levels: 42,670 → 42,420 → 42,160
A sustained break below 42,670 could signal deeper correction, while a clear move above 43,210 would confirm continued bullish momentum.
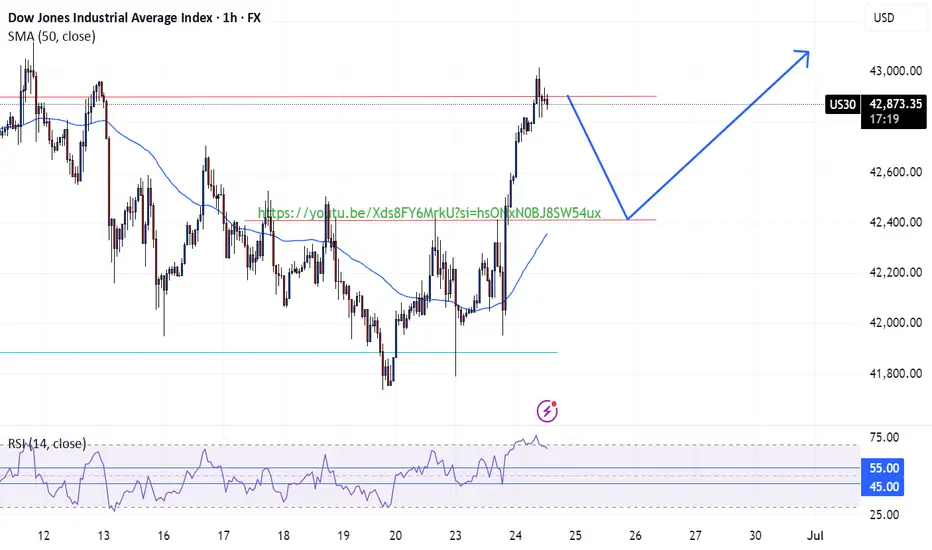
US30 Long Opportunity US30 shows strong bullish confluences at the opening of the week, currently testing the resistance level at 42,900. Price is above above the 50 SMA and favors bullish momentum per the RSI above 55.
Potentially retracement towards the break and retest level at 42,400 where we could see a potential continuation of the bullish trend after the market collects enough liquidity.
This is support by fundamentals of the day being the cease fire between Iran-Israel. investor more comfortable taking risks and stepping back into the indices.