DOW30/US30 - ACTIVE TRADE - PROFITABLE SET UP TRADETeam,
today I have provide LIVE trading today provide you i did a good trade for
NAS100, DOW30 AND DAX30 - in real LIVE trading
OK, I prefer to SET UP my limit order today only. Remember, the market will be very volatile in the next 4 hours.
I expect the RATE should cut 25 points at least. Why
the employment data come out remain the same
inflation last week look under control
Retails is poorly come out today
The FED does not care about the America, they just care about taking advantage of America.
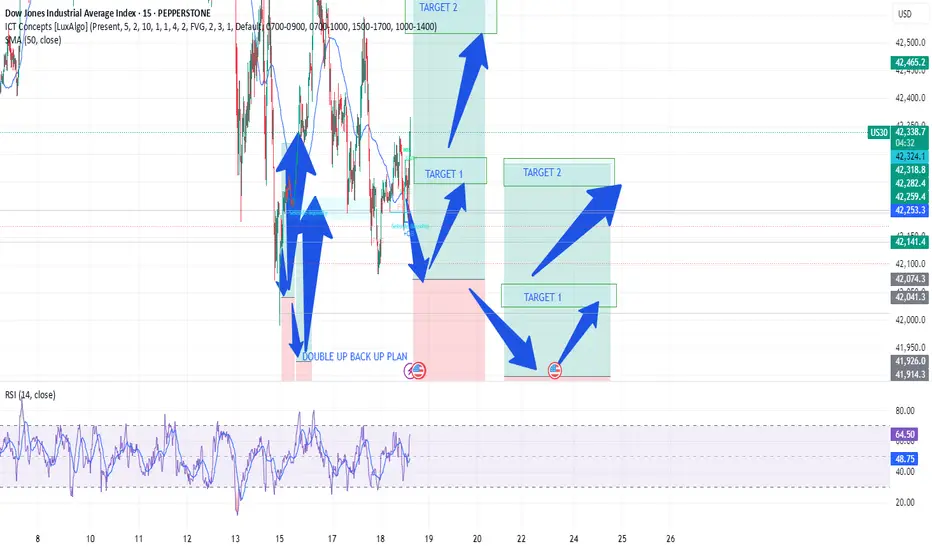
Lets now focus on the SETTING BUY LIMIT ORDER
I order small volume at 41975-42075
However I will double up at LIMIT BUY ORDER
The 1st target are looking at 4227542300
Target 2 - 42575-42675
REMEMBER - IF IT DOES NOT HIT YOUR ENTRY, JUST WALK AWAY.
DOW trade ideas
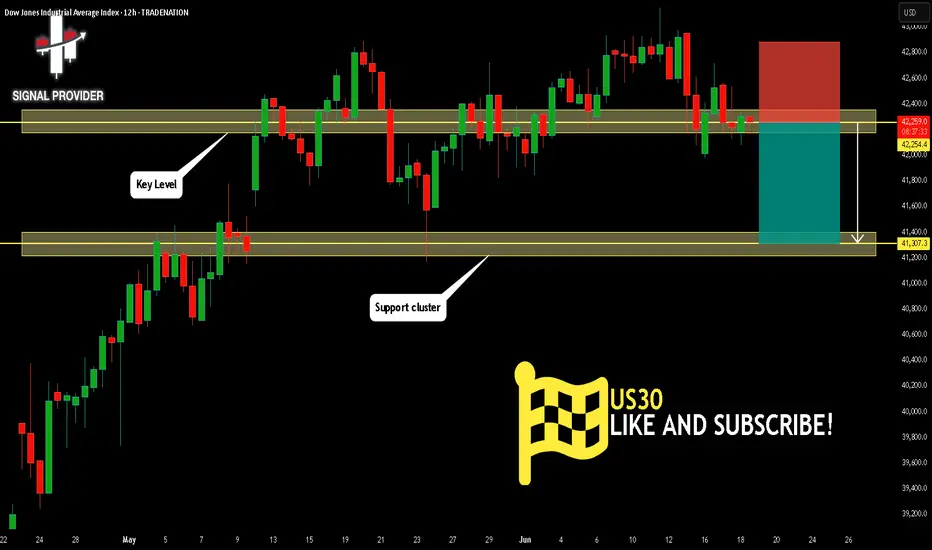
US30 Is Bearish! Sell!
Here is our detailed technical review for US30.
Time Frame: 12h
Current Trend: Bearish
Sentiment: Overbought (based on 7-period RSI)
Forecast: Bearish
The market is approaching a significant resistance area 42,254.4.
Due to the fact that we see a positive bearish reaction from the underlined area, I strongly believe that sellers will manage to push the price all the way down to 41,307.3 level.
P.S
Overbought describes a period of time where there has been a significant and consistent upward move in price over a period of time without much pullback.
Disclosure: I am part of Trade Nation's Influencer program and receive a monthly fee for using their TradingView charts in my analysis.
Like and subscribe and comment my ideas if you enjoy them!
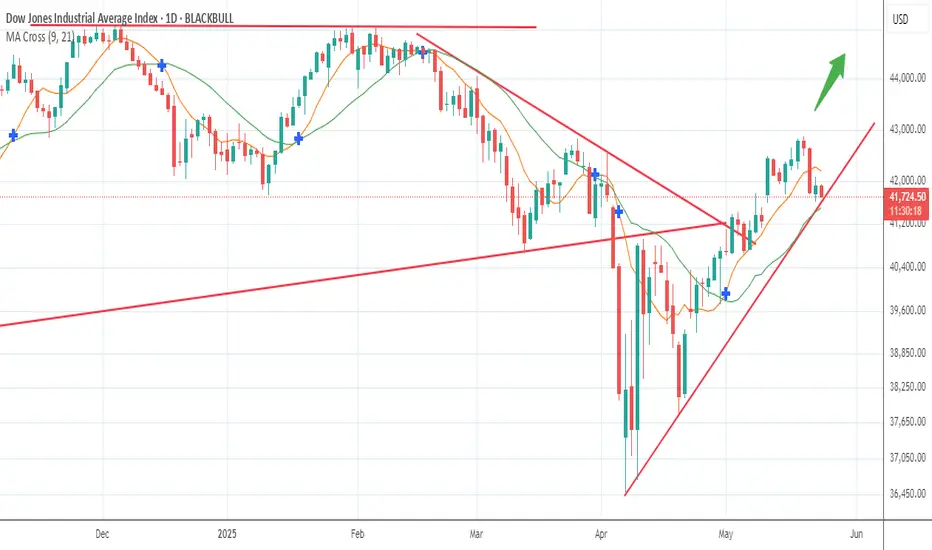
Bull Run To New Highs?The Dow got slammed on Wednesday, down 2%, no follow through yesterday.
Despite all the look of this rally being a bounce to sell, notice the uptrend line of support developed, this is the dynamics of markets, morph and twist to shake out weaker hands.
Would not be surprised to see a resumption of this rally to all time highs into June/July, the tariff wobbles are gone for now, any firm close below the trend line changes the trend.
We buy this market now at support in prospect of a larger rally to resume.
Appreciate a thumbs up, Good Trading & God Bless you all!
US30 Stabilizes Above Key Support Amid Geopolitical TensionsUS30 – Overview
The price reacted modestly to ongoing Middle East tensions, reaching our previously mentioned pivot zone at 42160, then reversed and stabilized within the bullish territory.
Technical Outlook:
As long as the price holds above 42160, bullish momentum is expected to continue toward 42410.
A 1H close above 42410 would confirm further upside toward 42610 and 42810.
🔻 To shift into a bearish trend, the price must close below 42160 on the 1H or 4H timeframe, which could lead to a move down to 41780.
Key Levels:
• Pivot: 42310
• Resistance: 42410 / 42610 / 42810
• Support: 42160 / 41970 / 41780

DOW Might Recover From Today's LossesIsrael's attack on Iran's nuclear facilities has unsettled the markets. After a weak start, the indices, such as the DJIA, initially made little headway and were unable to recover their losses.
We do not expect the markets to plunge to their doom now, but to recover soon.
For the Dow, we initially expect new lows in the entry area shown and then a recovery to the target zone in the coming week.

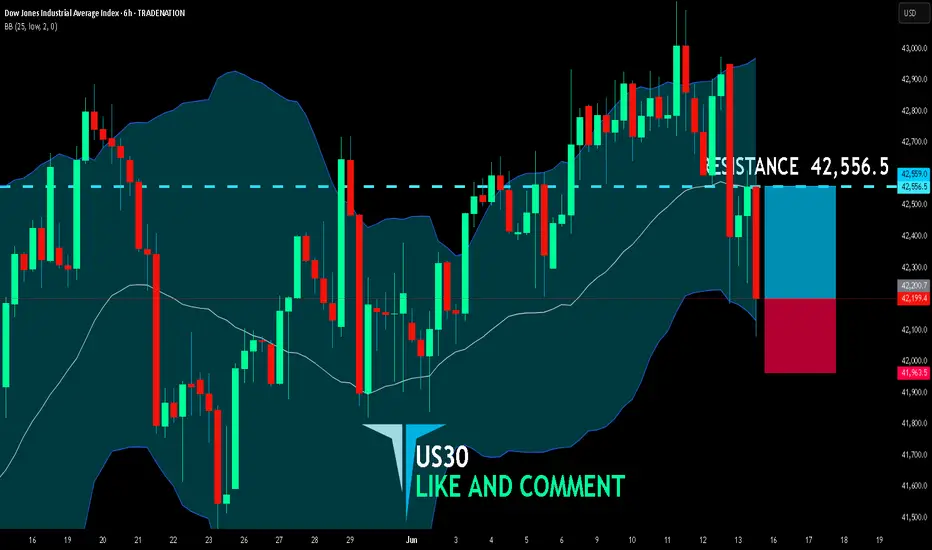
US30 BULLISH BIAS RIGHT NOW| LONG
US30 SIGNAL
Trade Direction: short
Entry Level: 42,200.7
Target Level: 42,556.5
Stop Loss: 41,963.5
RISK PROFILE
Risk level: medium
Suggested risk: 1%
Timeframe: 6h
Disclosure: I am part of Trade Nation's Influencer program and receive a monthly fee for using their TradingView charts in my analysis.
✅LIKE AND COMMENT MY IDEAS✅
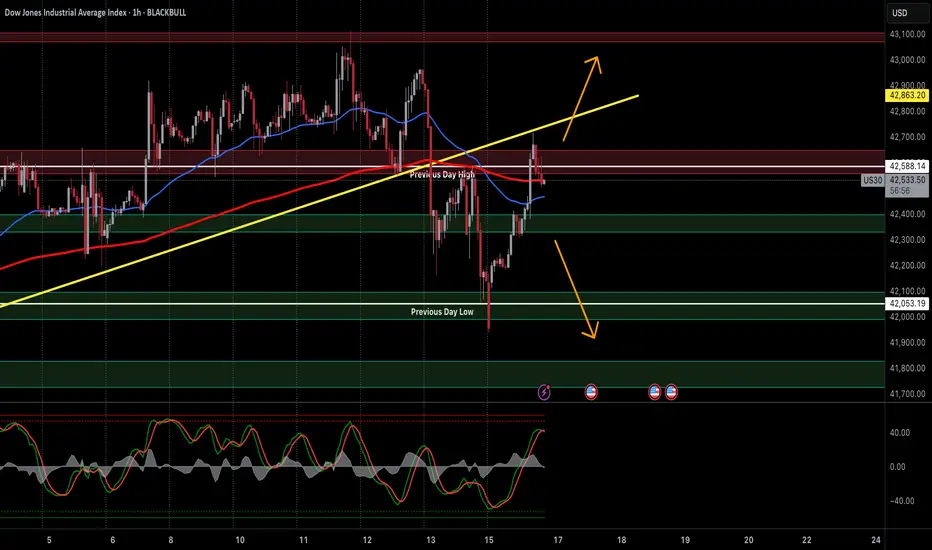
Wall Street Eyes Volatility: Dow Jones Tests Reversal ZoneUS30 (Dow Jones Index) — Clashing Forces of Risk & Reality
Technical Outlook — 16 June, 2025 | 1H Chart
Current Market Condition:
The Dow Jones (US30) has staged a recovery from the recent dip, but price is stalling at the Previous Day High (~42,588), a key confluence zone with the broken rising trendline, 50 EMA, and overhead supply.
This hesitation comes amid heightened global risk aversion triggered by the intensifying Iran–Israel conflict, adding pressure to global indices as investors rotate into safer assets like treasuries and gold. Despite intraday rebounds, equity bulls are showing signs of fatigue at resistance zones.
Markets are also bracing for upcoming US economic data and Fed commentary, which may further amplify intraday volatility.
Key Technical Highlights:
Price rejected from the confluence of PDH (~42,588), horizontal supply zone, and old rising trendline (yellow).
Currently hovering just under the 50 EMA; failure to hold could initiate a rotation back toward PD Low.
Stochastic RSI nearing overbought — suggests possible local top if no momentum breakout follows.
EMA 200 and the Previous Day Low at ~42,053 remain critical intraday supports.
Overall structure forming potential lower high under bearish macro cloud.
Trade Plan:
🔼 Bullish Breakout (Intraday Long):
Trigger: Break and sustained hold above 42,600 with rising volume
Target: 42,900 → 43,100
Stop Loss: Below 42,450 (to avoid whipsaws)
🔻 Bearish Rejection (Intraday Short):
Trigger: Clean rejection from PDH + trendline with bearish engulfing
Target: 42,100 → 42,050 → 41,850
Stop Loss: Above 42,650
⚖️ Neutral / Range Trade:
Play the range between PDH (~42,588) and PDL (~42,053) until breakout.
Scalp based on price reaction at either boundary with tight stop loss.
🛡️ Risk Management Note:
Global uncertainty tied to war escalation and Fed policy expectations make this a headline-driven market. News risk can spike volatility and invalidate technical setups. Trade with reduced size and increased caution, especially around US market open and geopolitical news cycles.
📢 If you found this analysis valuable, kindly consider boosting and following for more updates.
⚠️ Disclaimer: This content is intended for educational purposes only and does not constitute financial advice.
Quick take US indices and the Fed's interest rate decisionQuick look at what can we expect from the Fed's rate decision and press conference on Wednesday.
TVC:DJI
TVC:SPX
TVC:NDQ
Let us know what you think in the comments below.
Thank you.
77.3% of retail investor accounts lose money when trading CFDs with this provider. You should consider whether you understand how CFDs work and whether you can afford to take the high risk of losing your money. Past performance is not necessarily indicative of future results. The value of investments may fall as well as rise and the investor may not get back the amount initially invested. This content is not intended for nor applicable to residents of the UK. Cryptocurrency CFDs and spread bets are restricted in the UK for all retail clients.

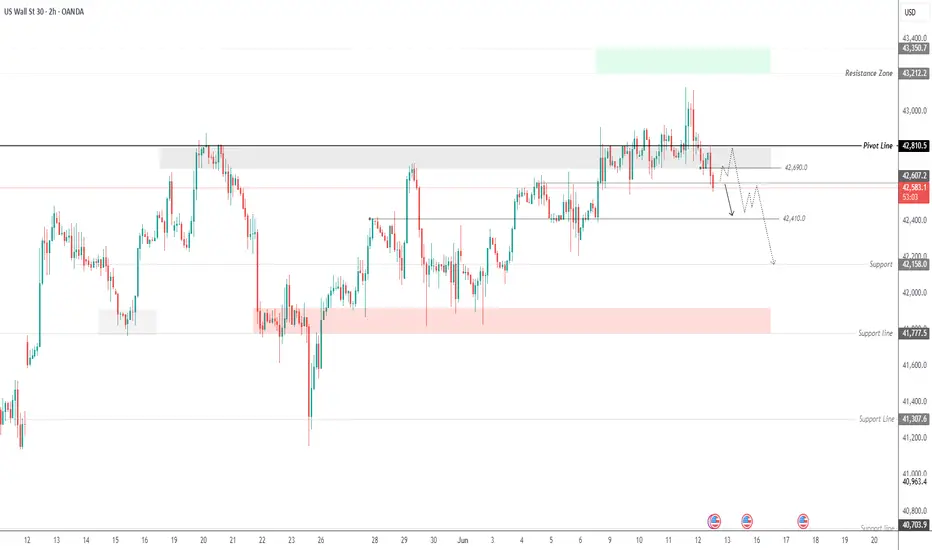
US30 | Bearish Below 42610, Eyes on 42410 and 42160US30 | OVERVIEW
The price has reversed and is now under bearish pressure, following stabilization below the 42690 – 42610 zone.
📉 As long as the index trades below this zone, the bearish trend is expected to continue toward 42410, and a 1H candle close below that level could extend the move to 42160.
📈 Alternative Scenario:
A clear stabilization above 42810 would shift momentum to bullish, targeting higher levels.
Pivot: 42610
Support Levels: 42410, 42160
Resistance Levels: 42690, 42810, 43080
US30 – Bearish Bias Amid Escalating Middle East TensionsUS30 – Bearish Bias Amid Escalating Middle East Tensions
U.S. indices, particularly the Dow Jones (US30), are under sustained bearish pressure due to intensifying geopolitical tensions between Israel and Iran. With no signs of de-escalation or negotiation, market sentiment remains risk-off.
Technical Outlook:
As long as the crisis continues, US30 is likely to maintain its downward momentum. The price appears set to test the 41770 level, with potential continuation toward 41310.
Only a clear signal of de-escalation or diplomatic engagement may reverse this trend, possibly triggering a recovery toward 42810.
For now, the directional bias remains bearish.
Key Levels:
• Pivot: 42160
• Support: 41770, 41310, 40700
• Resistance: 42410, 42810, 43210
Click to see the Previous idea

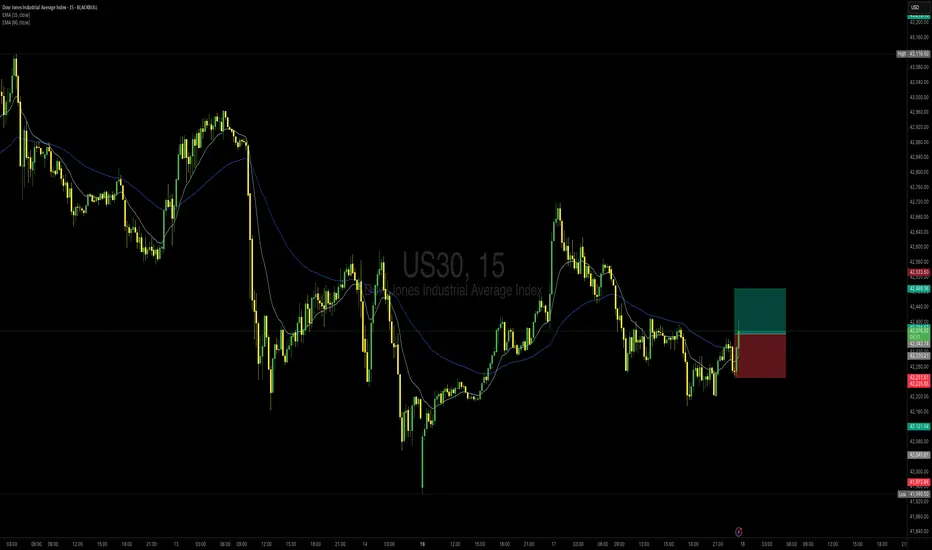
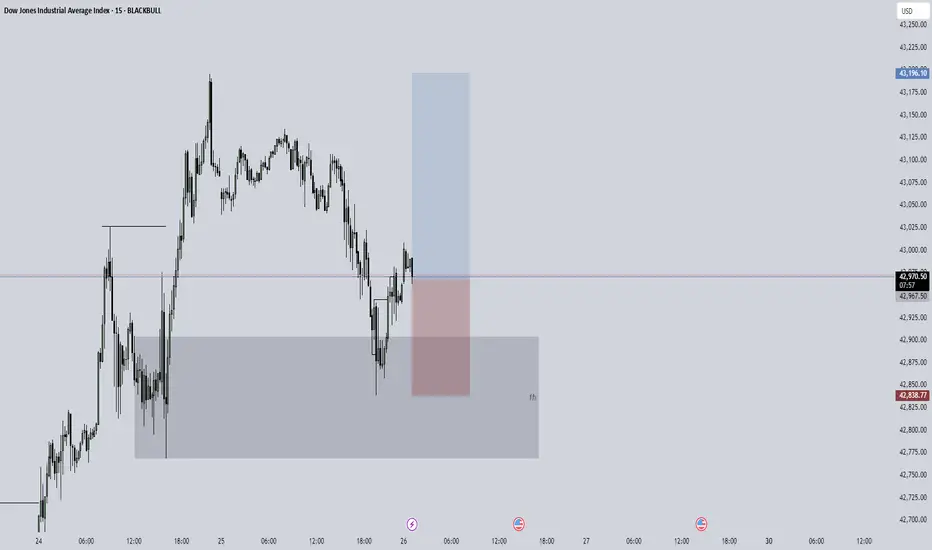
us30 outlook US30 Supply & Demand Outlook (1H–2H)
The market is currently trading within a fair value range (highlighted in yellow), with no clear edge for high-probability entries.
I'm waiting for price to move out of this range and into one of the fresh supply or demand zones marked above and below.

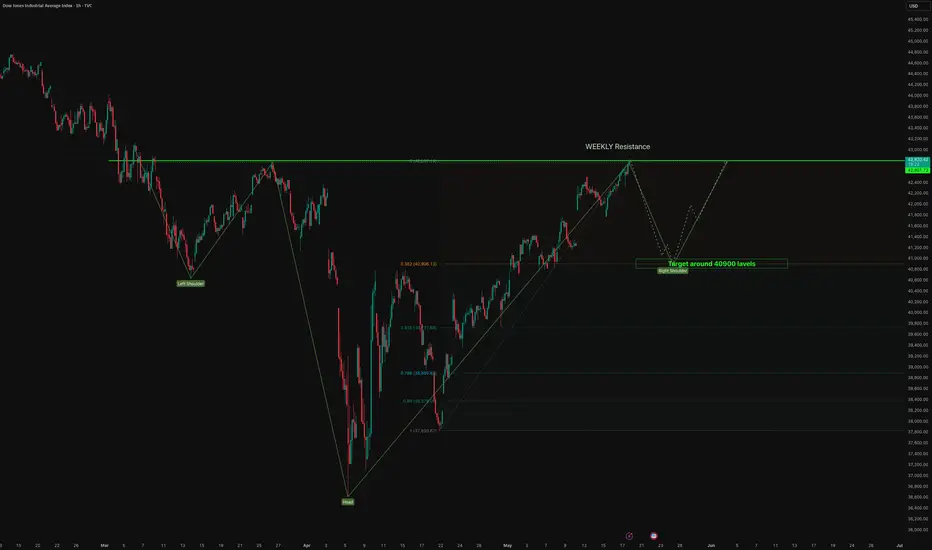
DOW - H&S is getting progressed. 📉 DOW JONES – Head & Shoulders Pattern Formation (Right Shoulder in Progress)
The chart illustrates a clear Head & Shoulders (H&S) pattern, a classic bearish reversal signal, forming on the higher timeframe.
🧠 Pattern Breakdown:
Left Shoulder: Formed in early March.
Head: Sharp dip and recovery formed during early April.
Right Shoulder: Currently in the making, aligning with a weekly resistance near 42,880 levels.
Price is expected to reject this resistance and complete the right shoulder.
📌 Technical View:
Strong rejection expected near the weekly horizontal resistance.
If the right shoulder completes and breaks below the neckline (around 41,500–41,600), it may trigger a measured fall.
Fibonacci levels also align, with the 0.382 and 0.5 retracement acting as potential reaction zones.
🎯 Target:
Target: 40,900 levels (Right Shoulder support zone).
This is a confluence zone where buyers may reappear.
Also forms a neckline test, critical for breakout confirmation or reversal.
🔔 Trade Setup Insight:
Short bias activated near 42,880 resistance zone.
Watch for confirmation via bearish engulfing candles or lower time frame breakdowns.
Targeting 40,900 initially. Further downside possible if neckline breaks decisively.
⚠️ Disclaimer:
This analysis is for educational purposes only and does not constitute investment advice or a recommendation. All trading involves risk. Please perform your own due diligence or consult a certified financial advisor before making trading decisions.
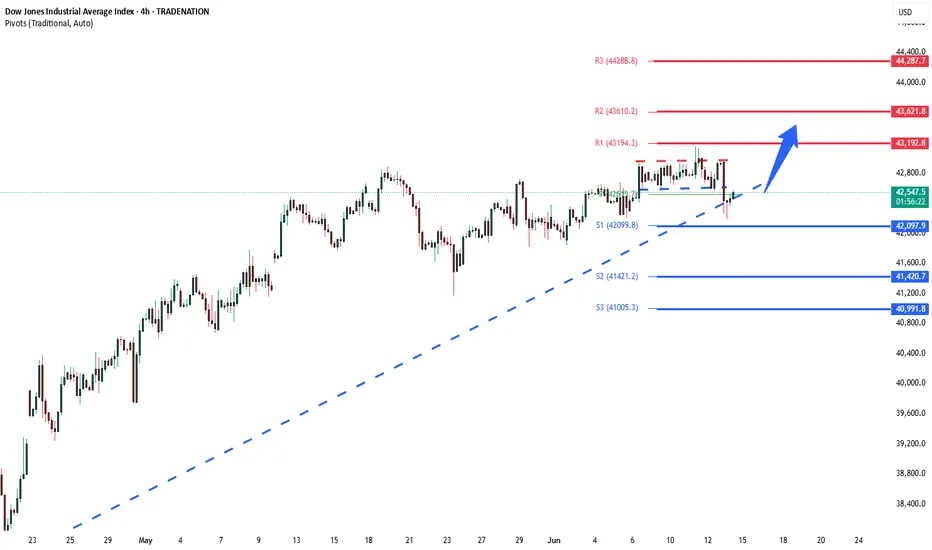
DowJones uptrend retest Key Support and Resistance Levels
Resistance Level 1: 43192
Resistance Level 2: 43620
Resistance Level 3: 44290
Support Level 1: 42100
Support Level 2: 41420
Support Level 3: 40990
This communication is for informational purposes only and should not be viewed as any form of recommendation as to a particular course of action or as investment advice. It is not intended as an offer or solicitation for the purchase or sale of any financial instrument or as an official confirmation of any transaction. Opinions, estimates and assumptions expressed herein are made as of the date of this communication and are subject to change without notice. This communication has been prepared based upon information, including market prices, data and other information, believed to be reliable; however, Trade Nation does not warrant its completeness or accuracy. All market prices and market data contained in or attached to this communication are indicative and subject to change without notice.
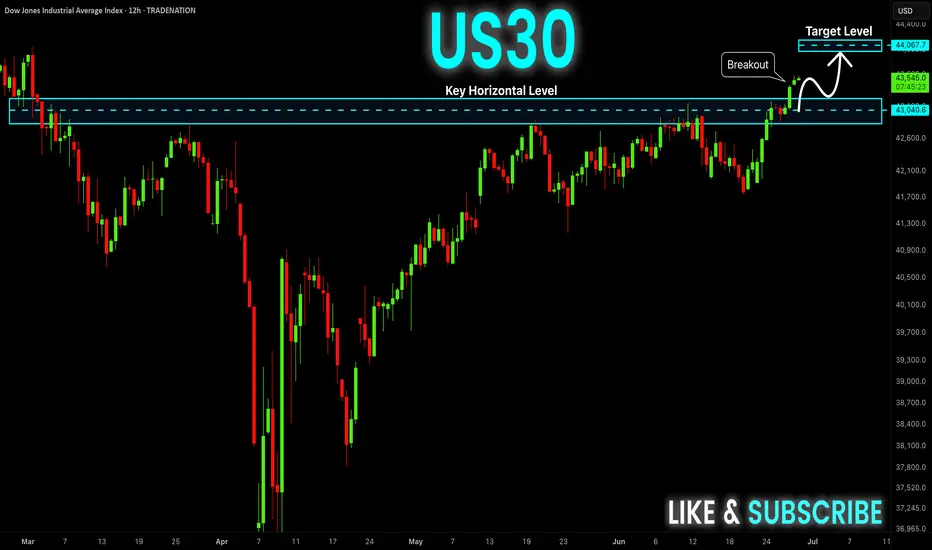
DOW JONES Will Keep Growing! Buy!
Hello,Traders!
US30 is trading in an
Uptrend and the index broke
The key horizontal level
Around 43,200 and the
Breakout is confirmed so
We are bullish biased
And we will be expecting a
Further bullish move up
Buy!
Comment and subscribe to help us grow!
Check out other forecasts below too!
Disclosure: I am part of Trade Nation's Influencer program and receive a monthly fee for using their TradingView charts in my analysis.
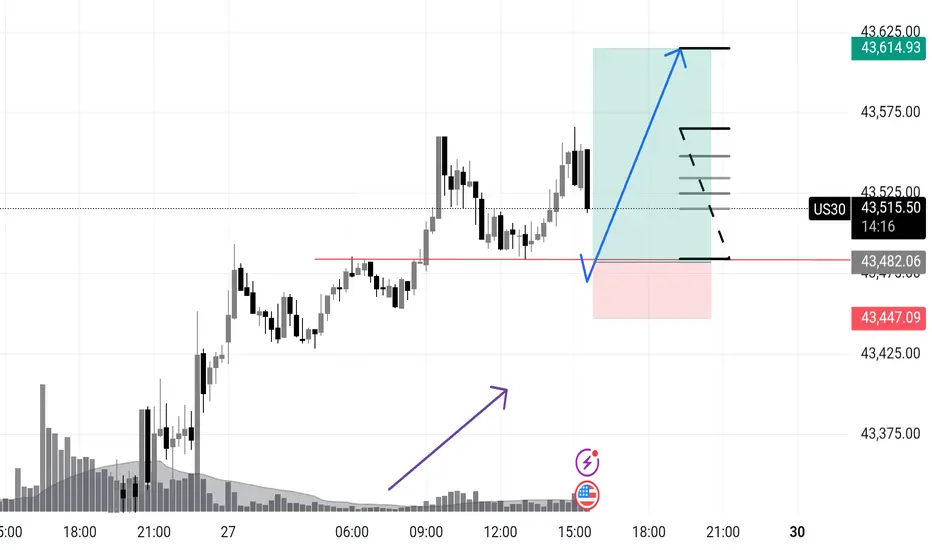
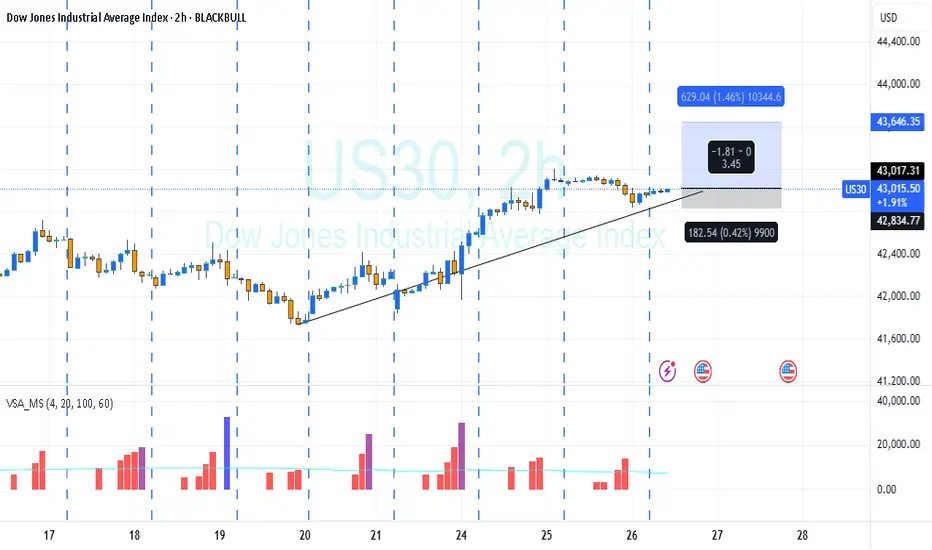
US 30 Potential longUS30 – Wyckoff Spring Setup for NY Session | Intraday Execution Play
Price rallied in the London session with rising volume and structure breaks —
Now we’re anticipating a classic Wyckoff spring scenario just ahead of NY open.
📍 Key Expectations:
Sweep of intraday support around 43,482
Strong buyer reaction (spring confirmation)
Expansion into the 43,600+ zone — possible 1.5R+ continuation
⚠️ Volume buildup + stop placement below prior structure make this zone ripe for a fakeout → reversal.
I’m watching for a quick flush below the line → wick rejection → engulfing confirmation to trigger longs.
This is a trap trade — smart money baits shorts, I’m betting they get squeezed.
🔫 Entry: On confirmation after spring
📉 Invalidation: Below the spring low
🎯 Target: 43,610 zone and trailing after break of 43,570
Let them walk into the trap. Then pull the trigger.
PCEs & attacks on PowellWe are carefully monitoring the PCEs today, to see, "wins" this small battle in the rate-lowering war. Let's dig in.
Let us know what you think in the comments below.
Thank you.
77.3% of retail investor accounts lose money when trading CFDs with this provider. You should consider whether you understand how CFDs work and whether you can afford to take the high risk of losing your money. Past performance is not necessarily indicative of future results. The value of investments may fall as well as rise and the investor may not get back the amount initially invested. This content is not intended for nor applicable to residents of the UK. Cryptocurrency CFDs and spread bets are restricted in the UK for all retail clients.

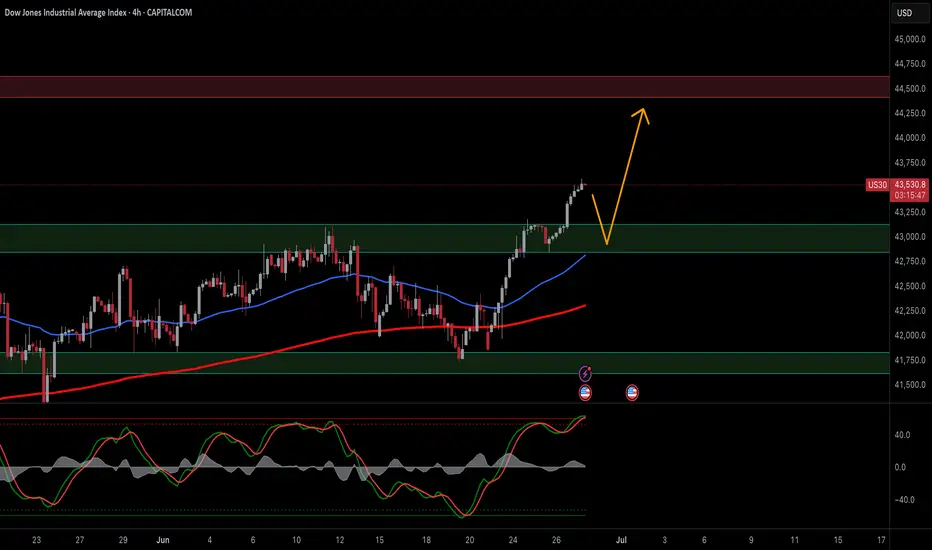
Dow Jones (US30) — Bullish Momentum, But a Retest AheadUS30 — Preparing for a Retest Before Higher Push
Subtitle: Technical Outlook — 27 June 2025
📈 Current Market Condition
The US30 index has shown strong bullish momentum, breaking above prior resistance around 43,000 and extending towards 43,500. Price is currently above both the 50 EMA (blue) and 200 EMA (red), reflecting a bullish structure. However, the Stochastic indicator signals overbought conditions, suggesting the index may be due for a pullback or consolidation before attempting to break higher into the 44,500–44,750 resistance zone.
🔑 Key Technical Highlights
Structure: Price broke above consolidation zone 42,750–43,000, retesting higher levels.
50 EMA (blue): Positioned near 42,750, acting as dynamic support.
200 EMA (red): Below at 42,200, major trend support.
Stochastic: Overbought — risk of a short-term correction or sideways move before continuation.
Resistance: Major resistance at 44,500–44,750.
Support: Immediate support at 43,000–43,250, deeper at 42,500.
📝 Trade Plan
Bullish Breakout (Long)
Trigger: Retest and hold of 43,000–43,250 zone with bullish confirmation (e.g. bullish engulfing, hammer).
Target: 44,500 / 44,75
Stop-loss: Below 42,900
Bearish Rejection (Short)
Trigger: Strong rejection from 44,500 with bearish reversal pattern.
Target: 43,250 / 42,750
Stop-loss: Above 44,700
Dip Buy
Trigger: Price tests 42,750 (50 EMA) and shows bullish reversal.
Target: 43,500 / 44,500
Stop-loss: Below 42,500
⚠️ Risk Management Note
US30 is trading in extended conditions, so chasing price here carries risk of getting caught in a pullback. Use staggered entries and adjust position size relative to volatility. Watch out for upcoming macroeconomic releases that could trigger sharp moves.
If you found this analysis valuable, kindly consider boosting and following for more updates.
Disclaimer: This content is intended for educational purposes only and does not constitute financial advice.
US30 at small resistanceUS30 at small resistance:
as I counter these wave we are in wave 5. it might be goes up to the maim trend Line in previous analysis.

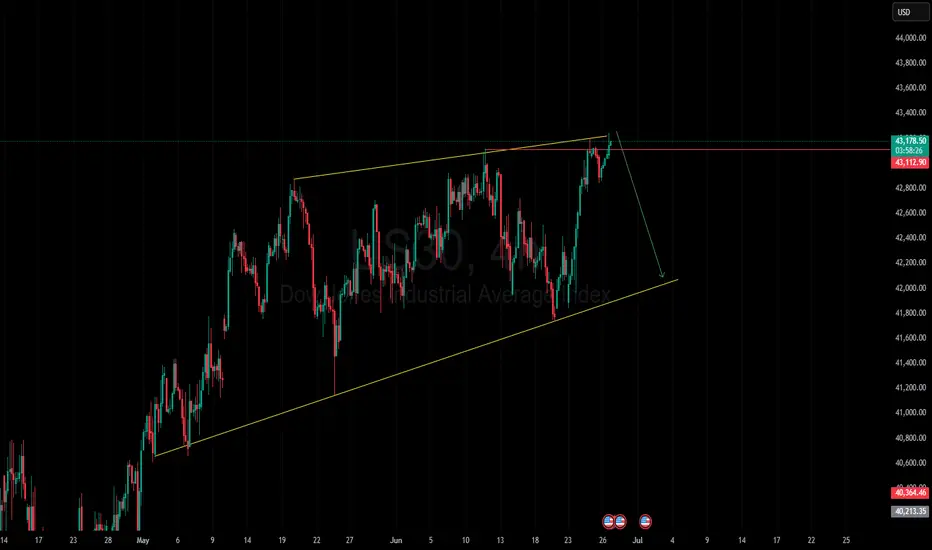
The Dow Jones index is at the channel’s ceiling.The Dow Jones index, upon reaching the channel’s ceiling, shows weakness and lacks the ability to break out from a price action and candlestick perspective. I expect the price to reach near the channel’s floor in a downward trend.
17:30
BLACKBULL:US30
Dow Jones Entryprice already was reacting off of a Order Block formed on the one hour, so i got down to the m5 and started searching for an entry, unluckily i lost the good one but there is still the possibility to do something good and safe like this.
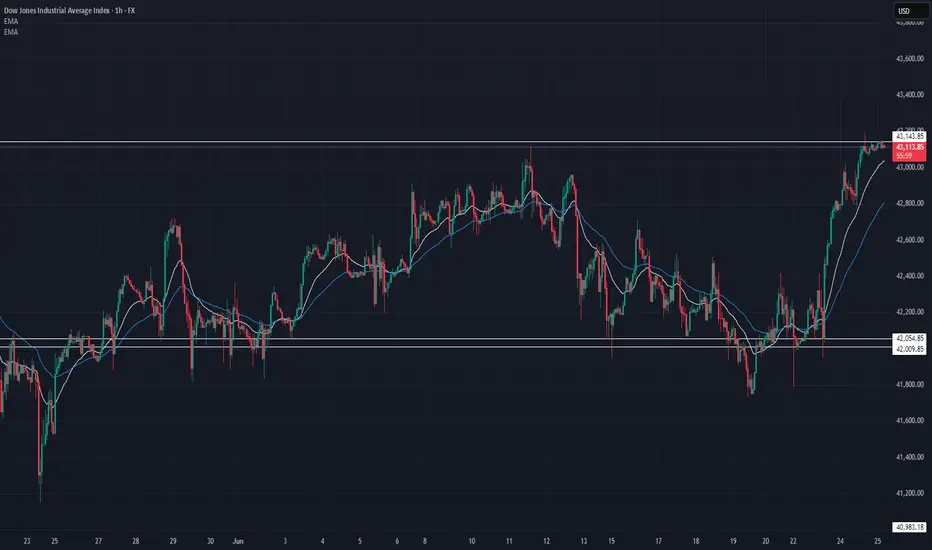
US30 Technical Outlook – 06/25/2025📍 US30 Technical Outlook – 06/25/2025
Big move! 🚀 Price broke out of the 42,054–42,100 consolidation and rallied aggressively into the key 43,100–43,150 resistance zone.
🧠 Key Observations:
Clean bullish breakout above 42,100 ✅
Price now sitting at 43,120–43,150 supply 🛑
EMAs sharply turned bullish (42,808 and 43,038 levels)
📊 Key Price Zones:
🔼 Major Resistance: 43,150 → 43,300
🔽 Support: 42,800 → 42,600 → 42,100
📈 Trade Setup Ideas:
🔹 Long Bias:
Pullback into 42,800–42,600 support
→ Look for bullish structure & continuation signals
→ Target: 43,150 → 43,300
🔻 Short Bias:
Look for strong rejection candles at 43,150–43,300
→ Intraday scalp short back toward 42,800
→ Break below 42,800 could target 42,600 or even 42,100
‼️ Momentum is clearly bullish for now, but this is a major supply zone so caution on chasing late longs.