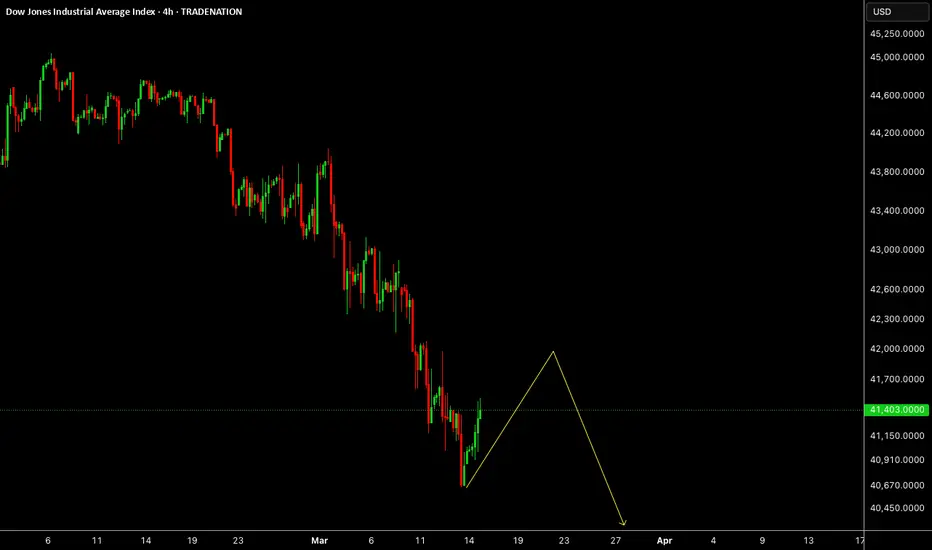
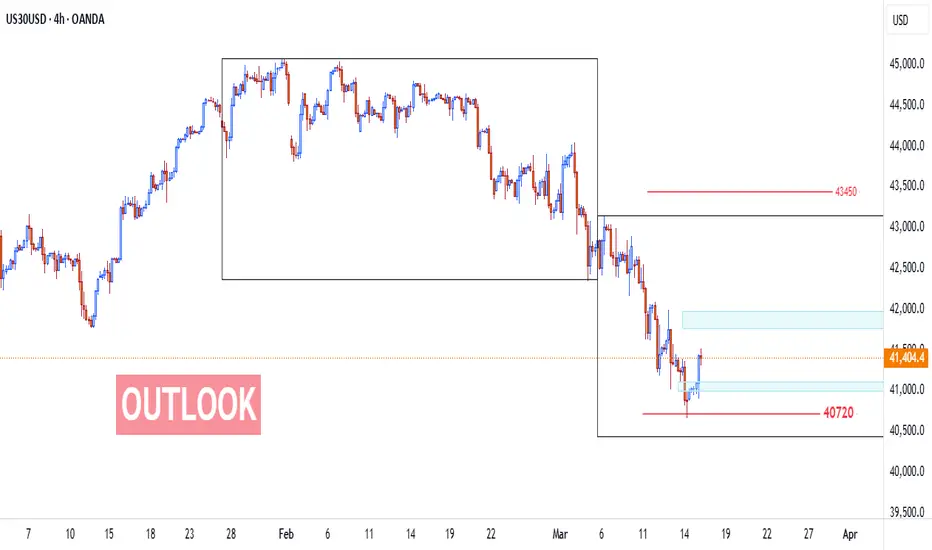
US30US30 isn't ready for us to go back up yet, we need small correction before last drop and then we will look for buys.
Disclosure: We are part of Trade Nation's Influencer program and receive a monthly fee for using their TradingView charts in our analysis.
DOW trade ideas
US30 Falling Wedge Breakout Setup – Bullish Momentum Building?📊 US30 (Dow Jones) Falling Wedge | Bullish Breakout Incoming? 🚀
🔍 Chart Analysis:
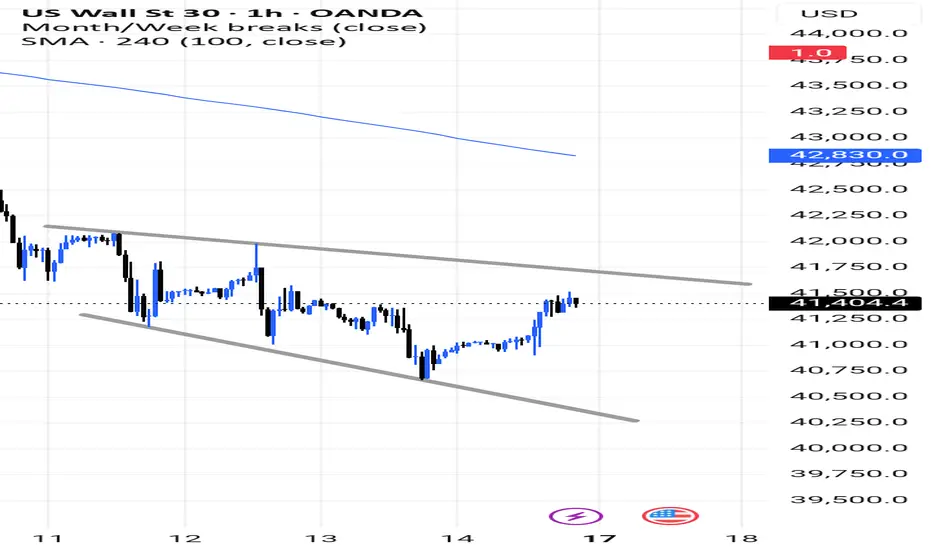
US30 is currently trading within a falling wedge pattern on the 1-hour timeframe. This formation typically signals a potential bullish breakout as selling pressure weakens.
📈 Key Levels to Watch:
✅ Breakout Zone: ~41,600 (upper wedge resistance)
✅ Next Resistance: 42,830 (100 SMA on 4H timeframe)
✅ Support: 40,800 (lower wedge support)
🎯 Trade Idea:
A confirmed breakout above 41,600 with strong volume could push price toward 42,830 and beyond.
Failure to break out may result in further consolidation within the wedge before a breakout attempt.
📢 What’s Your Take?
Do you see a breakout happening soon, or will US30 remain stuck in this wedge a bit longer? Drop your thoughts in the comments!
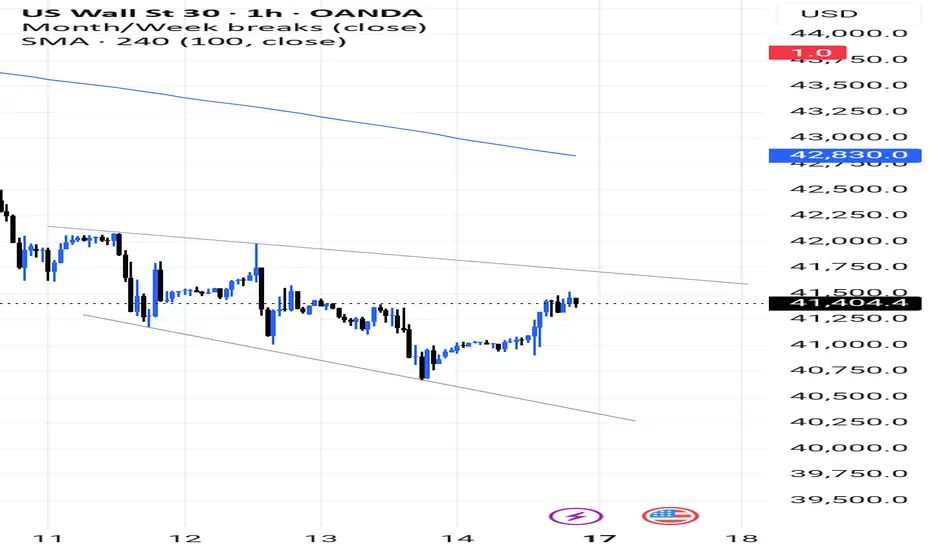
US30 Falling Wedge Breakout Setup – Bullish Momentum Building?📊 US30 (Dow Jones) Falling Wedge | Bullish Breakout Incoming? 🚀
🔍 Chart Analysis:
US30 is currently trading within a falling wedge pattern on the 1-hour timeframe. This formation typically signals a potential bullish breakout as selling pressure weakens.
📈 Key Levels to Watch:
✅ Breakout Zone: ~41,600 (upper wedge resistance)
✅ Next Resistance: 42,830 (100 SMA on 4H timeframe)
✅ Support: 40,800 (lower wedge support)
🎯 Trade Idea:
A confirmed breakout above 41,600 with strong volume could push price toward 42,830 and beyond.
Failure to break out may result in further consolidation within the wedge before a breakout attempt.
📢 What’s Your Take?
Do you see a breakout happening soon, or will US30 remain stuck in this wedge a bit longer? Drop your thoughts in the comments!
SMC. Long term buy pattern. -25%The order block below the liquidity level its a high probability point of interest for the buyers to take control of the market. Therefore, to execute we have to break down to the lower time frame and wait for the price to change the character for confirmation.

Dow JonesDOW JONES SPOT PRICE
MTF Analysis Price Time Frame Trend
Dow JonesYearly Demand 37,779 HTF UP
Dow Jones 6 Month Demand 36,952 HTF UP
Dow JonesQtrly Demand BUFL 40,077 HTF UP
38,269
Dow JonesMonthly Demand 40,077 MTF Down
Dow JonesWeekly Demand 39,628 MTF Down
Dow JonesDaily Demand DMIP 40,077 MTF Down
39,927
Dow Jones 240 M 39,027 LTF Down
Dow Jones 180 M 38,704 LTF Down
Dow Jones 120 M LTF Down
Dow Jones 60 M LTF Down
38,866
39,021
ENTRY -1 Long 39,628
SL 39,021
RISK 607
Target as per Entry 44,575
RR 8
Last High 44,575
Last Low 37,612

US30; Heikin Ashi Trade IdeaPEPPERSTONE:US30
In this video, I’ll be sharing my analysis of US30, using my unique Heikin Ashi strategy. I’ll walk you through the reasoning behind my trade setup and highlight key areas where I’m anticipating potential opportunities.
I’m always happy to receive any feedback.
Like, share and comment! ❤️
Thank you for watching my videos! 🙏

Short buy retrace to 42420 areaShort buy as the recession is increasing. I like the profit take at 42420 and sell at 42425 area

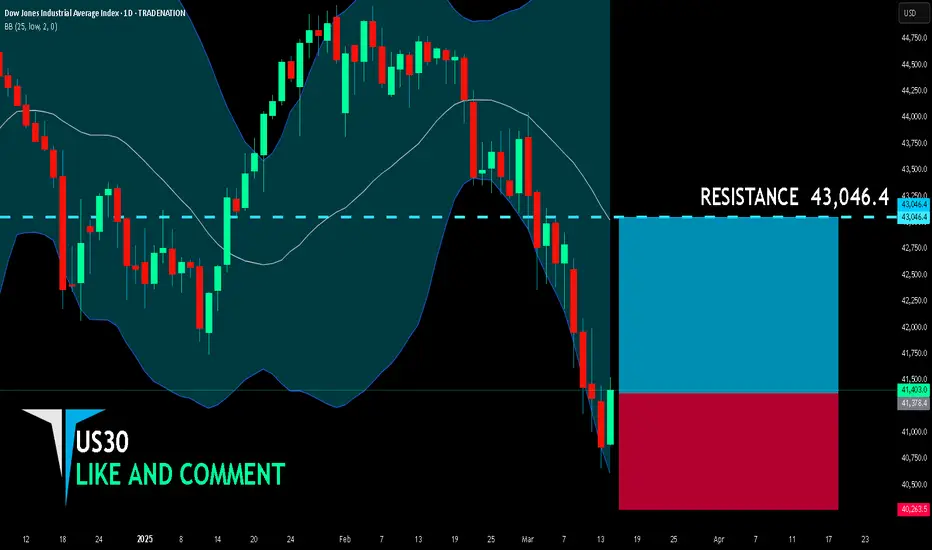
US30 BULLS WILL DOMINATE THE MARKET|LONG
US30 SIGNAL
Trade Direction: long
Entry Level: 41,378.4
Target Level: 43,046.4
Stop Loss: 40,263.5
RISK PROFILE
Risk level: medium
Suggested risk: 1%
Timeframe: 1D
Disclosure: I am part of Trade Nation's Influencer program and receive a monthly fee for using their TradingView charts in my analysis.
US3O 4H #DOWJONES – Key Levels & Trade Setups
🔻 Sell Setup: If price fails to hold above resistance, targeting 39400.
🔹 Risky Buy: If no lower low forms, possible buy with reduced size.
🚀 Bullish Confirmation: Break & retest of 41760 activates 42800 → 43000 → 44300.
⚡ Market conditions favor quick reactions—stay sharp!
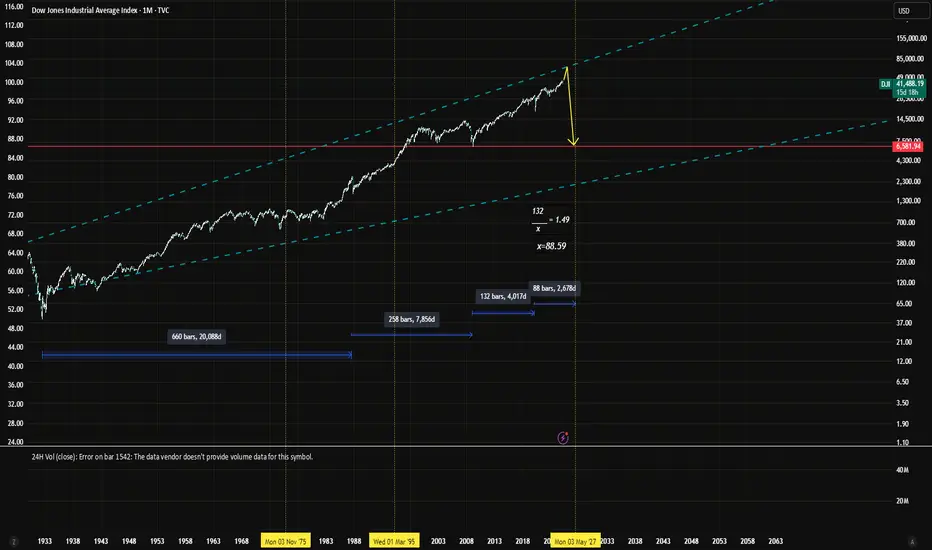
Major Correction $DJI 2027Using previous dates of major market corrections to try and determine the next market correction (crash). Using major crashes I concluded the amount of bars it took from one correction to the next, and created a regression equation to conclude the next predicted market crash.
660/258 = 2.55
258/132 = 1.95
132/x = x
2.55
1.95
≈0.7647
1.95×0.7647≈1.49
132/x = 1.49
x≈88.59
x= 88 Bars +-1
= Monday May 3rd 2027
This is just an idea, does not hold much weight, just thought I would publish to keep a record of my idea.
appreciate any thoughts or comments.
US30 Next week trading scenarioSome time I trade in US30 , and gets the good profit. DJ was in range since few weeks and now have broken the range down side... i am expecting further drop in the stock.

US30 Shorts US30 broke below weekly support so I’ll continue looking for sells. I’d look for sells around the 41,800 area to push towards the 40,200-40,000 area.
US30 - Testing Key Resistance.How I see it:
US30 is testing a key confluence of resistance.
A break and hold above key resistance-
Potential "LONG" Targets:
TP 1 = 41948.00
TP 2 = 42349.00
Rejections @ key resistance-
Potential "SHORT" Targets:
TP 1 = 40335.00
TP 2 = 39825.00
Thank you for taking the time to study my analysis.

$DJI with rear green dayRear green day for the Industrial Average. Weekly charts are at crucial support trend line since 2020 low. The daily chart printed green day on Friday, but the Double Top target is further down. If we don't see a meaningful reversal in the next couple of days, the bleeding will continue

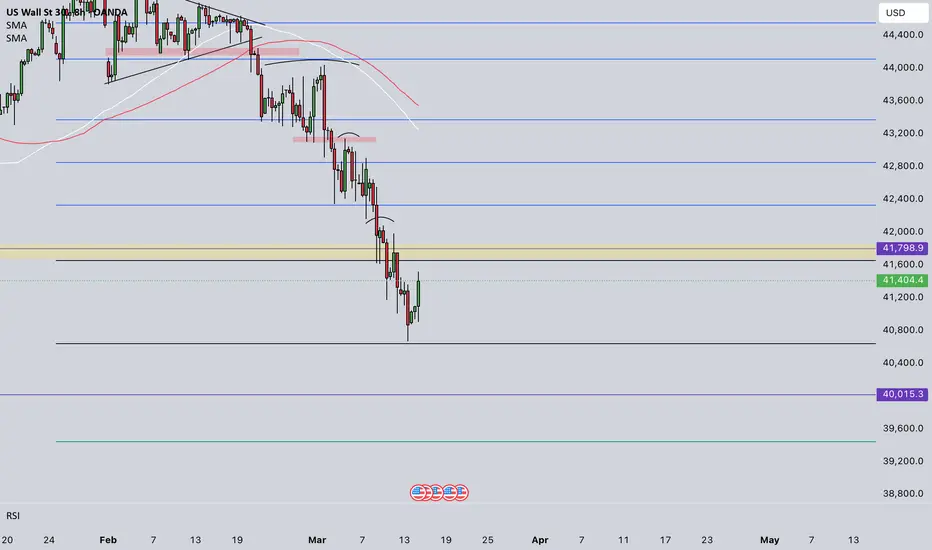
DowJones The Week Ahead 17th March '25Dow INTRADAY bearish & oversold capped by resistance at 200 DMA
This communication is for informational purposes only and should not be viewed as any form of recommendation as to a particular course of action or as investment advice. It is not intended as an offer or solicitation for the purchase or sale of any financial instrument or as an official confirmation of any transaction. Opinions, estimates and assumptions expressed herein are made as of the date of this communication and are subject to change without notice. This communication has been prepared based upon information, including market prices, data and other information, believed to be reliable; however, Trade Nation does not warrant its completeness or accuracy. All market prices and market data contained in or attached to this communication are indicative and subject to change without notice.

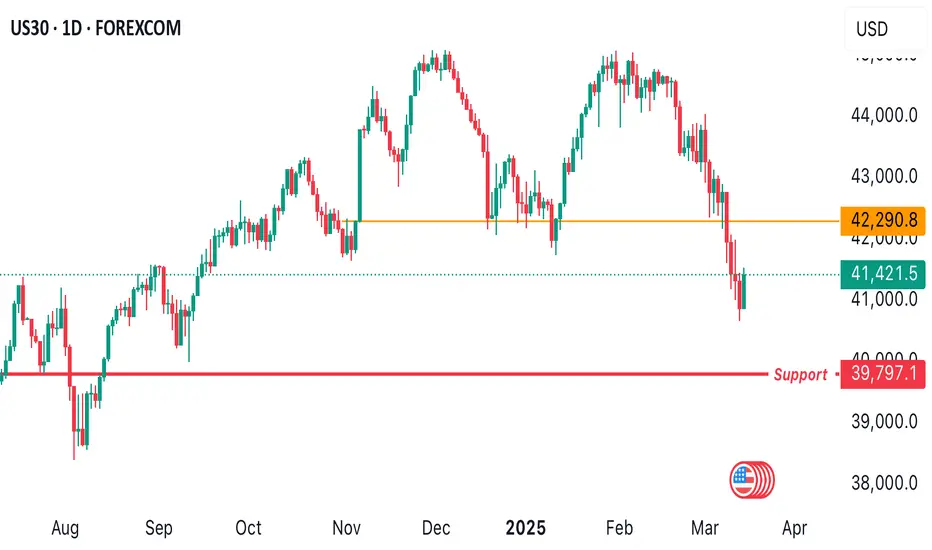
US30 BROKE NECKLINE!Price broke through the neckline area of 42290.8 what next do we expect from the daily timeframe? A further decline is expected to occur if we’d get some form of intraday retracement the next support level could be around 39797.1