Dow Jones in Long-Term Fibonacci Channel📈 Dow Jones Weekly | Fibonacci Channel in Play Since 2020
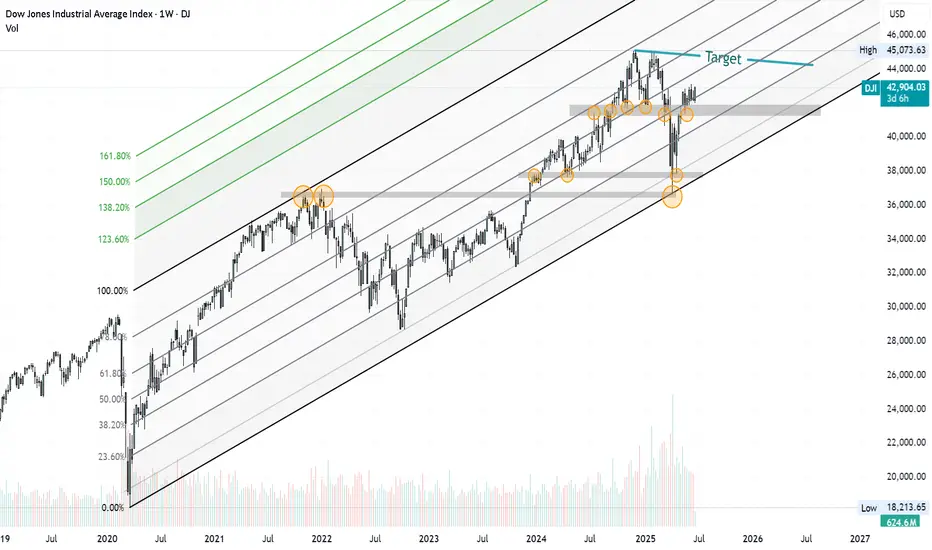
The Dow Jones Industrial Average has been trending within a well-defined Fibonacci channel on the weekly timeframe since the 2020 lows.
🔹 The price has consistently respected the Fibonacci levels as tilted support and resistance lines—a technical behavior that adds weight to this structure.
🔹 Three major horizontal support/resistance zones are clearly active and validated multiple times (highlighted on the chart).
🔹 Currently, the index is approaching the upper boundary of the downtrend resistance.
📌 The setup suggests it's only a matter of time before we retest this dynamic resistance zone, with potential rejection or breakout to follow.
🎯 Target zone around 45,000 as marked—aligning with previous highs and the upper resistance confluence.
Stay tuned—momentum is building.
#DowJones #DJI #FibonacciChannel #TechnicalAnalysis #WeeklyChart #StockMarket #Resistance #Support #Trendlines #ChartAnalysis #TradingView #US30 #MarketOutlook #PriceAction
DOW trade ideas
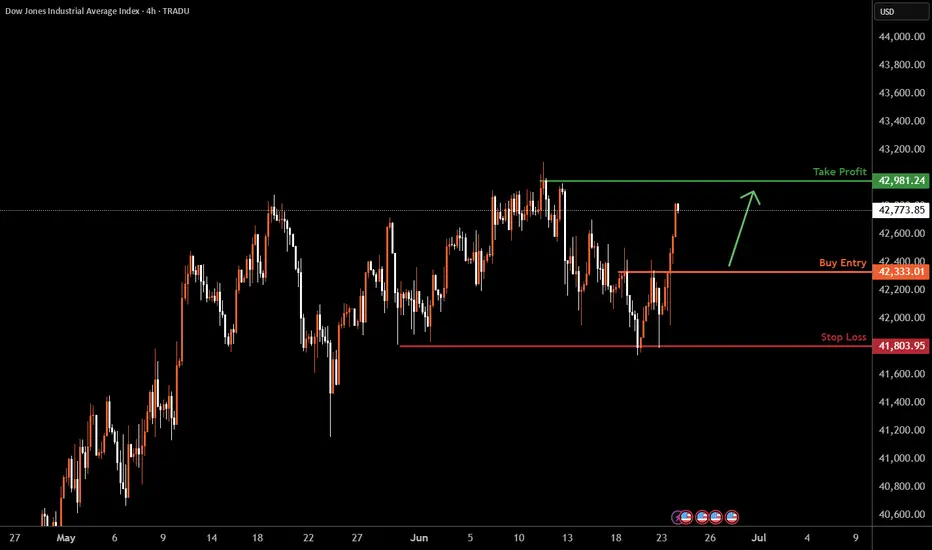
US30 H4 I Bullish Bounce Based on the H4 chart analysis, the price is falling toward our buy entry level at 42,333.01, a pullback support.
Our take profit is set at 42,981.24, a swing high resistance.
The stop loss is placed at 41,803.95, below the 38.2% Fib retracement.
High Risk Investment Warning
Trading Forex/CFDs on margin carries a high level of risk and may not be suitable for all investors. Leverage can work against you.
Stratos Markets Limited (tradu.com ):
CFDs are complex instruments and come with a high risk of losing money rapidly due to leverage. 63% of retail investor accounts lose money when trading CFDs with this provider. You should consider whether you understand how CFDs work and whether you can afford to take the high risk of losing your money.
Stratos Europe Ltd (tradu.com ):
CFDs are complex instruments and come with a high risk of losing money rapidly due to leverage. 63% of retail investor accounts lose money when trading CFDs with this provider. You should consider whether you understand how CFDs work and whether you can afford to take the high risk of losing your money.
Stratos Global LLC (tradu.com ):
Losses can exceed deposits.
Please be advised that the information presented on TradingView is provided to Tradu (‘Company’, ‘we’) by a third-party provider (‘TFA Global Pte Ltd’). Please be reminded that you are solely responsible for the trading decisions on your account. There is a very high degree of risk involved in trading. Any information and/or content is intended entirely for research, educational and informational purposes only and does not constitute investment or consultation advice or investment strategy. The information is not tailored to the investment needs of any specific person and therefore does not involve a consideration of any of the investment objectives, financial situation or needs of any viewer that may receive it. Kindly also note that past performance is not a reliable indicator of future results. Actual results may differ materially from those anticipated in forward-looking or past performance statements. We assume no liability as to the accuracy or completeness of any of the information and/or content provided herein and the Company cannot be held responsible for any omission, mistake nor for any loss or damage including without limitation to any loss of profit which may arise from reliance on any information supplied by TFA Global Pte Ltd.
The speaker(s) is neither an employee, agent nor representative of Tradu and is therefore acting independently. The opinions given are their own, constitute general market commentary, and do not constitute the opinion or advice of Tradu or any form of personal or investment advice. Tradu neither endorses nor guarantees offerings of third-party speakers, nor is Tradu responsible for the content, veracity or opinions of third-party speakers, presenters or participants.
US30 H4 AnalysisUS30 Showing a bullish Flag to 42,762. If it breaks this zone, Most probably can fly upto 44,000 and higher. Trading Analysis from 23-06-25 to 27-06-25. Take your risk under control and wait for market to break support or resistance on smaller time frame. Best of luck everyone and happy trading.🤗
Weekly Forex Outlook Sun.June.15.2025 - Fri.June.20.2025Like and Comments would be appreciated :D Not Financial Advice, Just my outlook/opinion

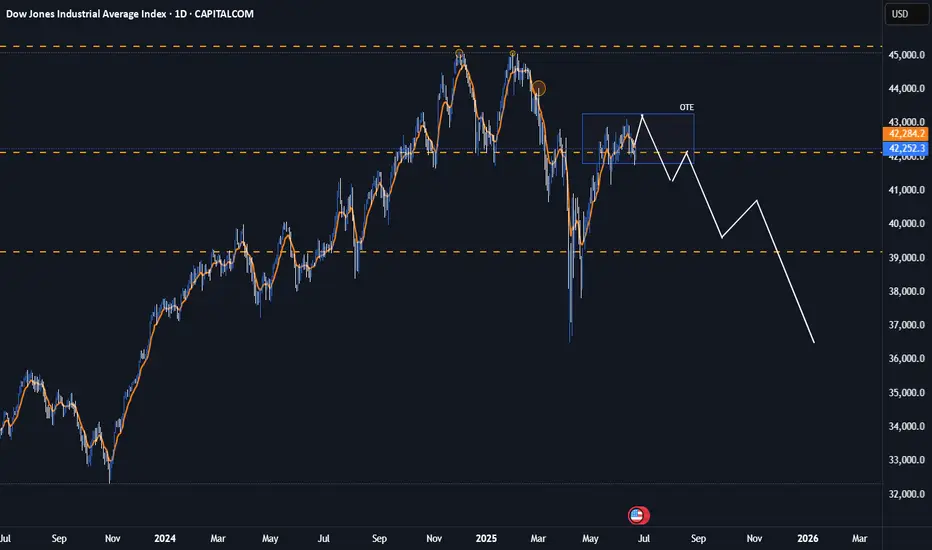
Dow Jones potential down side moveDow Jones is showing some sign of wanting to go short with also the potential dollar strength coming into the markets and the bond yield markets having a bullish trend for the last couple of months. Dow has reach a full fib extension and we could see some form of retracement continuation.
DJI SELLING BIAShello guys,
this is how i gonna act. upcoming months we can see downside in dow jones.
please keep in mind that trading is a risky so act wisely!

Us30 Key Levels on the Daily Timeframe – Quick Analysis:
🔴 Resistance Zones:
1. 42800 – 42950 🔺
• This area marked a strong top and rejected price multiple times
• If price returns to this zone, a strong rejection is likely
2. 42250 – 42400
• Previous correction area, may act as short-term resistance
• Useful zone to exit partial long positions if price bounces back
⸻
🟢 Support Zones:
1. 41700 – 41750 🧱
• Nearest support zone, price is currently close
• A break below this could trigger further downside
2. 41480 – 41550 🔻
• Medium support from a previous low (May)
• Breaking this opens downside toward 41000
3. 40700 – 40800
• Strong support from a major bottom
• A break here could open the way to 390 00–38000
⸻
📉 Chart Notes:
• Currently forming a potential double top near 42900
• The downtrend seems active as long as price stays below 42250–42400
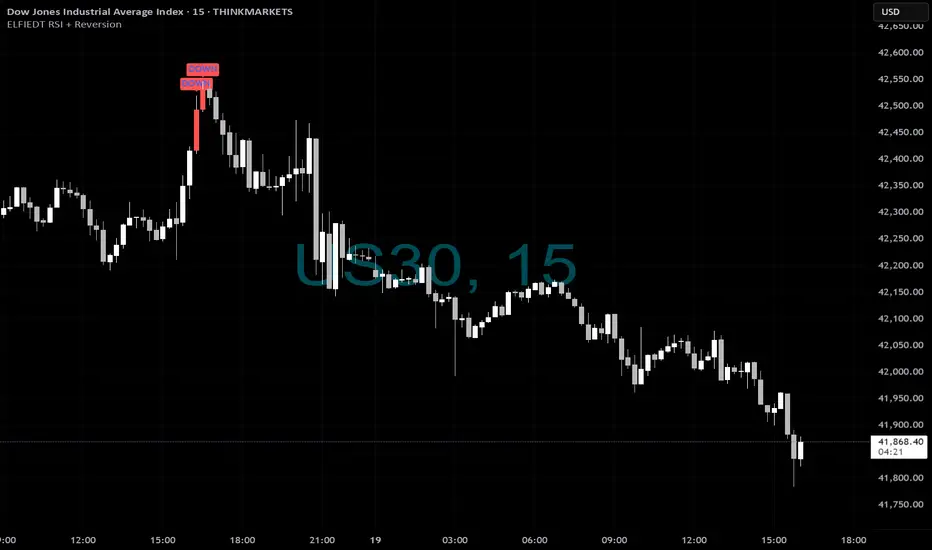
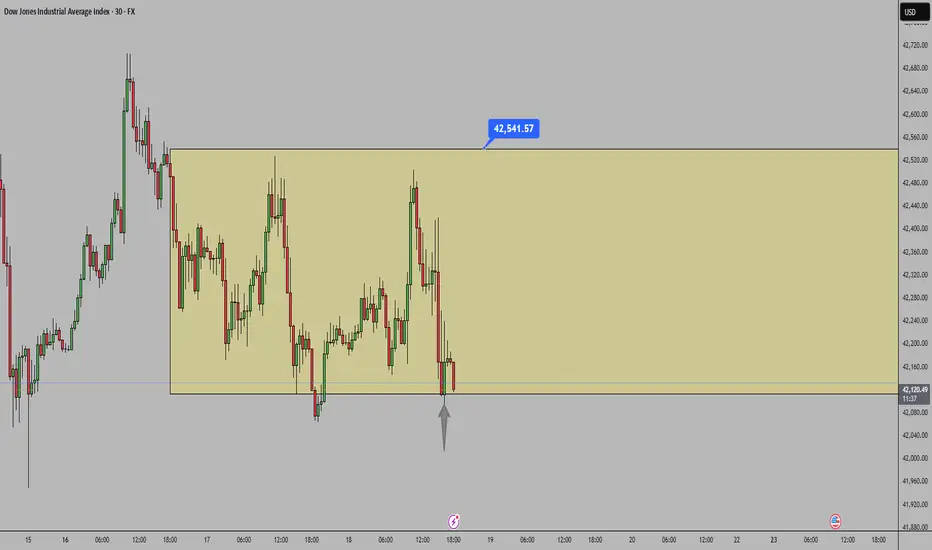
Yesterday DOW - Shorts🔻 US30 Reversal: How the Indicator Gave the Short from the Top
Yesterday, the ELFIEDT – X-REVERSION indicator gave stacked SELL signals near the very top of the move on US30 (15m chart) — before the full selloff began.
🧠 Here's how disciplined traders could have executed it step-by-step:
1️⃣ Signal Confirmation
A double “DOWN” label printed at the close of a large bullish candle.
This is where most retail traders are still buying — but the indicator identifies it as potential exhaustion.
2️⃣ Immediate Action Plan
Once the bar closed, a short trade could be entered at market or on a minor pullback.
✅ Stop-loss is always placed just above the signal candle’s high.
This setup offers minimal risk and sets up a great R:R profile.
3️⃣ Trade Progression
The next few candles confirmed rejection.
Even after some sideways chop, price continued lower — eventually giving up 400+ points from the signal area.
4️⃣ Why It Worked
Price was overextended.
RSI confirmed reversal (bearish momentum shift).
Signal printed on the close, giving live execution opportunity — no repainting.
✅ Key Lesson: The strongest trades with this system come when you follow the rules without hesitation. The signal doesn't lag — it prints at the very edge of emotion and momentum.
💡 Bonus Tip: If you trade other US indices like NAS100 or SPX at the same time — when they all print reversal signals simultaneously, the move is usually stronger.
📍 This was a textbook short setup using X-REVERSION.
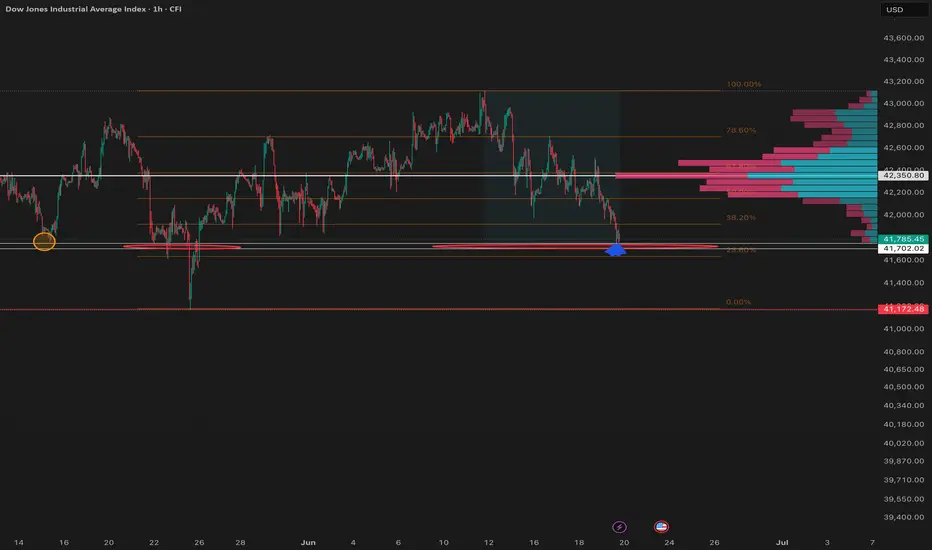
US30 Under Pressure: Possible Short Setup Brewing on the 4HI'm currently eyeing the US30 (Dow Jones Index) for a potential short opportunity based on multi-timeframe structure 📊.
🔍 Weekly Overview:
The weekly chart continues to show sustained pressure, with this week and last week both closing bearish. The sellers are clearly in control at the macro level. 🔻
📆 Daily & 4H Structure:
Drilling down to the daily and 4-hour charts, we can clearly see a break of structure (BOS). The 4H specifically is showing textbook signs of a bearish trend with lower highs and lower lows forming consecutively 🪜🔽.
🎯 Trade Plan:
I'm watching for a pullback into equilibrium, ideally near the 50% level of the recent Fibonacci range. If price revisits that zone, I’ll be looking for short confirmations to ride the momentum back toward the previous lows, as marked on the chart. 🧠💸.

US30US‑30 (Dow Jones) – Bullish Setup Based on COT
Large speculators added +1,319 contracts to net long exposure in mini futures, now at +7,114. Consolidated DJIA futures show similar sentiment at +5,795 net long, above recent averages. This indicates sustained bullish bias.

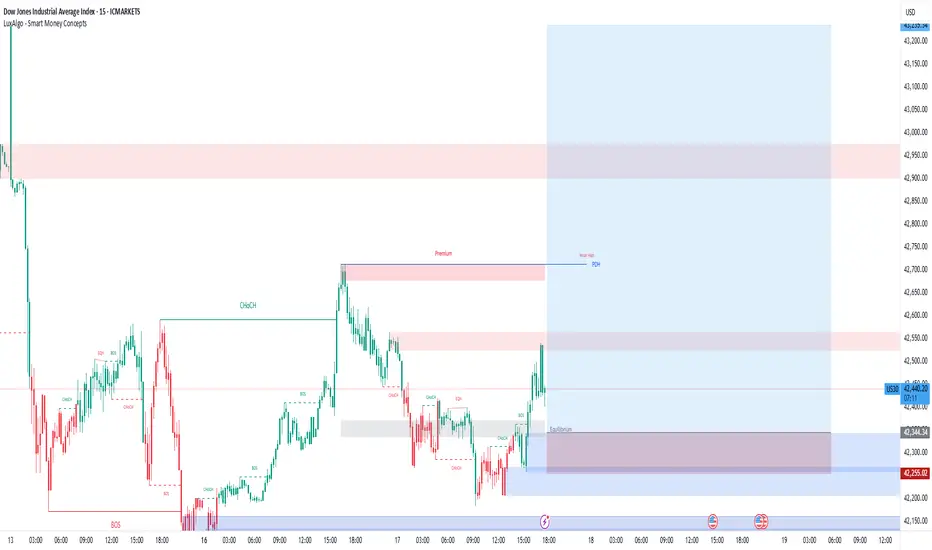
SMC 1-10Let's see if this trade goes well.
Testing the Luxalgo SMC indicator.
We now have the highest and lowest CHoCH for buys.
2 ob for buys.
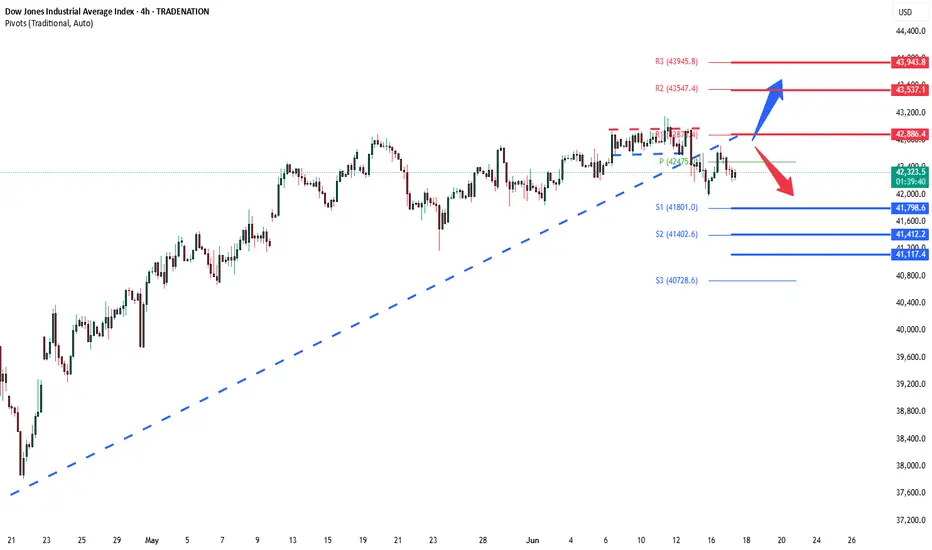
DowJones resistance retest at 42880Key Support and Resistance Levels
Resistance Level 1: 42880
Resistance Level 2: 43540
Resistance Level 3: 42940
Support Level 1: 41800
Support Level 2: 41400
Support Level 3: 41100
This communication is for informational purposes only and should not be viewed as any form of recommendation as to a particular course of action or as investment advice. It is not intended as an offer or solicitation for the purchase or sale of any financial instrument or as an official confirmation of any transaction. Opinions, estimates and assumptions expressed herein are made as of the date of this communication and are subject to change without notice. This communication has been prepared based upon information, including market prices, data and other information, believed to be reliable; however, Trade Nation does not warrant its completeness or accuracy. All market prices and market data contained in or attached to this communication are indicative and subject to change without notice.

US30 Technical Overview – 06/17/2025📍 US30 Technical Overview – 06/17/2025
The Dow is consolidating below resistance after failing to reclaim the 42,424 EMA zone. Sellers are defending this level, while 42,102 remains a key support.
🧠 Key Observations:
EMA rejection near 42,424 🔄
Lower highs forming = short-term bearish bias
Demand still holding at 42,102
📊 Price Zones:
🔼 Resistance: 42,424 → 42,605
🔽 Support: 42,102 → 41,947
📈 Trade Setup Ideas:
🔹 Long Bias:
Break and hold above 42,424
→ Target: 42,605 → 42,793
🔻 Short Bias:
Break below 42,102
→ Target: 41,947 → 41,894
🎯 Price is currently between key levels—wait for a breakout before committing to direction!

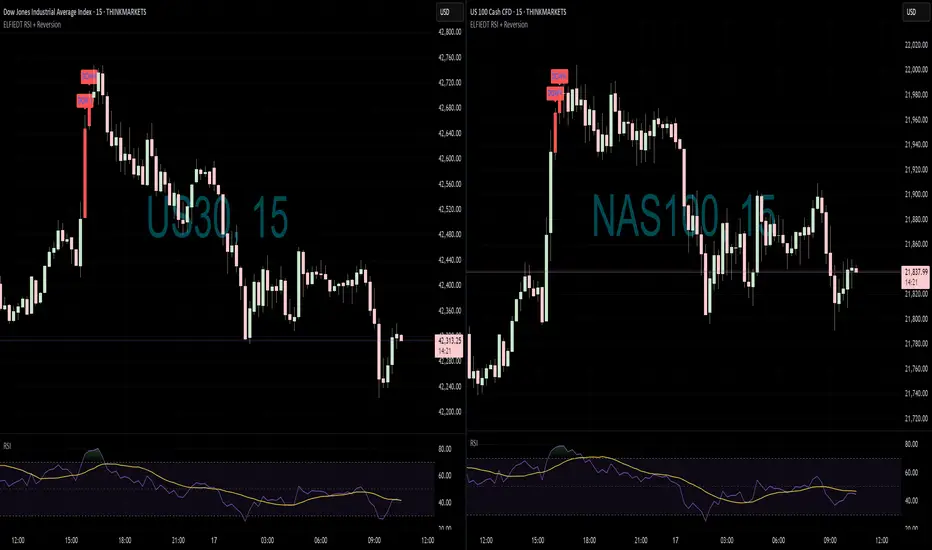
SHORTS - GOTTA LOVE IT!📊 Multi-Market Signal Alignment: US30 & NAS100 (15-Min)
📍 Both indices triggered clean SELL signals at their highs using the ELFIEDT – X-REVERSION indicator.
The signal printed at the close of the strongest bullish bar, which often marks exhaustion — and price quickly rejected from that level.
✅ US30 printed two stacked 'DOWN' signals — the first entry bar was perfect.
✅ NAS100 printed a nearly identical signal at the same time — showing excellent intermarket confluence.
🧠 Why this setup worked:
Price extended far above mean structure
RSI was stretched and reversed immediately after
Signal printed on a bullish candle before reversal — allowing you to catch the high
Both assets signaled at the same time — strengthening the conviction
📌 Pro Tip: When multiple correlated instruments print reversal signals at the same time (especially indices or FX pairs), it often confirms institutional rotation. These trades offer great risk-reward if you stick to the plan.
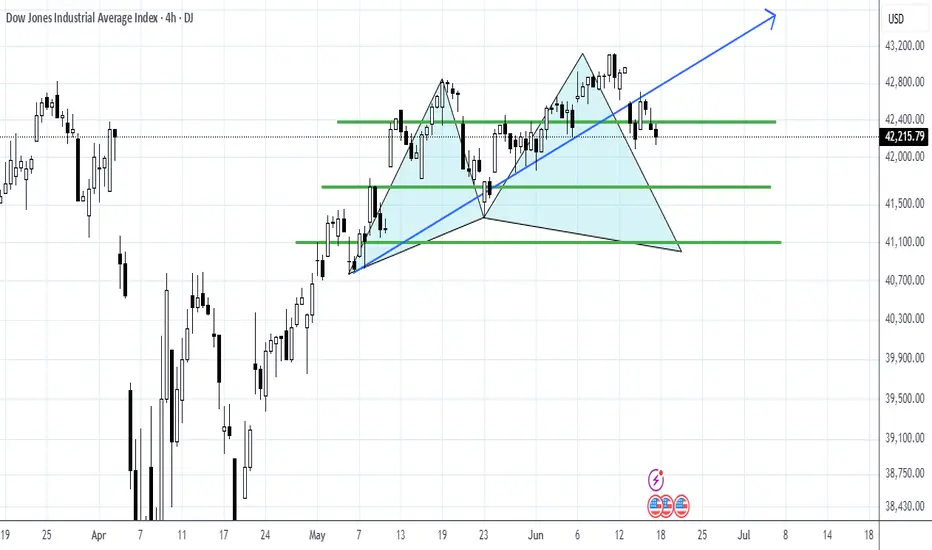
US30 17 JUNE 2025 TRADE IDEA Based on the current US30 (Dow Jones Industrial Average Index) chart, the price action shows a strong bullish trend within a well-defined ascending channel that spans from mid-2023 through 2025. The index recently bounced off the mid-range zone near the 41,185 – 41,940 support levels and is now approaching a potential continuation move toward the upper resistance zone between 44,472 and 44,620. This area represents a key supply zone where price previously rejected, suggesting potential hesitation or reversal upon retest. The recent higher lows and breakout from a corrective phase indicate strong bullish structure, supported by institutional order flow—possibly driven by buy-side liquidity targeting previous highs. If the price maintains above 41,681 and creates a successful retest (break and retest confirmation), it offers a compelling opportunity for long positions aiming toward the channel top or key resistance.
From a Smart Money Concept (SMC) perspective, the market structure shifted bullish after sweeping liquidity below April's low followed by a clear Change of Character (ChoCH) and Break of Structure (BOS) to the upside. This shows strong accumulation by institutions. The demand zone formed around 41,185 – 41,681 can be considered a reaccumulation block and a potential entry point for buys on retracement.
Fundamental Context:
This week's movement must also be interpreted in light of broader geopolitical tensions, particularly the ongoing conflict between Iran and Israel, which has implications on investor sentiment and global market volatility. Heightened tensions in the Middle East typically cause oil prices to spike and introduce risk-off sentiment. However, the Dow’s resilience suggests that U.S. investors may currently be pricing in confidence in the U.S. economy, strong corporate earnings, or the expectation that the Fed will maintain or cut interest rates if geopolitical shocks affect global demand. If tensions escalate further into military confrontation or affect major oil supply chains, we could see a temporary pullback or risk aversion across equities—including US30.
Trade Idea:
Bias: Bullish continuation (if current structure holds).
Entry Zone: Around 41,940–42,100 on a retest with bullish confirmation.
Stop Loss: Below 41,185 (structure invalidation).
Take Profit: First TP at 44,472; extended TP at 44,620 or channel top.
Invalidation: Break below 41,185 with a daily close.
In conclusion, unless the conflict between Iran and Israel leads to a sharp risk-off move, US30 appears poised for bullish continuation driven by technical momentum, strong market structure, and medium-term economic optimism. However, traders should monitor headlines closely, as escalation in the Middle East could introduce significant volatility.

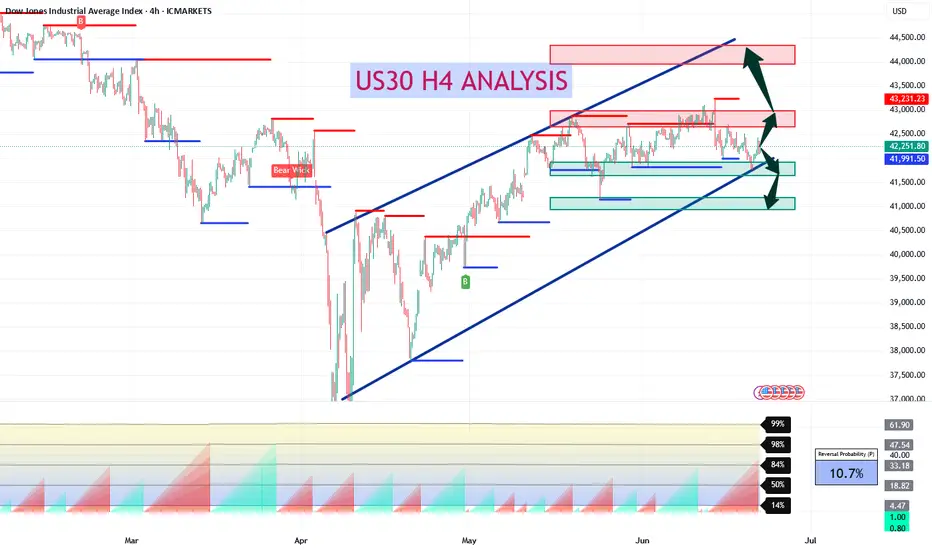
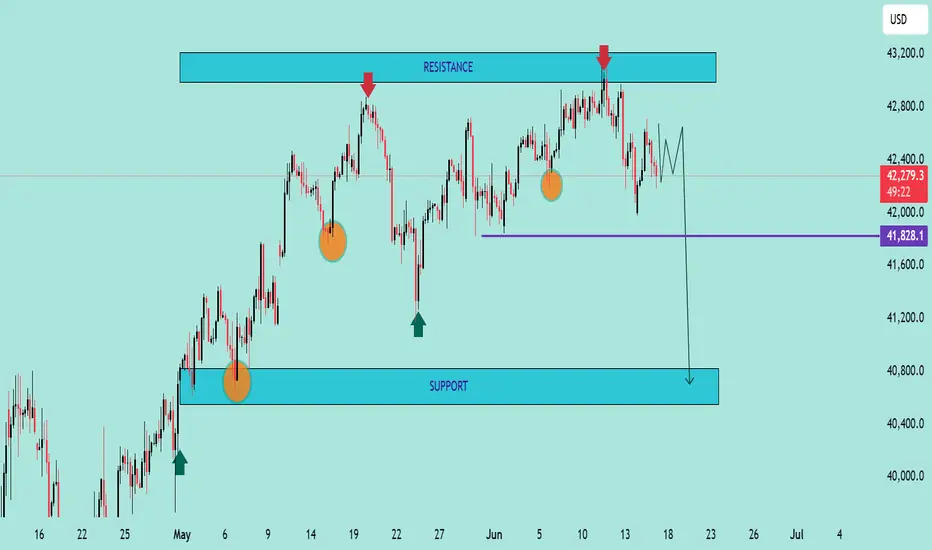
US30 – Bearish Setup Below Resistance Zone US30 – Bearish Setup Below Resistance Zone 🚨🟥
The US30 index is exhibiting signs of bearish momentum after repeated rejections from the key resistance zone near 43,200. Let's break down the technical picture:
🔍 Technical Analysis
📌 Resistance Zone (🟥 43,200 area)
Price was rejected twice from this resistance (marked by red arrows), showing strong seller presence.
Bearish candlesticks followed each touch, confirming exhaustion near this level.
📌 Support Zone (🟦 40,800 area)
The area around 40,800 has acted as a strong demand zone in the past (highlighted with green arrows and orange circles).
Price might revisit this area if current bearish structure continues.
📌 Intermediate Support (🟪 41,828)
This level serves as short-term support.
If broken, it could accelerate the decline toward the major support.
📌 Market Structure
Lower highs forming after each bounce indicate weakening bullish strength.
A potential bearish breakout pattern is forming (highlighted by the projected path).
📈 Conclusion & Trade Outlook
Bias: Bearish 📉
Trigger: Break below 41,828 support
Target: 40,800 zone
Invalidation: Break and close above 43,200 resistance
DOW30/US30 - TIME TO MAKE MILLIONSTeam, Time to LONG SMALL POSTION ON US30 now
ADD DOUBLE UP at 41950-41800 - kill them if they drop this price range
Target 1 at 42400-42440
TAKE 50-70% volume for profit once it hit 1st target
BRING STOP LOSS TO BE and the remaning for 2nd target.

Us30,Nas& Bitcoin are selling today As you can see that yesterday buy closed daily candle at 42711.2 forming a resistance. I am 100% sure that bears are taking control as my daily timeframe and weekly time frame also showing signs of market sells.for today my target will be at 41978.5 if it pushes low I will set sell order at 4Hr time frame to 41931

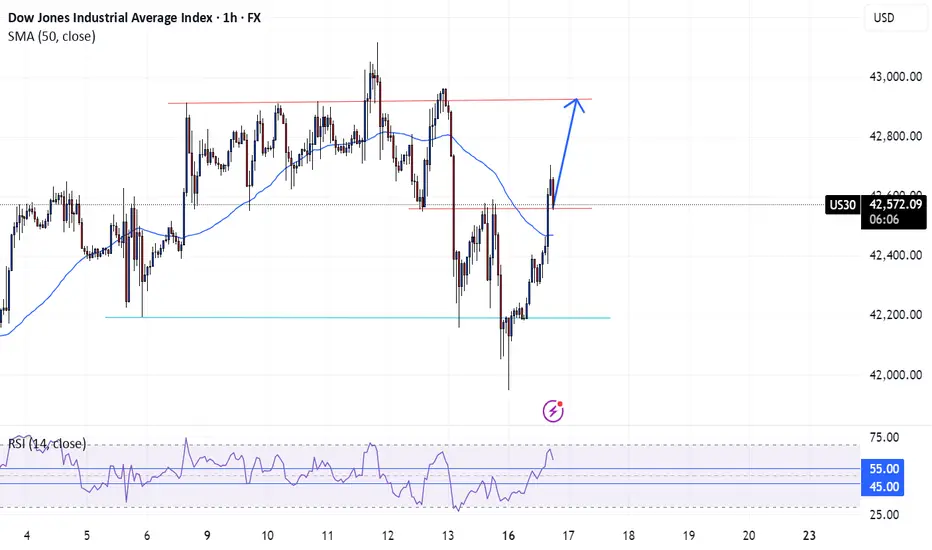
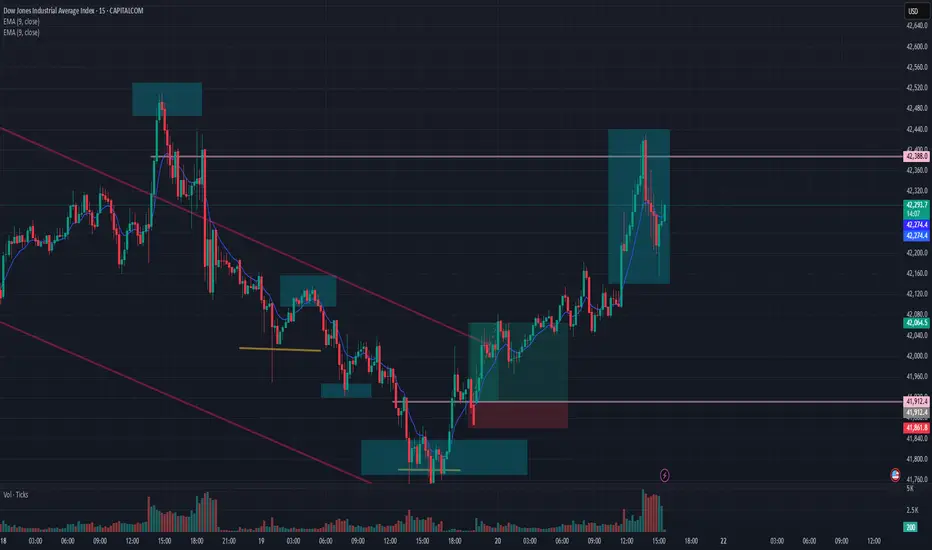
US30 Long OpportunityUS30 had a break out to the upside from $42560 and we are not seeing a potentially retracement to the break and retest level where we can expect a further jump to the upside. Seeing bullish structure on the 15 min and higher timeframes with confluence at the breakout.
Price is currently above the 50 SMA on all timeframes above the 15min and momentum is bullish per the RSI trading above the 55 level, adding to the bullish confluence
Looking to the ride the bullish wave from $42560 to $42920 where currently resistance level is sitting