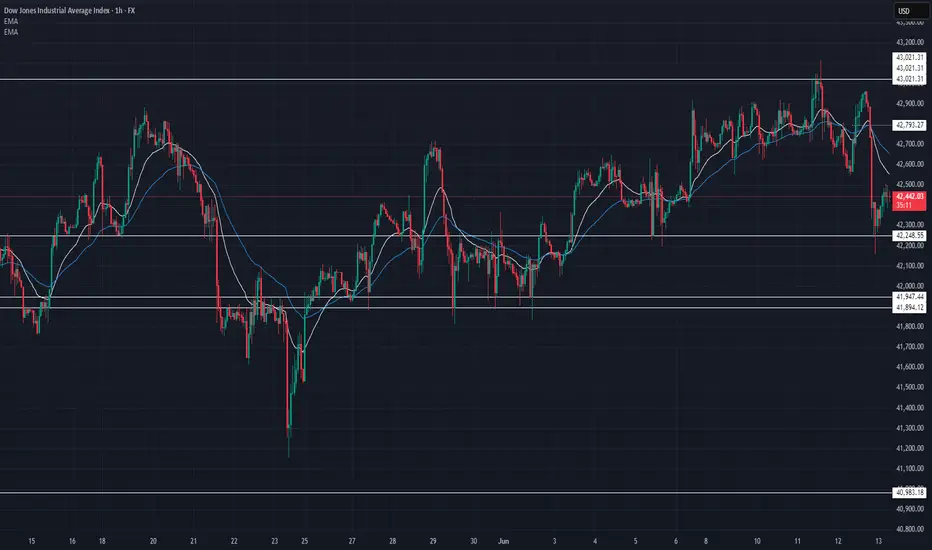
US30 Trade Update – 06/16/2025🚨 US30 Trade Update – 06/16/2025 🚨
📊 Market Structure & Key Levels
US30 is rebounding after holding above the 42,102 demand zone. Price is now reclaiming EMAs with short-term bullish momentum, approaching the 42,605 resistance level.
✅ Key Observations:
Strong bounce off 42,102 ✅
Reclaimed 42,341 EMA support
Bullish momentum building toward 42,605
📍 Key Levels:
Resistance: 42,605 → 42,793
Support: 42,248 → 42,102
🎯 Trade Plan:
🔹 Long Setup:
Buy above 42,605
→ Target: 42,793 → 43,021
🔻 Short Setup:
Breakdown below 42,248
→ Target: 42,102 → 41,947
⚠️ Market flipping short-term bullish – watch for breakout and confirmation above 42,605!
DOW trade ideas
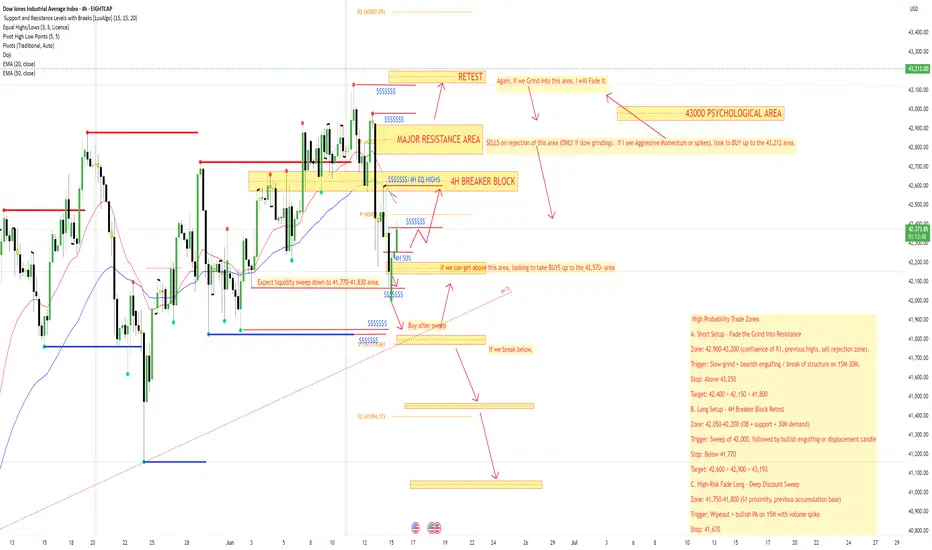
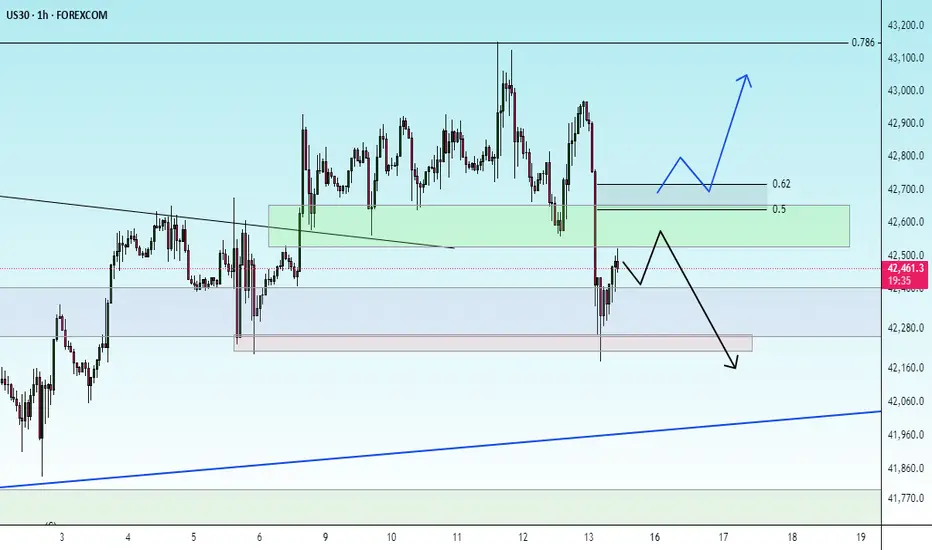
This weeks #US30 outlook. High Probability Trade Zones
A. Short Setup – Fade the Grind Into Resistance
Zone: 42,900–43,200 (confluence of R1, previous highs, sell rejection zone).
Trigger: Slow grind + bearish engulfing / break of structure on 15M–30M.
Stop: Above 43,250
Target: 42,400 > 42,150 > 41,800
B. Long Setup – 4H Breaker Block Retest
Zone: 42,050–42,200 (OB + support + 30M demand)
Trigger: Sweep of 42,000, followed by bullish engulfing or displacement candle
Stop: Below 41,770
Target: 42,600 > 42,900 > 43,193
C. High-Risk Fade Long – Deep Discount Sweep
Zone: 41,750–41,800 (S1 proximity, previous accumulation base)
Trigger: Wipeout + bullish PA on 15M with volume spike
Stop: 41,670
Target: 42,200 > 42,500
DOW/US30 - PATIENLY WAITING FOR THE ENTRY - DO NOT RUSHTeam, we are already entry LONG NAS100 EARLIER.
But with the DOW, be patience
- waiting for 42000-419600 - will be our first entry ranges
Then if market continue to fall further - this is our back up entry at 41480-41220 - DOUBLE UP to kill the market
OK, i did follow Israel and Iran story
I have spent 4-6 hours research and analyzing the market.
I prefer to carefully entry the market. I want to ensure my continue winning.
Sometimes if it not in the trading setup - DO NOT TRADE.. that part of the risk management
Check out my new video how I did not lose a single trade last 90 days
A lot of videos NEVER show their history trade, always show win this win that.. but no show the statement or data. But I provide real account, real data.
Look forward to provide you more trades in coming.

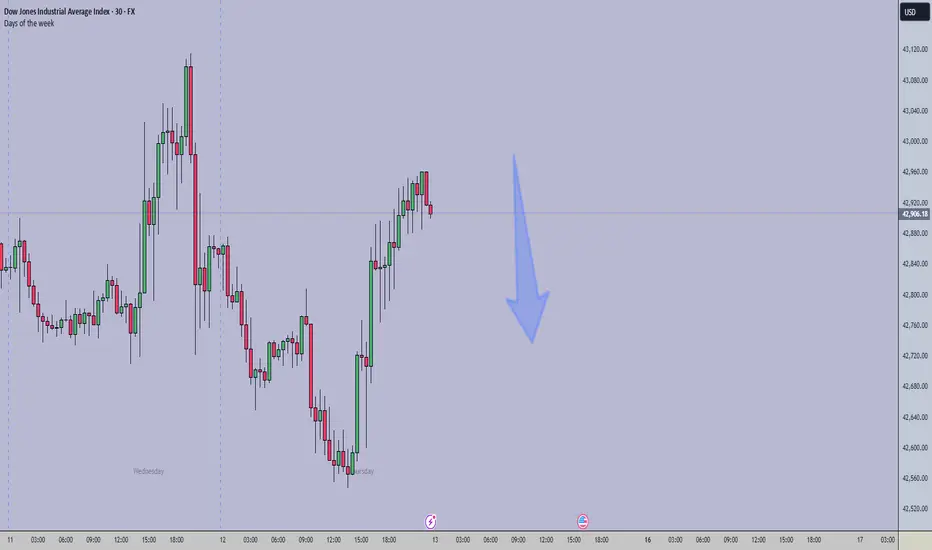
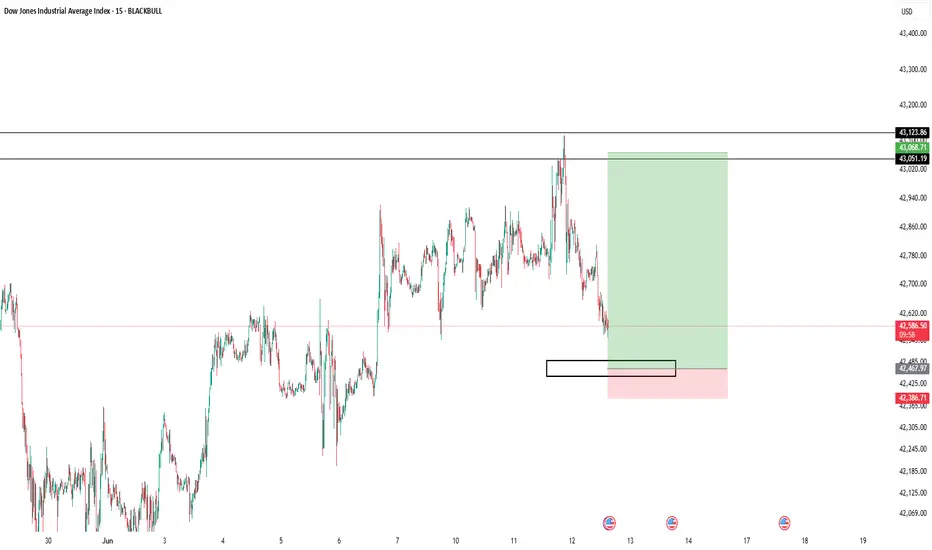
June 15 US30Good day people. Price is steadily starting to move downwards, before it does, I believe that it will push up a bit towards the 42,341 or 42,400 level. Those levels line up with my Fibonacci as well as my key areas so I believe it will be a perfect place to look for sells but only if:
Price breaks and retests a key area
Breaks structure around a key area
If it's happening inside of the NYC Sessions
And if this is on the 1m or 5m timeframe
Obviously like an Ex, price does what it wants. So, it can always go the other way or turn around earlier or later so be careful and cautious to see if price is creating new structure. And as long as you follow those four things above you can pretty much enter price anywhere (a kry level)

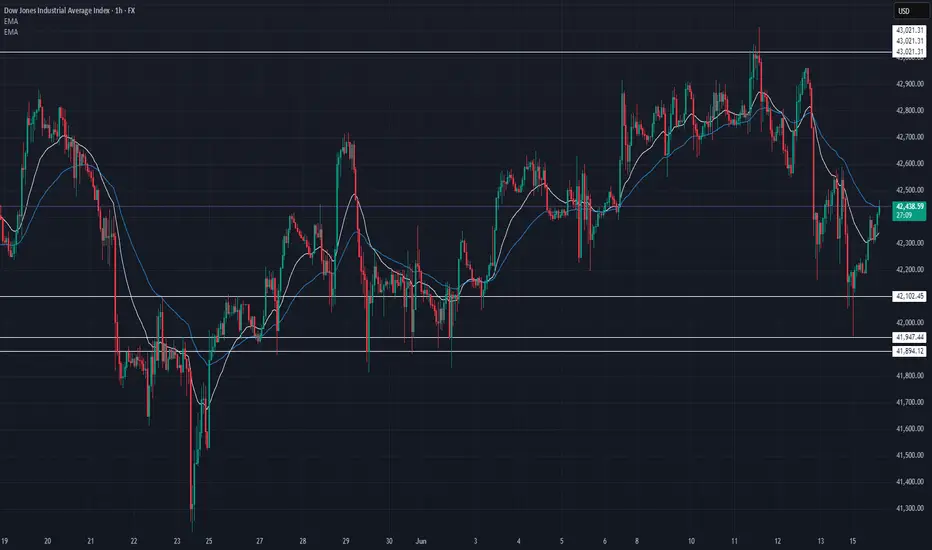
US30 Trade Update – 06/13/2025 🚨 US30 Trade Update – 06/13/2025 🚨
📊 Market Structure & Key Levels
US30 broke below the key support at 42,605 and continued to slide, tapping into the 42,248 demand zone. Price is currently rebounding off this level, but sellers remain in control under EMAs.
✅ Key Observations:
Failed to hold above 42,605 ❌
Strong selloff to 42,248 zone ✅
Below both EMAs → bearish pressure
📍 Key Levels:
Resistance: 42,605 → 42,793
Support: 42,248 → 41,947
🎯 Trade Plan:
🔹 Long Setup:
Buy above 42,605
→ Target: 42,793 → 43,021
🔻 Short Setup:
Breakdown below 42,248
→ Target: 41,947 → 41,894
⚠️ Market showing weakness – wait for retest or breakout to confirm next move!
US30(Dow Jones)The combination of the COT data showing a shift towards more short positions and the technical picture suggests that bearish momentum could continue. Sell/Short: Consider entering a short position at current market levels, ideally on any retracement or rally towards the resistance zone.
possibility of correctionAs long as the indicator below the green resistance range fluctuates, the continuation of the correction trend will be likely. With the consolidation above the resistance range, the continuation of the upward trend will be likely.
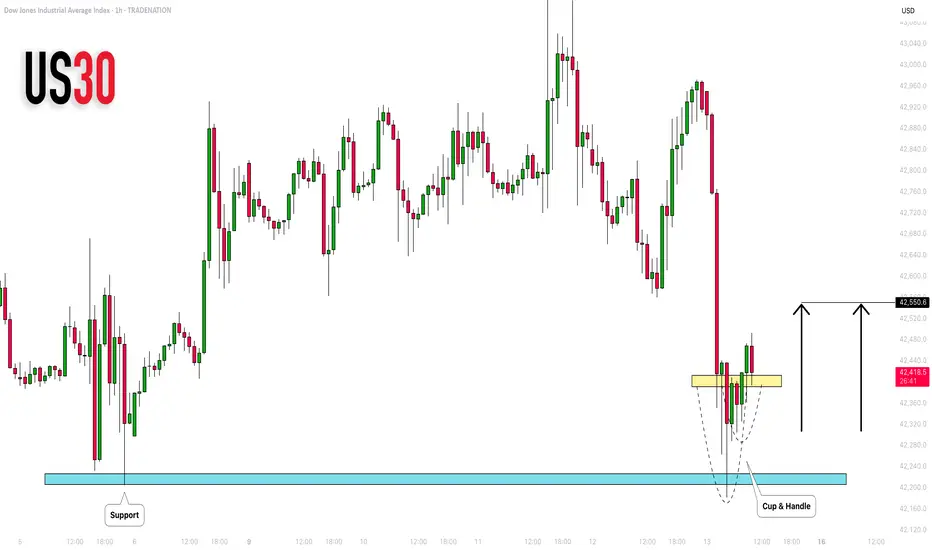
DOW JONES INDEX (US30): Pullback From Support
US30 shows some strength after a test of a key intraday support.
A cup and handle pattern on that and a violation of its neckline
indicate a local strength of the buyers.
I expect a pullback to 42550
❤️Please, support my work with like, thank you!❤️
I am part of Trade Nation's Influencer program and receive a monthly fee for using their TradingView charts in my analysis.
UJ and US30 trades - did you?📊 Triple Trade Opportunity – USDJPY & US30, 30min
This chart showcases how the ELFIEDT RSI + 3SD Reversion Strategy helps identify high-probability reversion zones with precision — even during volatile market swings. In this case, we see three clean opportunities across USDJPY and US30 that could have been traded confidently using the indicator's logic.
✅ Breakdown of the Trade Setups:
📌 1. US30 – Sell Signal at the High
As price spiked aggressively to a new high, the strategy printed a “DOWN” label:
Price extended well above the volatility band
RSI confirmed overbought momentum
Volume supported the exhaustion
📉 The market reversed shortly after and sold off heavily, offering a strong short opportunity with minimal risk.
📌 2. USDJPY – Buy Signal After Strong Decline
After a deep selloff, USDJPY printed a “UP” label at the bottom:
Price fell below the lower deviation band
RSI hit oversold levels and began turning
A bounce followed shortly after, giving traders a reversion move back toward the mean
📌 3. US30 – Second “UP” Signal After Oversold Flush
Later on the same chart, US30 printed a “UP” signal after a sharp drop. RSI was again deeply oversold, and price had reached extreme deviation from the trend baseline.
📈 The market responded with a clean reversal — an ideal intraday mean reversion setup.
🧠 How Traders Could Have Used These Setups:
Use the signal labels (“UP” and “DOWN”) to mark key reversal zones
Watch RSI for confirmation of momentum shift (rolling over or curling up)
Combine signals across related markets (e.g., USDJPY and US30) for cross-market confluence
Set stop-loss just beyond the signal wick and aim for the reversion target (like a prior zone or moving average)
📌 Key Takeaway:
These 3 setups demonstrate how your public strategy helps traders:
✔ Spot price extremes with confidence
✔ Time entries using clean RSI behavior
✔ React with logic, not emotion — even in high volatility
The ELFIEDT strategy does not predict direction — it prepares traders for where a move might fade and reverse. When used with patience and structure, it becomes a powerful tool for consistency.

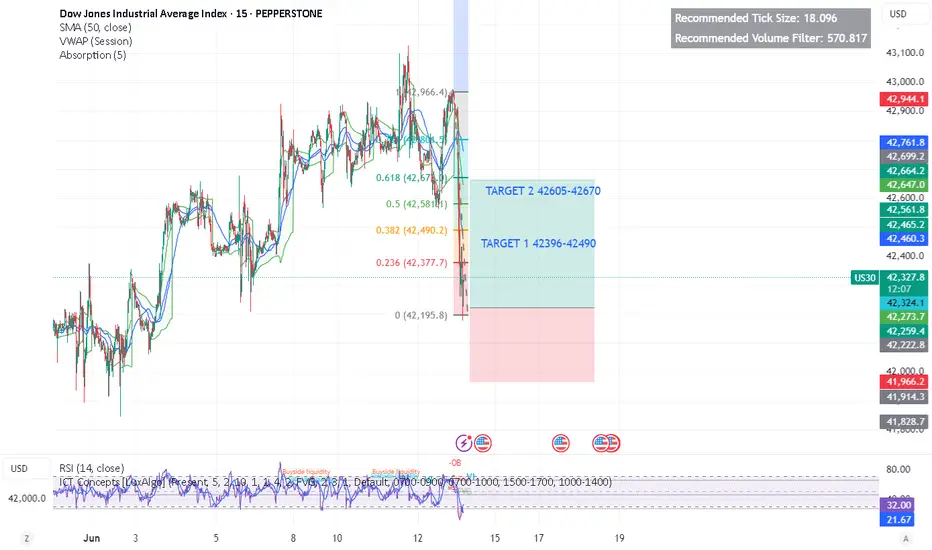
DOW/US30 - TIME FOR RECOVER DURING UK MARKET OPENINGTeam, very sad day to see Israel missle flying
We can only hope the world in peace
We are now finding opportunity to entry LONG DOW/US30
Please set your target 1 and 2 ranges
Make sure take 50-70% at first target and bring stop loss to BE
then second target
Please review the chart carefully and pricing target
Good luck.
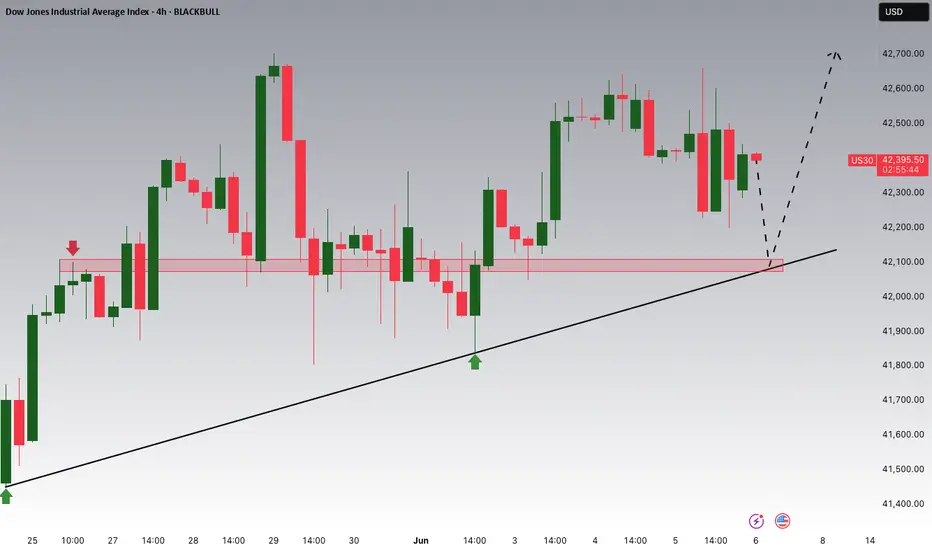
US30 Breaks Trendline Support – Will Geopolitics Add FuelUS30 (Dow Jones) — Trendline Breach & Rising Geopolitical Risk
Technical Outlook — 13 June, 2025
Current Market Condition:
US30 is currently trading at 42,339, showing early signs of risk-off sentiment following a clear break of both the ascending trendline and the Previous Day Low, with price rejecting from the 42,863 supply zone. This sharp decline aligns with growing tensions between Iran and Israel, which are weighing heavily on investor confidence. The breakdown suggests a shift in momentum, with further downside likely if key support levels fail to hold.
Key Technical Highlights:
Major ascending trendline support has broken, indicating a structural shift toward bearish sentiment.
Price broke below both the Previous Day Low (42,551) and Fib support, invalidating short-term bullish setups.
EMA 50 was lost, and price is heading toward the 200 MA at ~42,100.
Stochastic shows strong bearish momentum, currently in a downward cross and nowhere near oversold.
Major downside levels: 42,100, 41,900, 41,700, and 41,500.
Upside resistance: 42,550, followed by 42,863 and 42,970.
🌍 Geopolitical Factor – Iran-Israel Conflict:
The recent escalation between Iran and Israel has intensified risk aversion across global markets. Defensive sectors are gaining while equity indices like the Dow Jones face increased selling pressure. With concerns over possible oil supply disruptions and global uncertainty, traders are pulling capital from equities and seeking safe-haven assets like gold and bonds.
The volatility spike from this geopolitical conflict may overshadow technical setups, amplifying moves and reducing the reliability of support/resistance zones unless confirmed with volume.
Trade Plan:
🔻 1. Bearish Continuation Setup (Short Bias) – Most Probable
Trigger: Retest of 42,550 fails (previous demand turned supply)
Target: 42,100 → 41,900 → 41,500
Stop Loss: Above 42,600
⚠️ 2. Pullback Bounce (Short-term Buy) – Less Probable
Trigger: Strong bounce from 42,100 with bullish divergence on Stochastic
Target: 42,550 → 42,700
Stop Loss: Below 42,000
Risk Management Note:
Due to the unfolding Middle East conflict, markets may behave erratically and spike unpredictably. Use smaller position sizes, widen SL buffers slightly, and stay alert to news headlines. Prioritize confirmation over anticipation.
📢 If you found this analysis valuable, kindly consider boosting and following for more updates.
⚠️ Disclaimer: This content is intended for educational purposes only and does not constitute financial advice.

US30 Analysis: Liquidity Dip or Deeper Correction?📉 US30 (Dow Jones) Trade Idea 📉
Currently analysing US30 – the Dow Jones Index 🏛️, and there are some key developments worth noting…
On the 4-hour timeframe, we’re observing a clear shift in market structure, with price breaking through previous lows ⚠️. This raises two possibilities:
🔹 It could be a liquidity grab before a rally 🚀
🔹 Or, it may be the beginning of a deeper end-of-week sell-off targeting levels below 🔻
At this stage, I’m watching for a potential counter-trend short position — but only if the conditions outlined in the video are met with precision 🎯.
🧠 As always, it’s about waiting for confirmation, not jumping in early. Disciplined execution is key. 🧩💼
⚠️ Disclaimer: This is not financial advice. The information provided is for educational purposes only. Always do your own analysis and manage risk accordingly.

Bulls game over now 35697 incoming Short from 43000 Tp 35697.. weekly TF down move incoming.. Bulls Fasten your seatbelt please... Good luck and safe trade

Rush and Choke: Why the Patient Dog Wins in the MarketsWhere I come from, the expression “the patient dog eats the fattest bone” is sometimes seen as a myth—mostly because people want to get it fast. But that mindset doesn’t work in trading.
In this game, you have to be patient. Rushing into trades, chasing the market, or trying to force profits will only lead to unnecessary losses. If you’re not careful, that "bone" you’re so eager to grab might just get stuck in your throat.
Patience in trading means waiting for the right setup, managing your emotions, and trusting your strategy. It’s about playing the long game, not the fast one.
So remember: in the markets, the patient dog doesn’t just eat—the patient dog feasts.
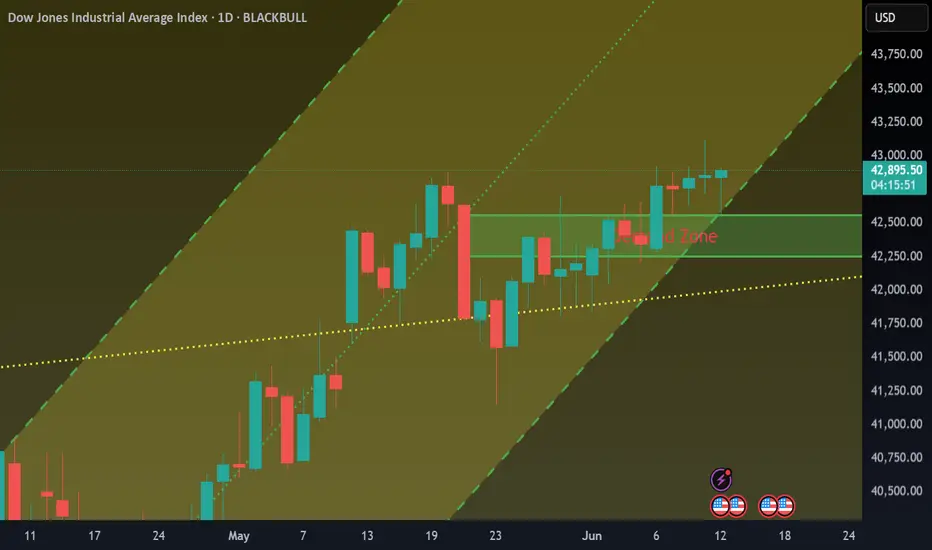
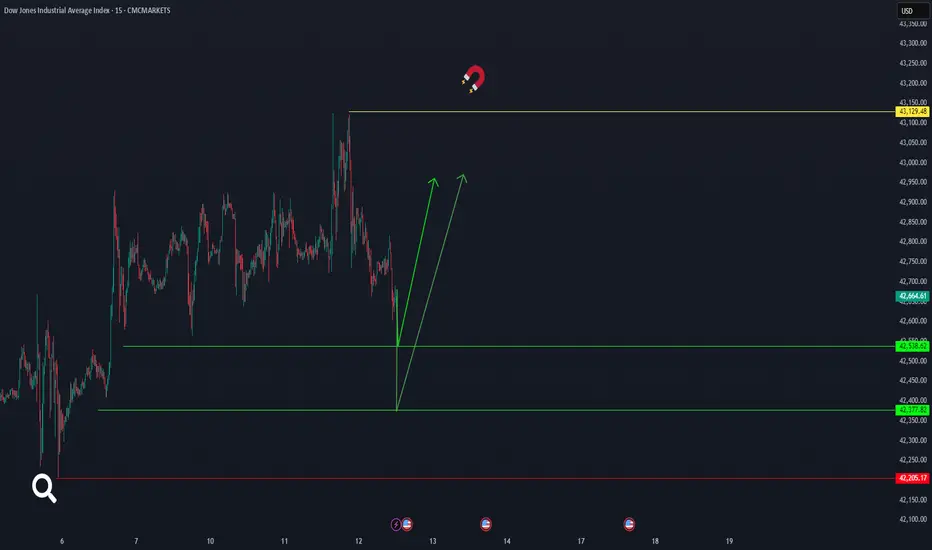
us30It seems that the Dow Jones will start moving again from the areas of 42377 or 42538 and the price will definitely reach 43129.48. Of course, the critical point is 42205. CMCMARKETS:US30
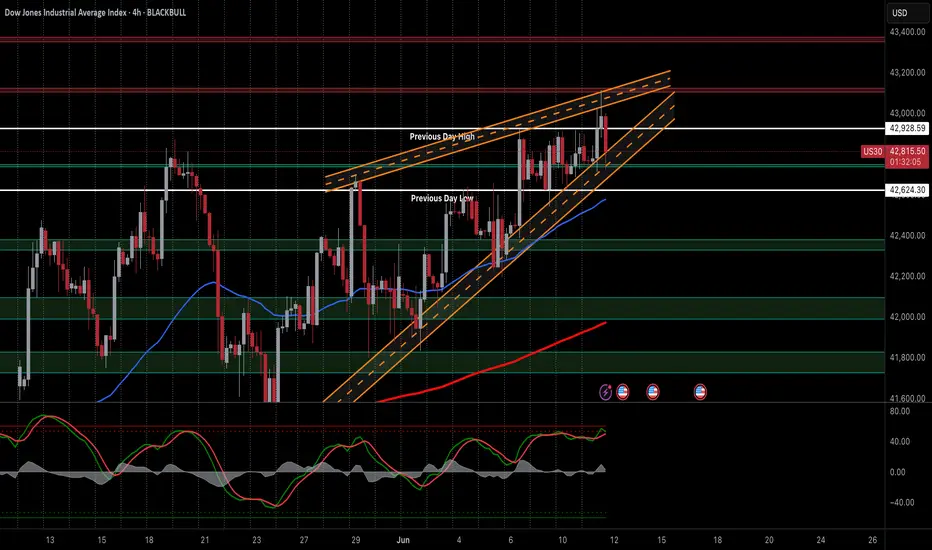
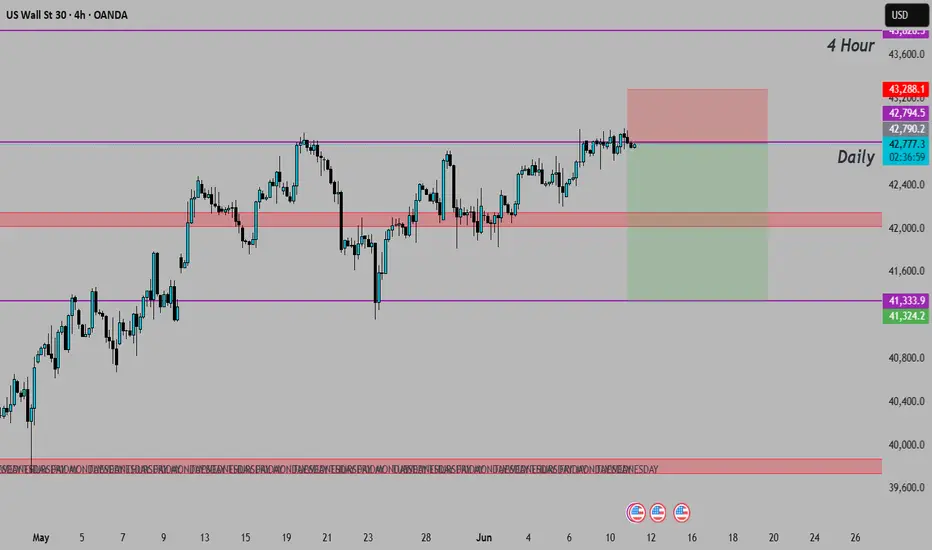
US30 Breakout Watch: 43,300 or Bust?US30 (Dow Jones) — Price Tests Key Fib Support with Breakdown Risk
Technical Outlook — 12 June, 2025
Current Market Condition:
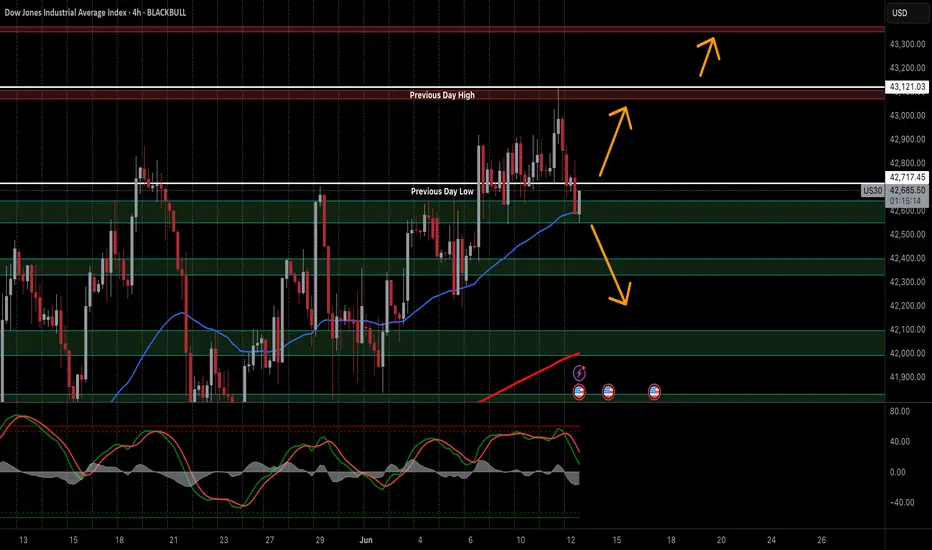
US30 (Dow Jones Industrial Average) is currently trading around 42,661 on the 4-hour timeframe, up +0.17% for the session. After rejection at the Previous Day High (43,121), price is now pulling back and testing the Previous Day Low around the 42,660 region, which also aligns with a Fibonacci confluence zone and the 50 EMA. This zone is acting as a last line of defence for bulls — if held, a push toward new highs remains on the table. However, a confirmed break could see the index slide further toward deeper support levels.
Key Technical Highlights:
Price is testing a major fib-based support cluster around 42,600–42,700, aligning with the Previous Day Low and 50 EMA.
The Stochastic Oscillator has crossed bearish from the overbought region and is now heading down, indicating short-term bearish momentum.
Resistance is now PDL and next one at 43,121 (PDH) and a break above this level would confirm bullish continuation.
Trade Plan:
✅ 1. Bullish Breakout (Long) – Most Probable if Support Holds
Trigger: Bullish candle or engulfing pattern above 42,660–42,700 zone with volume confirmation
Target: 43,121 (PDH) → 43,300
Stop Loss: Below 42,500
⚠️ 2. Bearish Rejection (Short) – Viable if Fib Zone Breaks
Trigger: 4H candle closes below 42,600 with bearish confirmation
Target: 42,300 → 42,100 → 41,900
Stop Loss: Above 42,800
📉 3. Dip Buy Setup – Least Probable but High RR Opportunity
Trigger: Price dips into 42,100 or 41,900 zone and forms a strong bullish reversal pattern (e.g., pin bar, bullish divergence on Stochastic)
Target: Bounce back toward 42,600–42,800
Stop Loss: Below 41,800
Risk Management:
Use conservative lot sizing and set clear stop losses to avoid whipsaw risk. With macroeconomic data and news expected this week, watch for volatility spikes. Always let the setup confirm before entry, especially near fib-based support or resistance zones.
📢 If you found this analysis valuable, kindly consider boosting and following for more updates.
⚠️ Disclaimer: This content is intended for educational purposes only and does not constitute financial advice.
DowJones INTRADAY important support retest Key Support and Resistance Levels
Resistance Level 1: 43190
Resistance Level 2: 43620
Resistance Level 3: 44290
Support Level 1: 42100
Support Level 2: 41420
Support Level 3: 40990
This communication is for informational purposes only and should not be viewed as any form of recommendation as to a particular course of action or as investment advice. It is not intended as an offer or solicitation for the purchase or sale of any financial instrument or as an official confirmation of any transaction. Opinions, estimates and assumptions expressed herein are made as of the date of this communication and are subject to change without notice. This communication has been prepared based upon information, including market prices, data and other information, believed to be reliable; however, Trade Nation does not warrant its completeness or accuracy. All market prices and market data contained in or attached to this communication are indicative and subject to change without notice.

US30 ShortMy take on us30 for the next couple of days is for it to push downwards.. I'll Keep updating on this trade
US30 Trade Update – 06/12/2025🚨 US30 Trade Update – 06/12/2025 🚨
📊 Market Structure & Key Levels
US30 continues to push higher after holding support at 42,610. Price tapped 43,021 resistance and is now consolidating near 42,799. Bulls are still in control, but price is sitting right below a key breakout level.
✅ Key Observations:
Strong bounce from 42,610 support ✅
Rejection seen at 43,021
Consolidation under resistance → potential breakout brewing
📍 Key Levels:
Resistance: 42,872 → 43,021
Support: 42,610 → 42,584
🎯 Trade Plan:
🔹 Long Setup:
Buy above 43,021
→ Target: New highs / intraday extensions
🔻 Short Setup:
Breakdown below 42,610
→ Target: 42,248 → 41,947
⚠️ Market is bullish but nearing exhaustion — wait for breakout confirmation or signs of reversal!

Dow Jones Potential UpsidesHey Traders, in today's trading session we are monitoring US30 for a buying opportunity around 42,100 zone, US30 is trading in an uptrend and currently is in a correction phase in which it is approaching the trend at 42,100 support and resistance area.
Trade safe, Joe.
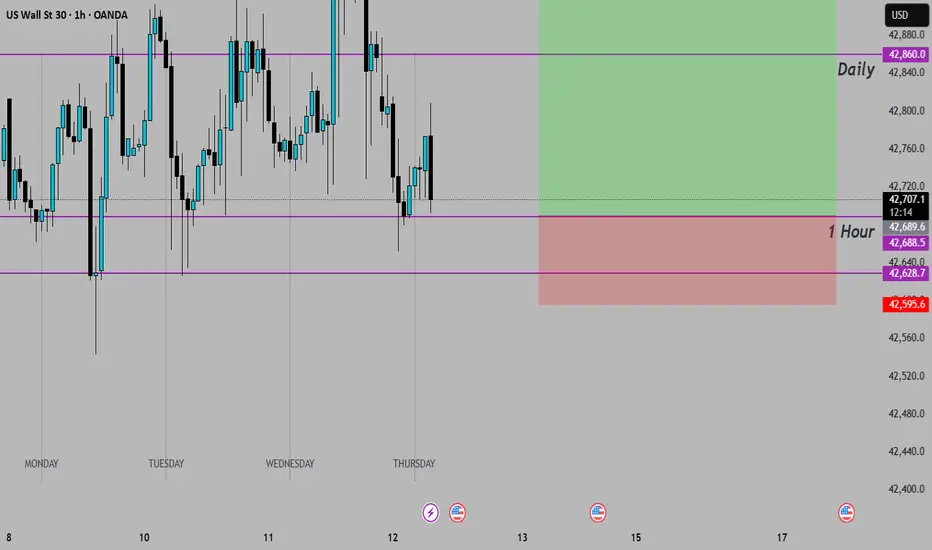
US30 Bigger Picture - Make or Break MomentUS30 H4
Technical Outlook — 11 June, 2025
Market Context:
The Dow Jones (DJI) is currently consolidating around 42,730, forming a tight range near the "Previous Day High." Price action suggests a potential ascending triangle or consolidation pattern, indicating a crucial decision point for the short-term trend. The market is showing indecision at a key resistance cluster.
Key Levels & Trade Plan:
Resistance:
Immediate: ~$42,890 - $42,950 (Previous Day High / Upper consolidation boundary).
Major: ~$43,100 - $43,150.
Support:
Immediate: ~$42,700 - $42,750 (Lower consolidation boundary / Ascending trendline).
Strong: ~$42,545 - $42,600.
Lower/Previous Day Low: ~$42,280 - $42,390.
Trade Plan:
Bullish Breakout (Long):
Trigger: Clear 1-hour close above $42,950 with good volume.
Target: $43,100.
Stop Loss: Below breakout level (e.g., $42,850).
Bearish Breakdown (Short):
Trigger: Clear 1-hour close below $42,700 with strong selling volume.
Target: $42,600, then $42,390.
Stop Loss: Above breakdown level (e.g., $42,780).
Dip Buy (Long):
Trigger: Price holds $42,545 - $42,600 with bullish reversal.
Target: Resistance levels.
Stop Loss: Below the confirmed support.
Risk Management: Always use proper position sizing and set a stop loss.
If you found this analysis valuable, kindly consider boosting and following for more updates.
Disclaimer: This content is intended for educational purposes only and does not constitute financial advice.