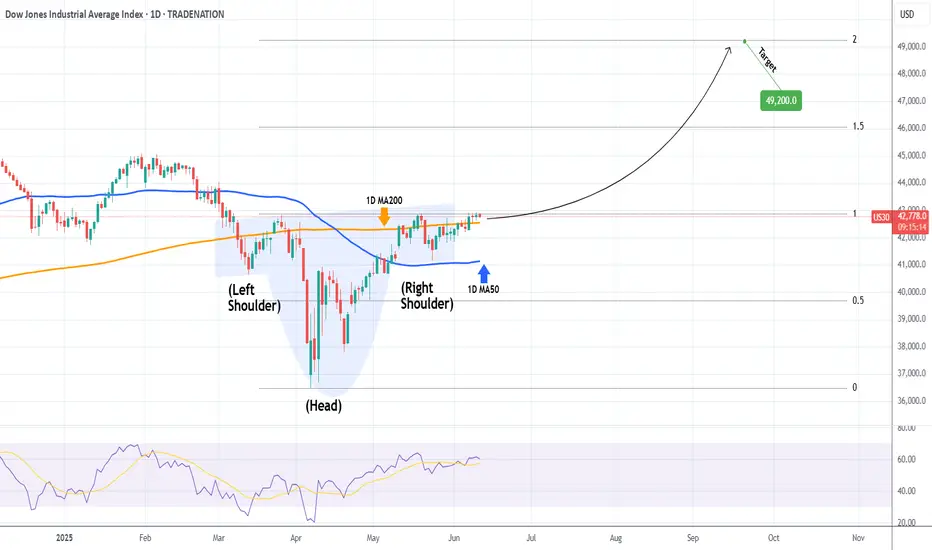
DOW JONES Inverse Head and Shoulders close to a bullish breakoutDow Jones (DJI) has completed an Inverse Head and Shoulders (IH&S) pattern, having formed the Right Shoulder supported by the 1D MA50 (blue trend-line).
The price is now slowly rising to test the upper neckline and if broken, expect a strong movement upwards. Technically, such patterns target their 2.0 Fibonacci extensions. The current one is at 49200 and that's our long-term Target. If you seek lower risk, you may target the 1.5 Fib extension.
-------------------------------------------------------------------------------
** Please LIKE 👍, FOLLOW ✅, SHARE 🙌 and COMMENT ✍ if you enjoy this idea! Also share your ideas and charts in the comments section below! This is best way to keep it relevant, support us, keep the content here free and allow the idea to reach as many people as possible. **
-------------------------------------------------------------------------------
Disclosure: I am part of Trade Nation's Influencer program and receive a monthly fee for using their TradingView charts in my analysis.
💸💸💸💸💸💸
👇 👇 👇 👇 👇 👇
DOW trade ideas
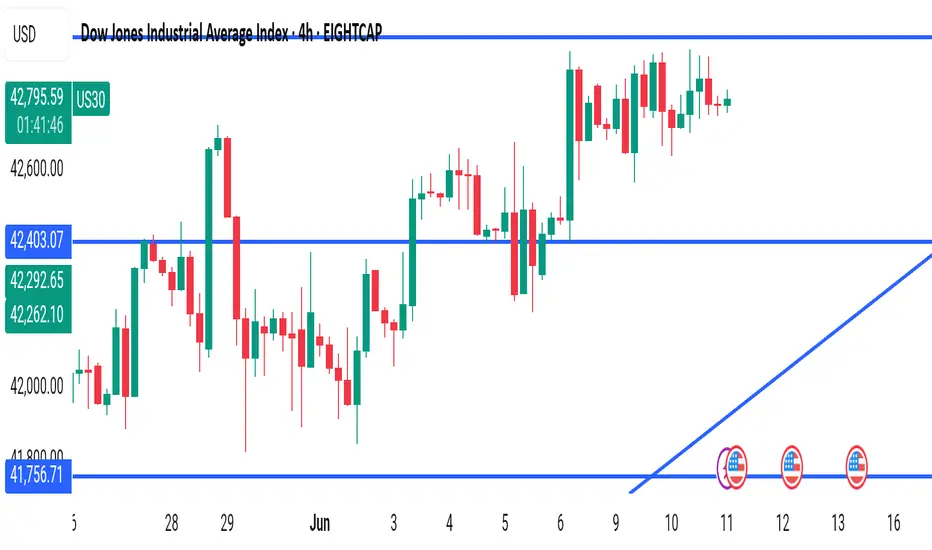
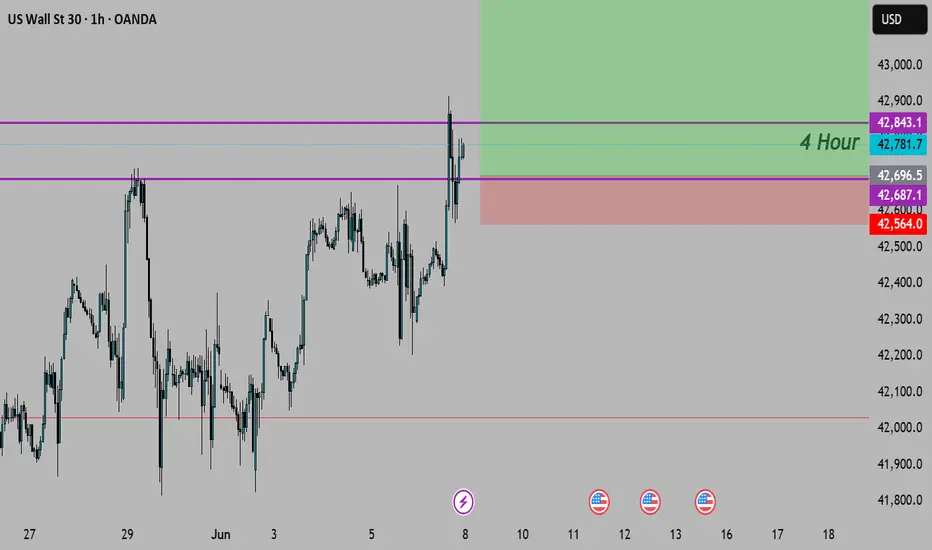
US30 Near Critical Resistance! | Dow Jones Technical Outlook The Dow Jones is showing clear consolidation just below a major resistance level of 42,813 after a strong bullish rally earlier this month. Price action has been relatively choppy but continues to respect support zones and the rising trendline, suggesting a larger move is brewing.
🔹 Resistance:
42,813 (currently being tested – critical breakout zone)
Watch for candle closes above this level
🔹 Support Levels:
42,403.07 (mid-level pivot, acting as short-term support)
41,756.71 (key structural support)
Rising trendline (dynamic support zone into mid-June)
---
🔥 What the Chart Tells Us:
✅ Price is compressing near resistance with higher lows
✅ Strong demand around 42,262 and 42,292 zones
✅ Upcoming U.S. economic events (circled) could be the catalyst
✅ Volume and volatility expected to increase
---
💡 Possible Trading Scenarios:
📈 Bullish Breakout Setup:
A 4H candle close above 42,813 could trigger a momentum breakout, potentially targeting 43,000+.
📉 Bearish Rejection Setup:
Failure to break above may send price back to 42,400, and if broken, down to test 41,756 or the trendline.
---
📅 Upcoming U.S. Economic Data:
🟣 Marked on chart – keep your eyes on June 11, 12, and 13 for high-impact announcements!
---
📌 My Personal Bias:
Watching for a clean breakout with strong volume confirmation above 42,813. Patience is key here!
---
💬 What do YOU think?
Will the bulls break through or are we setting up for a pullback?
📝 Drop your analysis or setups below — Let’s grow together!
👍 Like & 🔔 Follow @FrankFx14 for more market updates!
#US30 #DowJones #TechnicalAnalysis #TradingView #FrankFx14 #SupportAndResistance #BreakoutTrading #PriceAction #Forex #Indices #StockMarketAnalysis
Upward trend After some fluctuation and correction to the specified support level, there is a possibility of a trend change. Then the start of an uptrend is likely. Otherwise, if the support level is broken, the downtrend may continue to the next support level.
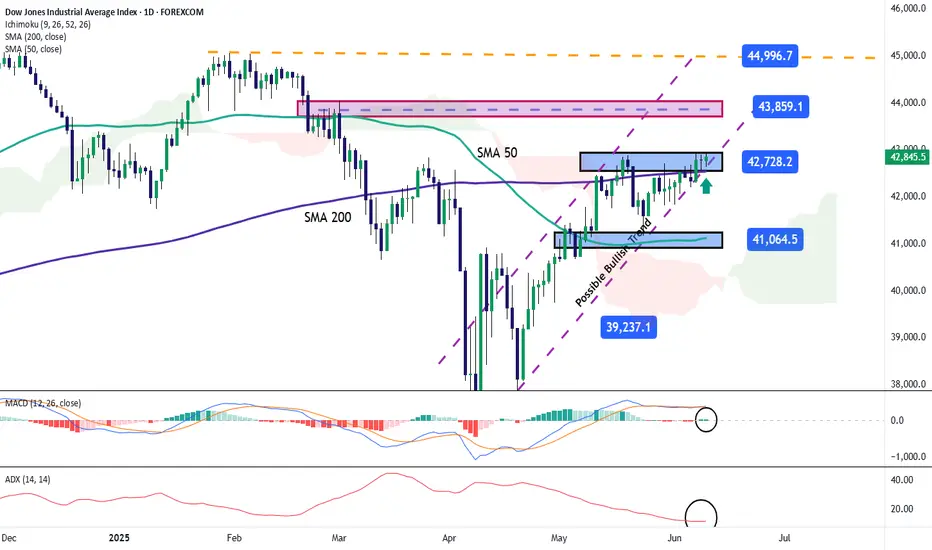
Dow Jones Struggles to Reach 43,000 PointsThe Dow Jones has gained more than 1% over the last three trading sessions and is now attempting to consistently reach price levels not seen since March of this year. The bullish bias has remained steady as investor confidence has recovered, driven by ongoing economic negotiations between the United States and China. The potential easing of trade tensions has helped stabilize market sentiment in the short term, and if this trend continues positively, consistent buying pressure could emerge in the index's movements over the near term.
Sustained Uptrend
Since early April, the Dow Jones has maintained a steady upward trend, and so far, selling corrections have been insufficient to break that trend. However, price action continues to face resistance at the trendline, and if this ongoing neutrality persists, the trendline could come under pressure in the coming sessions.
MACD
The MACD histogram continues to oscillate very close to the neutral 0 line, indicating that momentum between the moving averages remains balanced. As long as this behavior persists, the current neutral tone could become even more pronounced in upcoming sessions.
ADX
The ADX line remains below the neutral 20 level in the short term, signaling that average volatility has been steadily decreasing over the past sessions. This has further intensified the market’s neutral tone near the current resistance zone where the price is trading.
Key Levels:
42,700 points: Current resistance zone, aligned with the recent multi-week highs. This level could become the base for a broader short-term consolidation.
43,800 points: A level not seen since February of this year. A return to this area could reinforce the bullish bias and support a more sustained upward trend.
41,000 points: A critical support level that coincides with the 200-day simple moving average. A move toward this level on the downside could threaten the current bullish structure.
Written by Julian Pineda, CFA – Market Analyst
US30: The Next Big Move? Bullish Breakout or Bearish DropUS30 Intraday Setup
Technical Outlook — 10 June, 2025
Market Context:
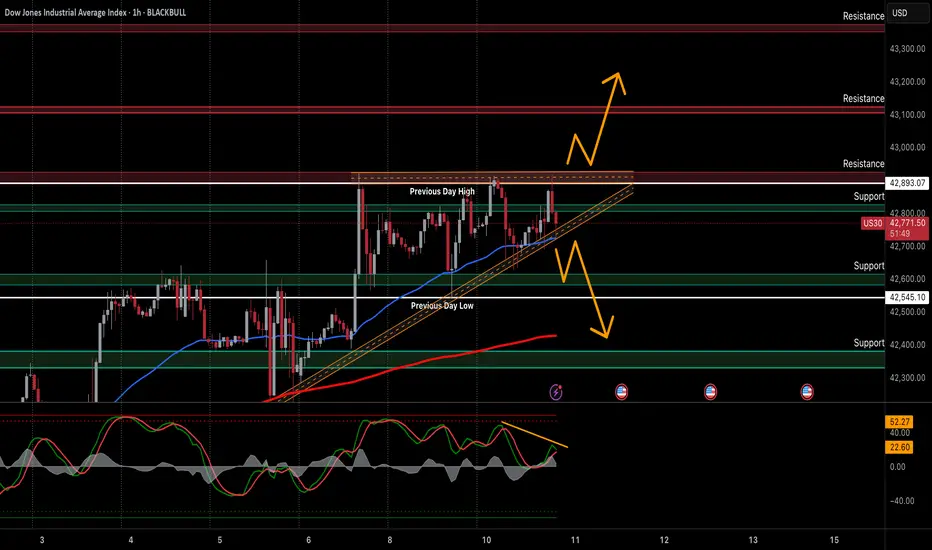
The Dow Jones (DJI) is currently consolidating around 42,730, hovering near the "Previous Day High" after several attempts to break higher. Price action is forming a potential ascending triangle or a tight range, suggesting a crucial decision point for the intraday trend. The market is showing indecision at key resistance.
Key Levels & Trade Plan:
Resistance:
Immediate: ~$42,890 - $42,950 (Previous Day High / Upper boundary of consolidation).
Major: ~$43,100 - $43,150.
Support:
Immediate: ~$42,700 - $42,750 (Lower boundary of consolidation / Ascending trendline).
Strong: ~$42,545 - $42,600.
Lower/Previous Day Low: ~$42,280 - $42,390.
Trade Plan:
Bullish Breakout (Long):
Trigger: Clear 1-hour close above $42,950 with good volume, confirming breakout from consolidation/Previous Day High.
Target: $43,100, then $43,150.
Stop Loss: Below breakout level (e.g., $42,850).
Bearish Breakdown (Short):
Trigger: Clear 1-hour close below $42,700 with strong selling volume, breaking the ascending trendline/consolidation.
Target: $42,600, then $42,390.
Stop Loss: Above breakdown level (e.g., $42,780).
Dip Buy (Long):
Trigger: Price holds $42,545 - $42,600 with clear bullish reversal signals (e.g., strong wick, bullish engulfing) on the 1-hour timeframe.
Target: Resistance levels.
Stop Loss: Below the confirmed support (e.g., $42,500).
Risk Management: Always use proper position sizing and set a stop loss.
If you found this analysis valuable, kindly consider boosting and following for more updates.
Disclaimer: This content is intended for educational purposes only and does not constitute financial advice.
US30: The Market Is Looking Down! Short!
My dear friends,
Today we will analyse US30 together☺️
The market is at an inflection zone and price has now reached an area around 42,877.4 where previous reversals or breakouts have occurred.And a price reaction that we are seeing on multiple timeframes here could signal the next move down so we can enter on confirmation, and target the next key level of 42,798.2..Stop-loss is recommended beyond the inflection zone.
❤️Sending you lots of Love and Hugs❤️

DowJones INTRADAY support at 42100Key Support and Resistance Levels
Resistance Level 1: 43190
Resistance Level 2: 43620
Resistance Level 3: 44290
Support Level 1: 42100
Support Level 2: 41420
Support Level 3: 40990
This communication is for informational purposes only and should not be viewed as any form of recommendation as to a particular course of action or as investment advice. It is not intended as an offer or solicitation for the purchase or sale of any financial instrument or as an official confirmation of any transaction. Opinions, estimates and assumptions expressed herein are made as of the date of this communication and are subject to change without notice. This communication has been prepared based upon information, including market prices, data and other information, believed to be reliable; however, Trade Nation does not warrant its completeness or accuracy. All market prices and market data contained in or attached to this communication are indicative and subject to change without notice.

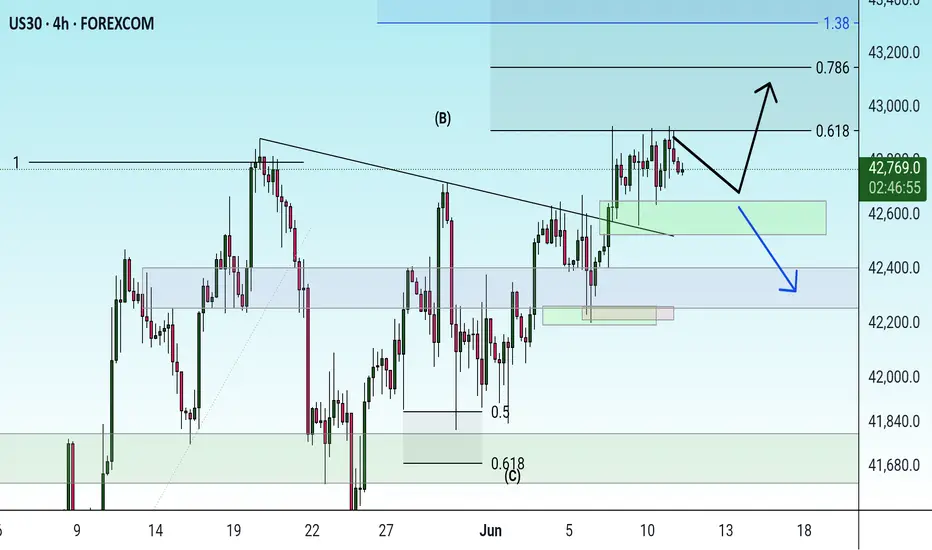
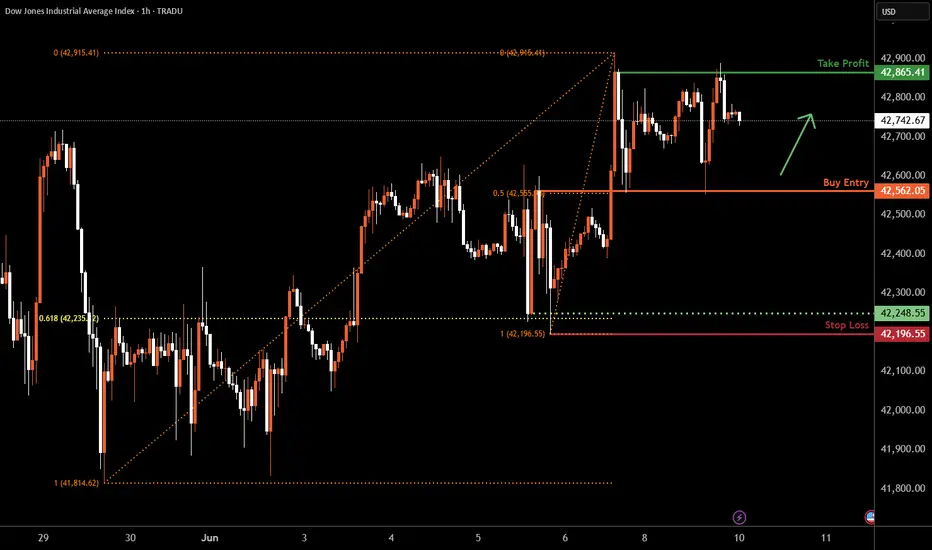
Dow Jones H1 | Overlap support at 50% Fibonacci retracementThe Dow Jones (US30) is falling towards an overlap support and could potentially bounce off this level to climb higher.
Buy entry is at 42,562.05 which is an overlap support that aligns with the 50.0% Fibonacci retracement.
Stop loss is at 42,196.55 which is a level that lies underneath a swing-low support and the 61.8% Fibonacci retracement.
Take profit is at 42,865.41 which is a multi-swing-high resistance.
High Risk Investment Warning
Trading Forex/CFDs on margin carries a high level of risk and may not be suitable for all investors. Leverage can work against you.
Stratos Markets Limited (tradu.com ):
CFDs are complex instruments and come with a high risk of losing money rapidly due to leverage. 63% of retail investor accounts lose money when trading CFDs with this provider. You should consider whether you understand how CFDs work and whether you can afford to take the high risk of losing your money.
Stratos Europe Ltd (tradu.com ):
CFDs are complex instruments and come with a high risk of losing money rapidly due to leverage. 63% of retail investor accounts lose money when trading CFDs with this provider. You should consider whether you understand how CFDs work and whether you can afford to take the high risk of losing your money.
Stratos Global LLC (tradu.com ):
Losses can exceed deposits.
Please be advised that the information presented on TradingView is provided to Tradu (‘Company’, ‘we’) by a third-party provider (‘TFA Global Pte Ltd’). Please be reminded that you are solely responsible for the trading decisions on your account. There is a very high degree of risk involved in trading. Any information and/or content is intended entirely for research, educational and informational purposes only and does not constitute investment or consultation advice or investment strategy. The information is not tailored to the investment needs of any specific person and therefore does not involve a consideration of any of the investment objectives, financial situation or needs of any viewer that may receive it. Kindly also note that past performance is not a reliable indicator of future results. Actual results may differ materially from those anticipated in forward-looking or past performance statements. We assume no liability as to the accuracy or completeness of any of the information and/or content provided herein and the Company cannot be held responsible for any omission, mistake nor for any loss or damage including without limitation to any loss of profit which may arise from reliance on any information supplied by TFA Global Pte Ltd.
The speaker(s) is neither an employee, agent nor representative of Tradu and is therefore acting independently. The opinions given are their own, constitute general market commentary, and do not constitute the opinion or advice of Tradu or any form of personal or investment advice. Tradu neither endorses nor guarantees offerings of third-party speakers, nor is Tradu responsible for the content, veracity or opinions of third-party speakers, presenters or participants.
possibility of uptrendThe uptrend is expected to progress to the specified resistance level. Then there is a possibility of a trend change.
A break of the green support level will cause a correction and fluctuation.

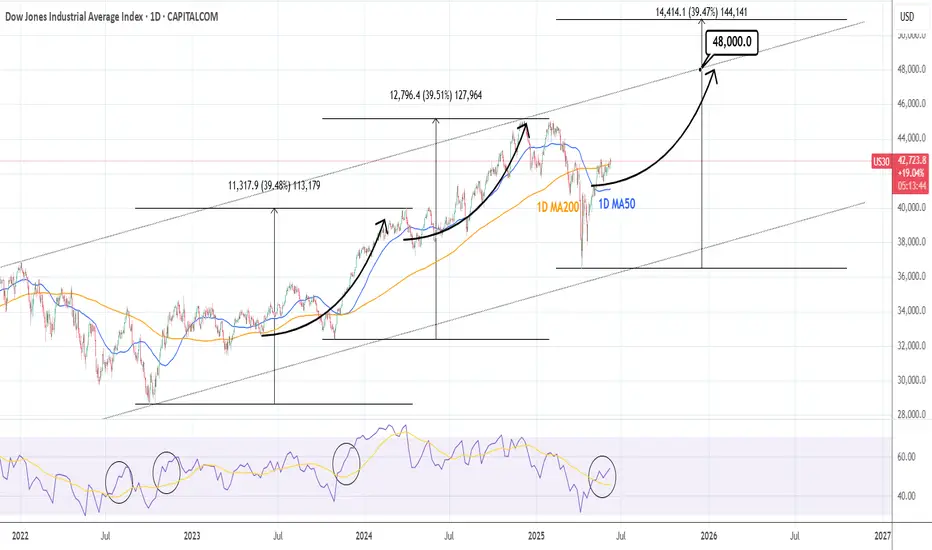
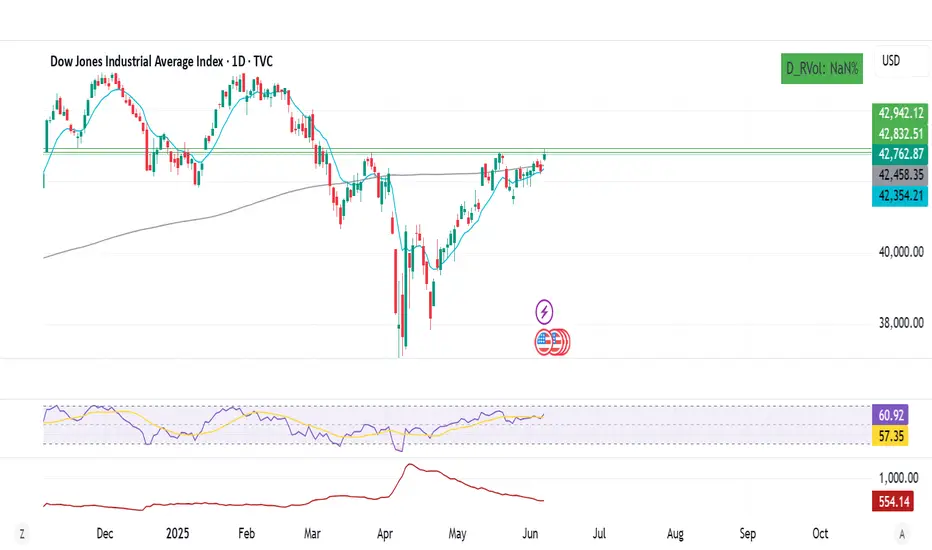
DOW JONES: Turning sideways for summer. Massive rise afterwards.Dow Jones is bullish on its 1D technical outlook (RSI = 58.389, MACD = 425.040, ADX = 23.083) but 1W is neutral, a natural outcome of the ranged trading within the 1D MA200 and 1D MA50in the last 3 weeks. It is possible to see the index staying sideways until the end of August and then attempt to complete a +39.50% rise from its bottom, like both prior bullish waves did. Regardless of this a test of the Channel Up top trendline, gives us a fair TP = 48,000 for the end of the year.
## If you like our free content follow our profile to get more daily ideas. ##
## Comments and likes are greatly appreciated. ##
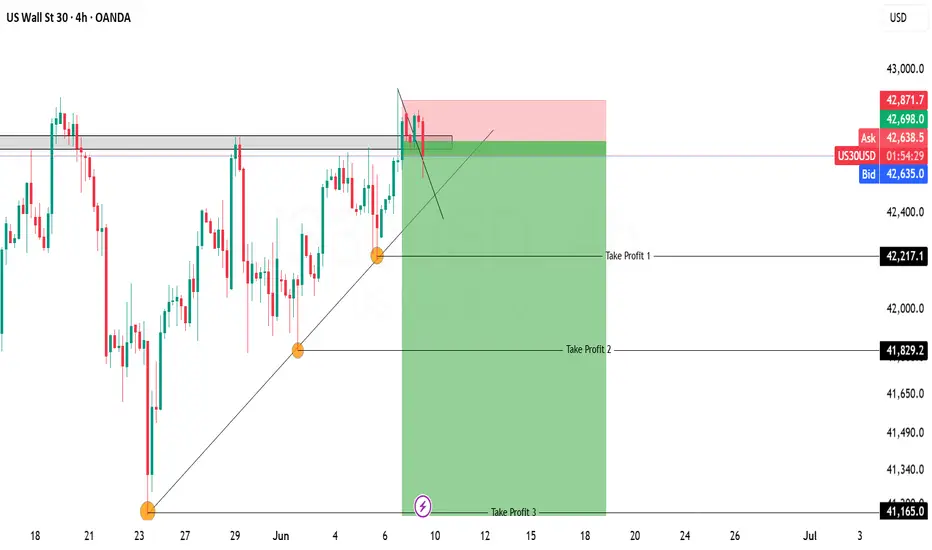
US30 This trade is an A+ setup from abnormal context to normal context. The price took BSL on HTF and failed to create FVG on daily as a result of the lack of creating FVG. After that, in the 4H, the price closed below -OB. Now we are short; we just need to engage.

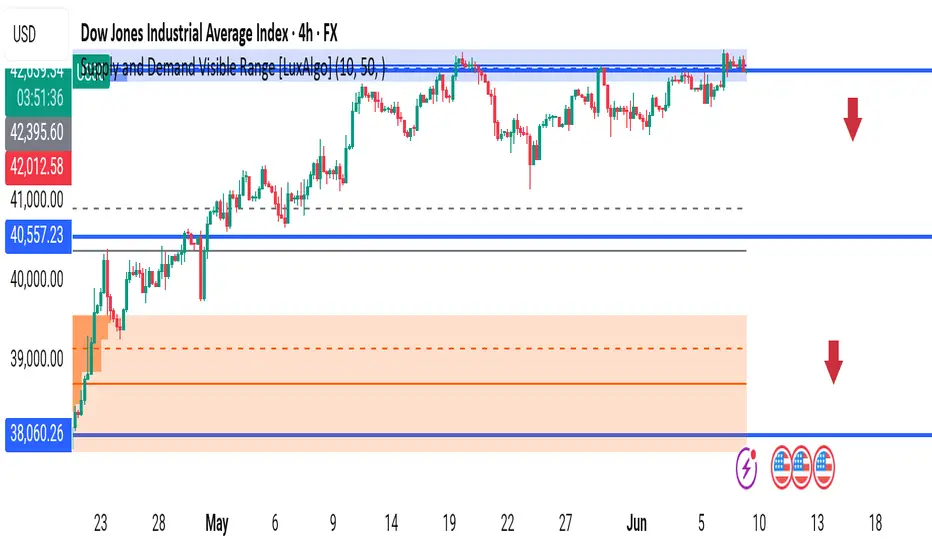
DOW JONES – Triple Rejection Alert! Is a Breakdown Coming?The DOW (DJI) is struggling hard near the 42,600 resistance zone, and signs are pointing toward a potential bearish reversal.
📊 What’s the Chart Telling Us?
Price is hovering at a strong supply zone marked by heavy volume resistance (🔵 LuxAlgo Visible Range).
After three failed attempts to break above 42,600, bears may be gearing up to strike.
Support levels at 40,557 and 38,060 are now key downside targets.
🔻 Bearish Bias Building:
Strong supply zone rejection just like we saw in late April and mid-May.
Momentum slowing while price tests the same highs = distribution phase? 🤔
Divergence between price action and buyer strength is becoming more visible.
Key U.S. data events and Fed signals (⚡🇺🇸) coming up — potential catalysts for a breakout or breakdown.
🎯 Key Levels to Watch:
42,600 = Bull trap zone? Watch for another fake breakout.
40,557 = First test support — break here confirms weakness.
38,060 = Demand zone where bulls may re-enter, or price collapses further.
---
📌 My Plan:
If price fails again at 42,600, I’ll look for short opportunities toward 40,557, and 38,060 with tight risk control.
---
💬 What do YOU think?
Is Dow Jones heading for a correction? Or are the bulls playing possum?
👉 Drop your thoughts, hit the ❤️ if this helps your analysis, and follow for updates!
Quick Look: Dow Jones - Don't Miss These Levels!US30 Intraday Setup
Technical Outlook — 9 June, 2025
Market Context:
The Dow Jones (DJI) is currently consolidating around 42,760 after a recent rally. Price action suggests a potential "bear flag" formation near the "Previous Day High," indicating a crucial decision point for the short-term trend.
Key Levels & Trade Plan:
Resistance:
Immediate: ~$42,850 - $42,925 (Upper flag boundary / Previous Day High).
Major: ~$43,100.
Support:
Immediate: ~$42,690 - $42,720 (Lower flag boundary).
Strong: ~$42,590.
Lower/Previous Day Low: ~$42,390 - $42,280.
Trade Plan:
Bullish Breakout (Long):
Trigger: Clear 1-hour close above $42,925 with good volume.
Target: $43,100.
Stop Loss: Below breakout level (e.g., $42,800).
Bearish Breakdown (Short):
Trigger: Clear 1-hour close below $42,690 with strong selling volume.
Target: $42,590, then $42,390.
Stop Loss: Above breakdown level (e.g., $42,750).
Dip Buy (Long):
Trigger: Price holds $42,590 or $42,280-$42,390 with bullish reversal.
Target: Resistance levels.
Stop Loss: Below the confirmed support.
Risk Management: Always use proper position sizing and set a stop loss.
If you found this analysis valuable, kindly consider boosting and following for more updates.
Disclaimer: This content is intended for educational purposes only and does not constitute financial advice.

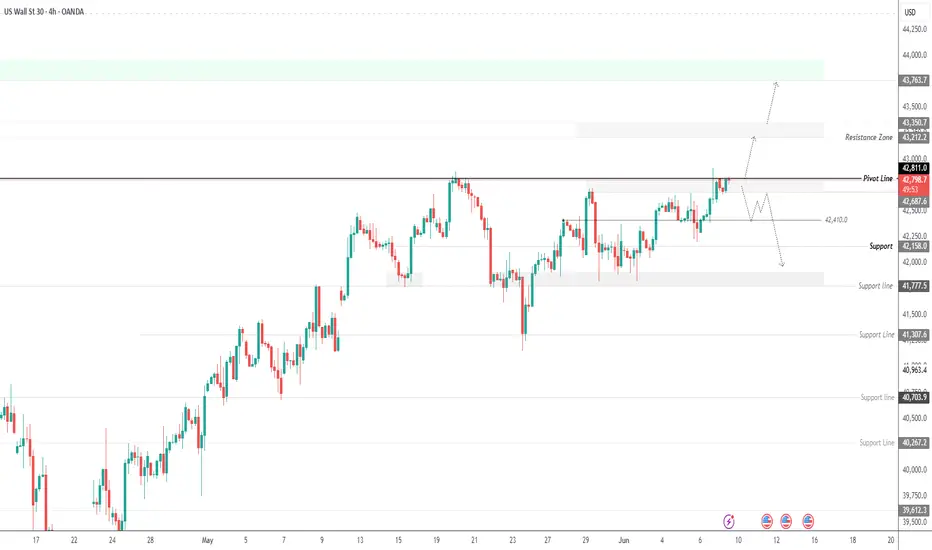
US30 – Price at Key Decision Point 42,810US30 | Technical Analysis
🔺 Current Scenario:
The price is now testing the pivot line at 42,810.
A 4H candle close above this level may confirm a bullish continuation toward the resistance zone at 43,212–43,350, and possibly extend to 43,763.
🔻 Alternative Scenario:
If price fails to hold above 42,810 and drops back below, we could see a pullback toward 42,410, with further downside to 42,158 and 41,777 if that breaks.
Pivot Line: 42810
Resistance Zone: 43212, 43350, 43763
Support Levels: 42410, 42158, 41777
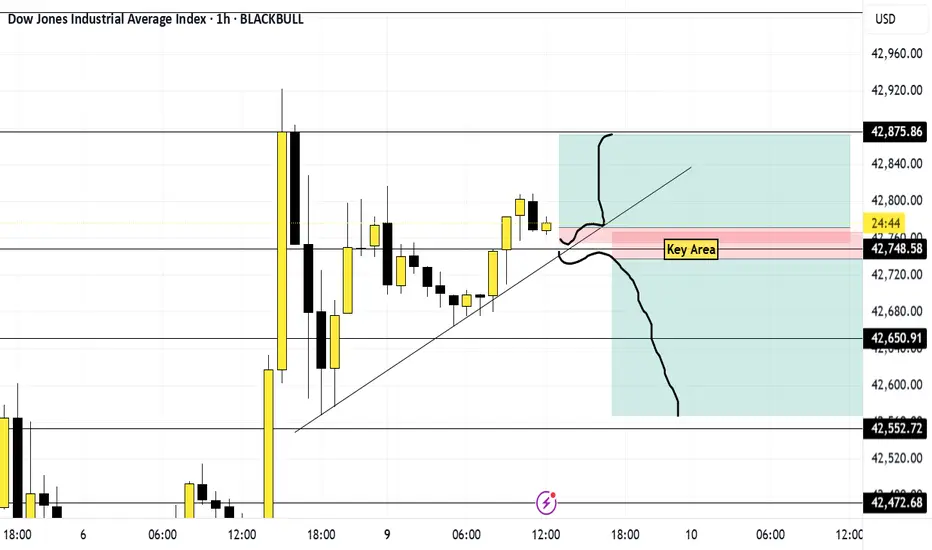
US30 JUNE 9Happy Mondays! Why are libraries so tall? Because they have many stories, like you will once you lock in on trading.
Now we can only do three things when it comes to trading Buy, Sell or nothing.
Price is moving up right now. If price breaks and retests my trend line and key area then I'm going to sell. However, if price rejects those same areas and starts to create higher highs and lows then I'll buy it.
If price decides to act like that one friend who got too high and decides to go nowhere then I shall do nothing and wait. That it that all.
Have fun and enjoy the process
DJIDJI in an interesting spot. It's at a strong resistance and if we make it above, DJI can slowly recover to the 45k levels. If now, we can see a short potential 42620 level. One can short DIA.
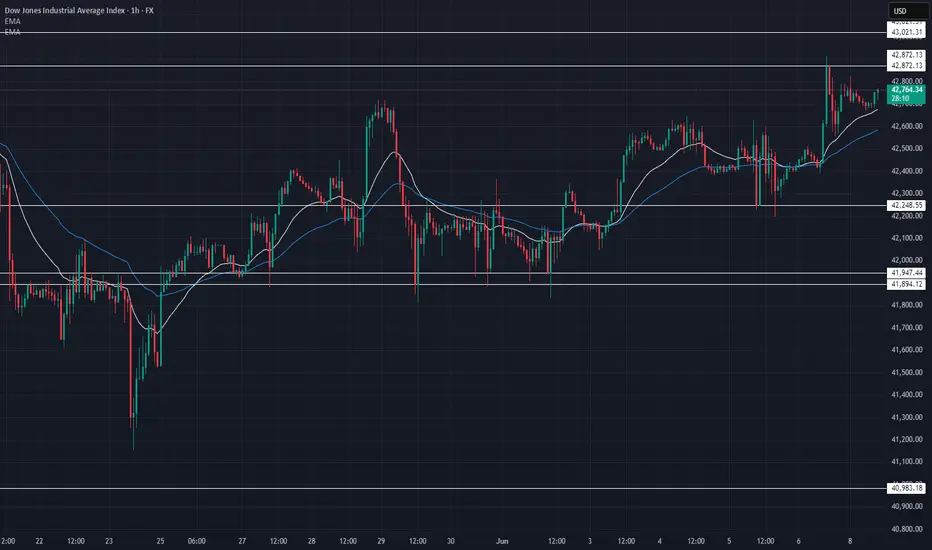
Dow Jones Index Rises Towards Key ResistanceDow Jones Index Rises Towards Key Resistance
On Friday, the Dow Jones Industrial Average (Wall Street 30 mini on FXOpen) climbed above the 42,950 level — a high not seen since early March.
The index has gained around 1.6% since the beginning of June.
Why Is the Dow Jones Rising?
→ Friday’s US jobs report helped ease concerns about the country’s economic outlook. According to ForexFactory, Non-Farm Employment Change came in at +139K, beating the forecast of +126K.
→ On Thursday, Donald Trump and Chinese President Xi Jinping held a call, easing tariff tensions. Market participants also welcomed news that officials may hold trade negotiations in London on 9 June.
Could the DJIA (Wall Street 30 mini on FXOpen) Rally Continue?
Technical Analysis of the Dow Jones Chart
The chart suggests that the 42,950 level is acting as a significant resistance. The price has repeatedly reversed from the 42,660–42,950 area (as shown by the arrows).
At the same time:
→ Friday’s move above 42,950 triggered selling pressure, forming a candlestick with a long upper shadow;
→ This may have been a false bullish breakout of the May high;
→ The price remains within an ascending channel (shown in blue), but the bounces off the lower boundary appear weak.
Given this setup, it is reasonable to assume that intensified bearish activity near 42,950 on the USA30 could lead to a breakout below the channel’s lower boundary.
Additional pressure on the Dow Jones Industrial Average (Wall Street 30 mini on FXOpen) may come from developments in California, where protests have erupted against immigrant deportations, with President Donald Trump and Governor Gavin Newsom trading accusations.
This article represents the opinion of the Companies operating under the FXOpen brand only. It is not to be construed as an offer, solicitation, or recommendation with respect to products and services provided by the Companies operating under the FXOpen brand, nor is it to be considered financial advice.

US30 Trade Update – 06/09/2025🚨 US30 Trade Update – 06/09/2025 🚨
📊 Market Structure & Key Levels
US30 has finally broken above the prior resistance zone of 42,605, pushing toward the next key level of 42,872. Price is currently consolidating near 42,759, signaling strength but also caution as momentum pauses.
✅ Key Observations:
Clean breakout above 42,605 ✅
Next resistance: 42,872 → 43,021
Key support now: 42,605 → 42,584
🎯 Trade Plan:
🔹 Long Setup:
Buy above 42,872
→ Target: 43,021 & potential extension above
🔻 Short Setup:
Breakdown below 42,605
→ Target: 42,248 → 41,947
⚠️ Price is bullish but extended – wait for breakout or pullback confirmation!
US30 MESSAGE IS CLEAR.PEPPERSTONE:US30 , AS we can see it on these charts, team Bullish are in full gear control, as it stands now, US30 will explode to the up side in a mightily way.

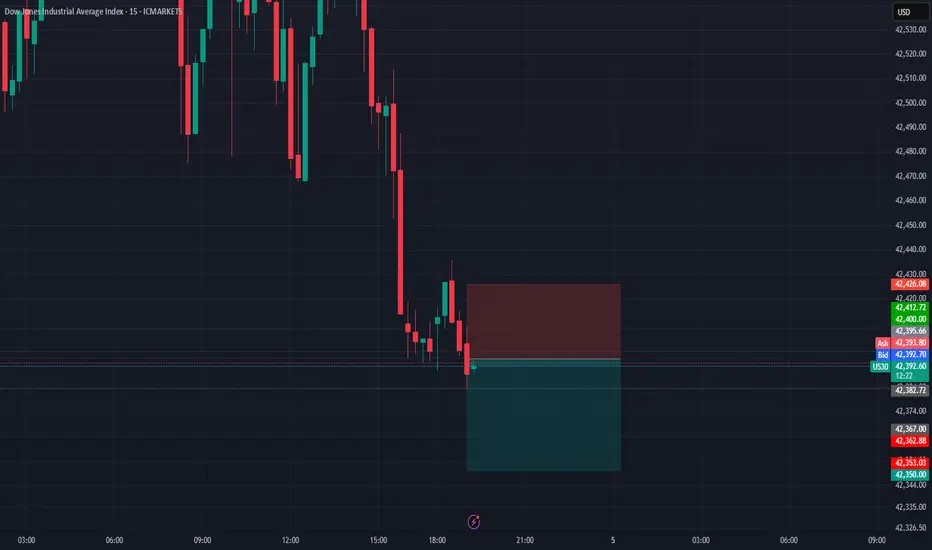
[Scalping] Short US30 (June 4, 2025)Entry was 42395.66
TP is 42350.00
SL is 42426.08
RR is 1:1.5-2
This is just record purpose with new method to trade.
Please allow this test period.
**I use only session indicator.
Other than that I do not use any indicators
New method can be used only for manual trading.
Weekly Forex Outlook Sun.June.8.2025 - Fri.June.13.2025Like and Comments would be appreciated :D Not Financial Advice, Just my outlook/opinion
