Wall Street Cash ($10) forum
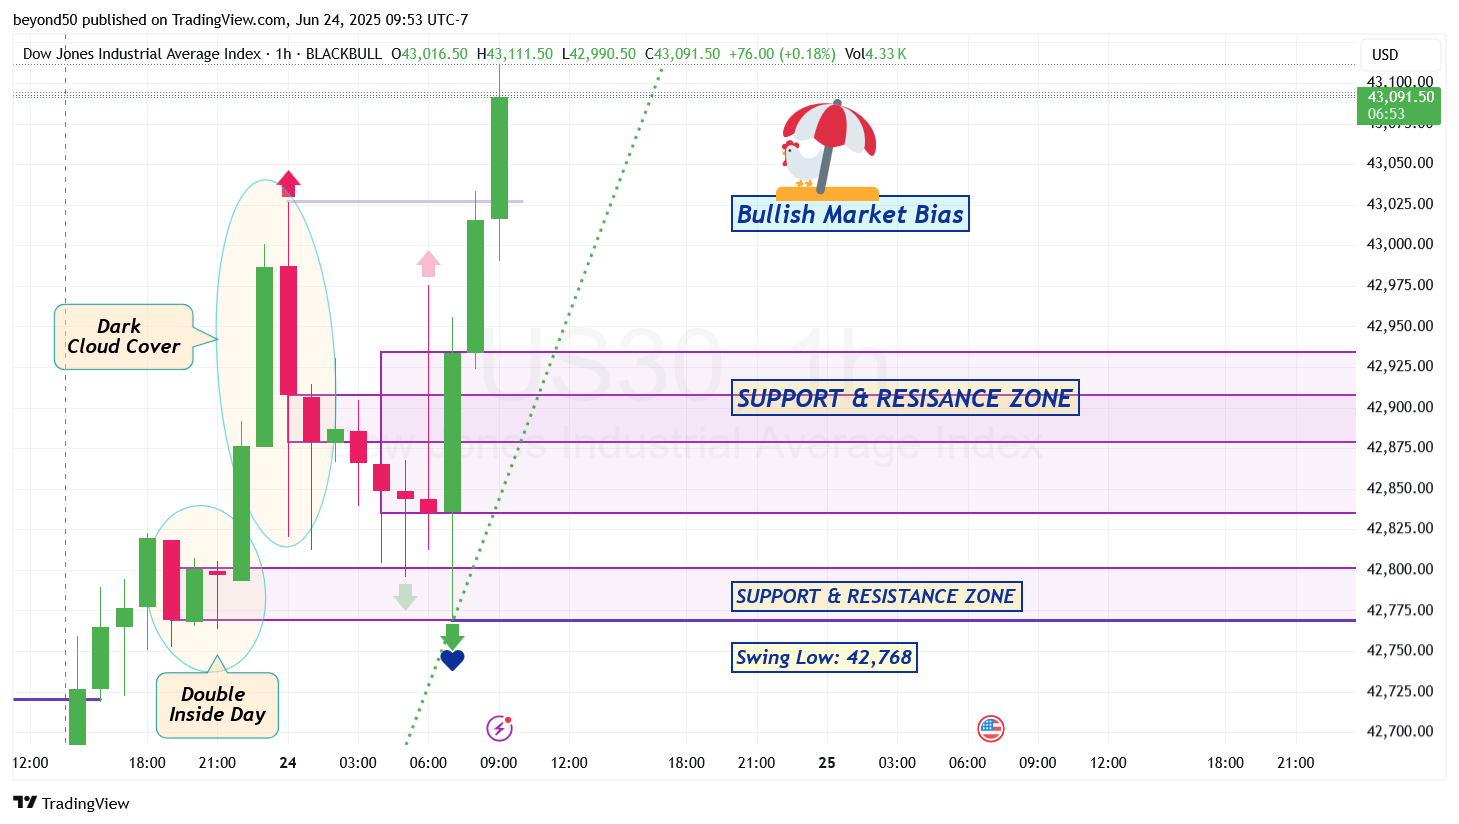
Look at the Hourly chart. The Bullish Trendline (in green dotted line) is angled in a very steep way, which means that this bullish trend is unsustainable. Therefore, watch for the bears to eventually show up and potentially cross down and to the right of the trendline, flipping the market (directional) bias from bullish to bearish.
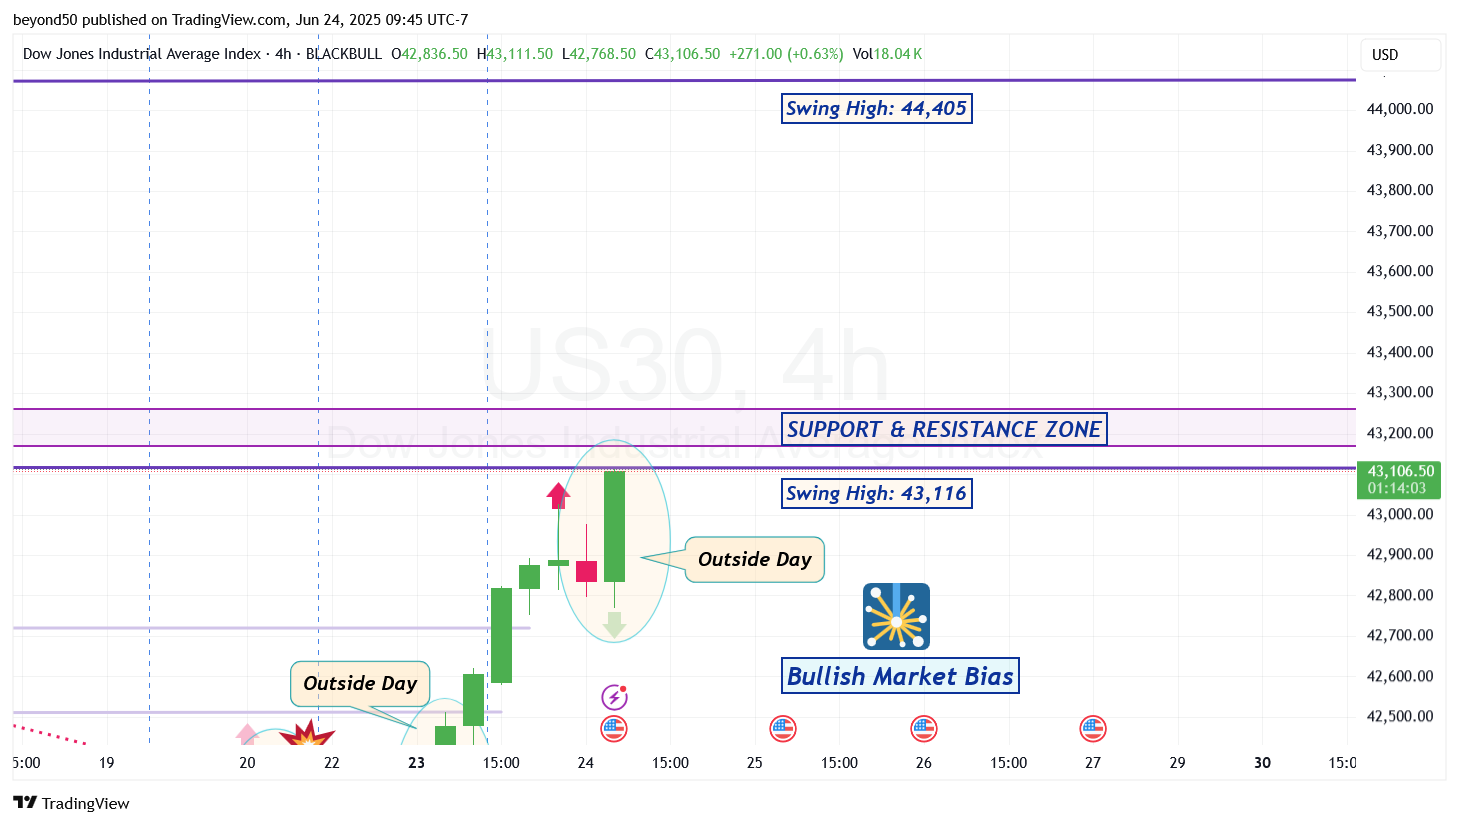
Switching to the 4-Hour chart, there are 3 levels of Resistance Areas that the bulls have to deal with: the Swing High of 43,116 to breach, a S&R Zone cross through (that starts at 43,171), and another Swing High at 44,405 if they can reach it.
Let's see if the first level can be breached with a candle close past the Swing High of 43,116. If not, back down it goes.
Also, an Outside Day pattern appeared. Which means that after this bull run is over, we'll see an immediate retrace to the downside.
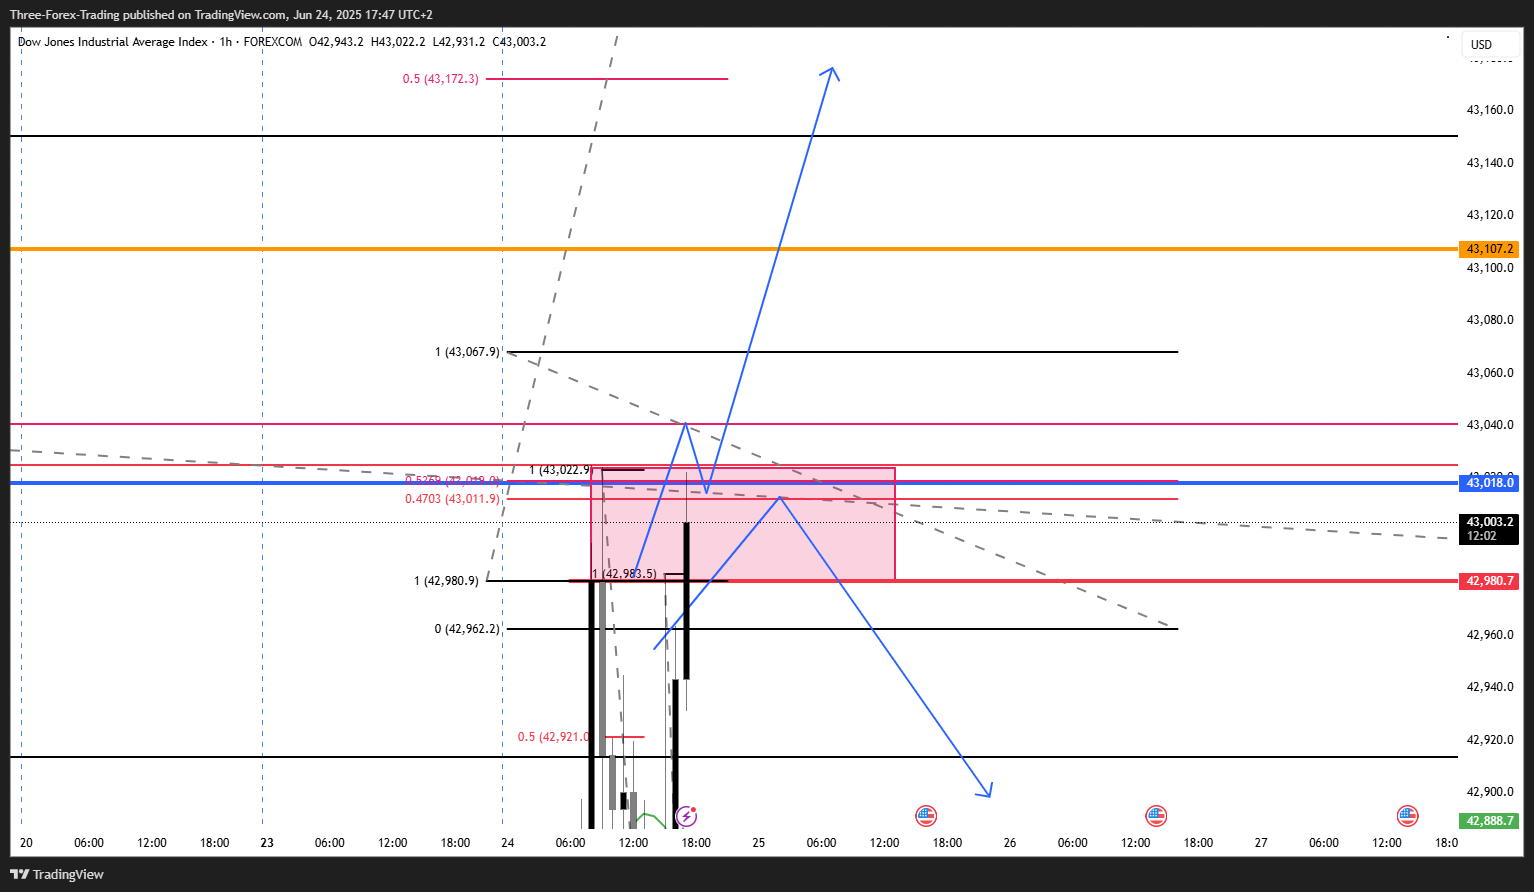
if 43030 is not broken with h1 i will not buy, otherwise i will ssell