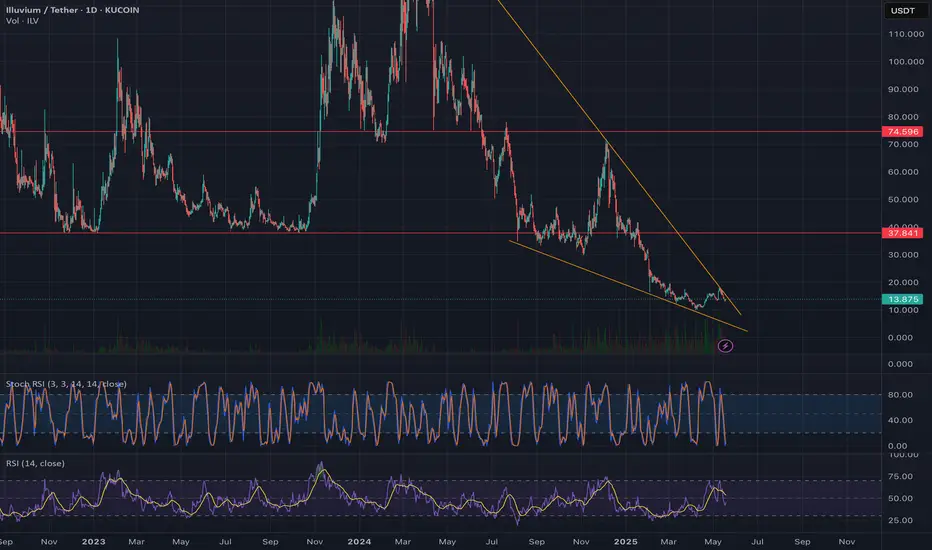
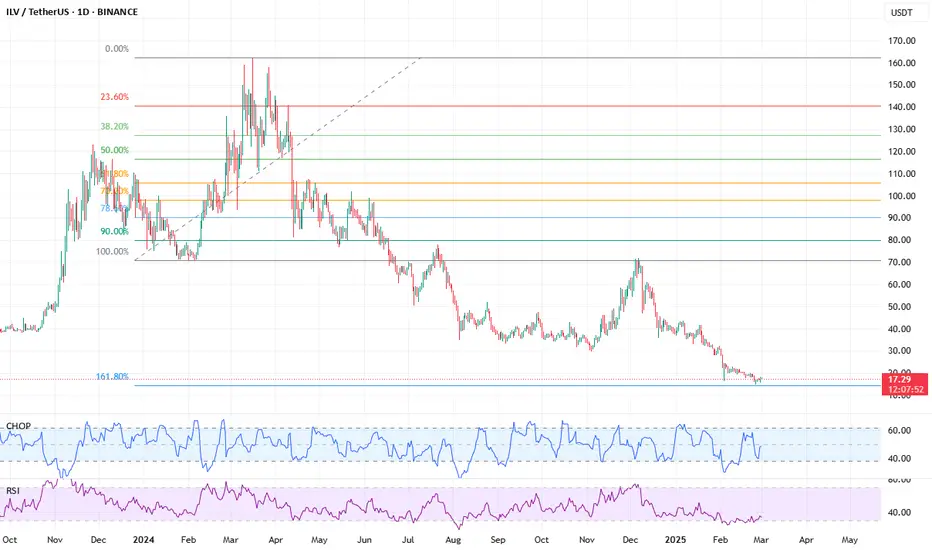
ILVUSDT: Trend in daily timeframeThe color levels are very accurate levels of support and resistance in different time frames, and we have to wait for their reaction in these areas.
So, Please pay special attention to the very accurate trend, colored levels, and you must know that SETUP is very sensitive.
Be careful
BEST
MT

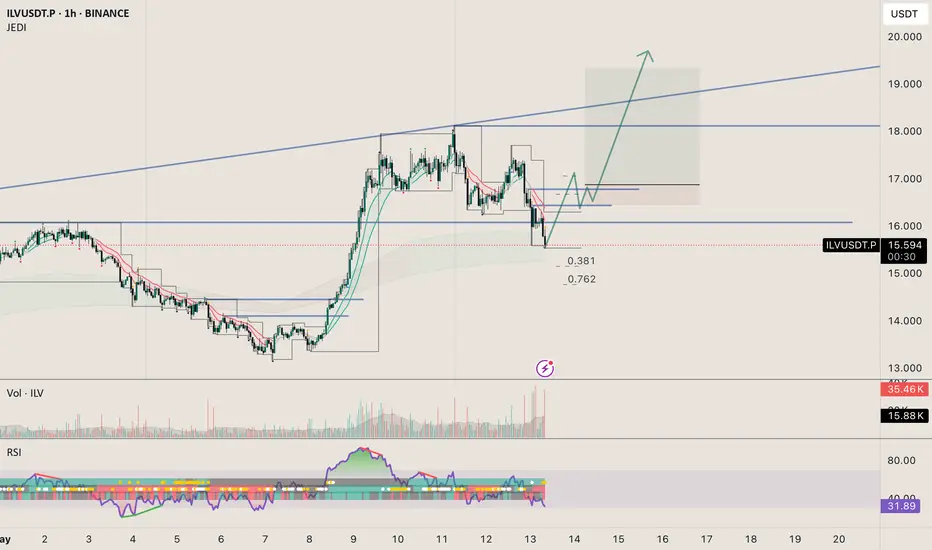
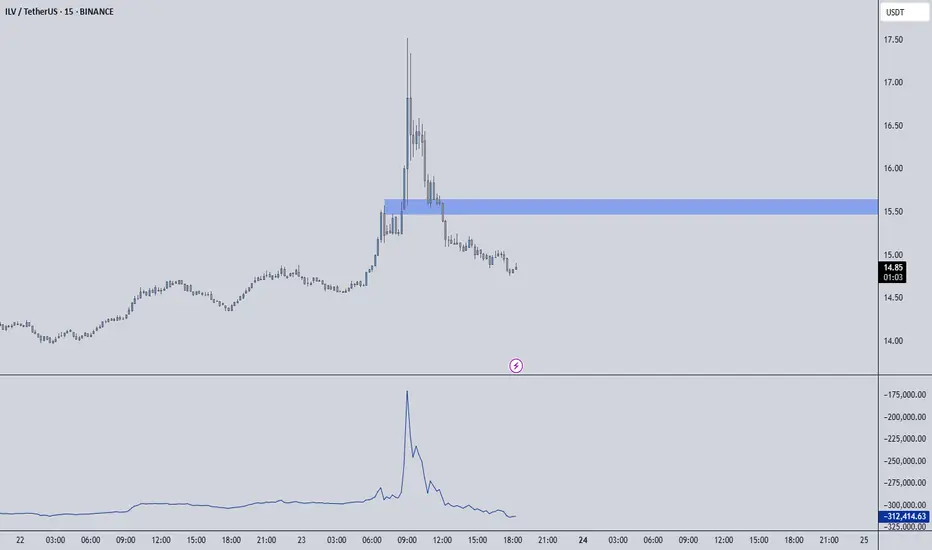
$ILV is up to breaking the resistanceGood opportunity of trade for the next few days, where I can see #ILV breaking up the resistance soon.
buys toward daily liquidity highdaily pullback to averages, if price holds, it's a good sign that buyers will ramp up the price to sweep the high.
wait until buyers has proven to accumulate and break the supply zone.
after proven, entry on pullback
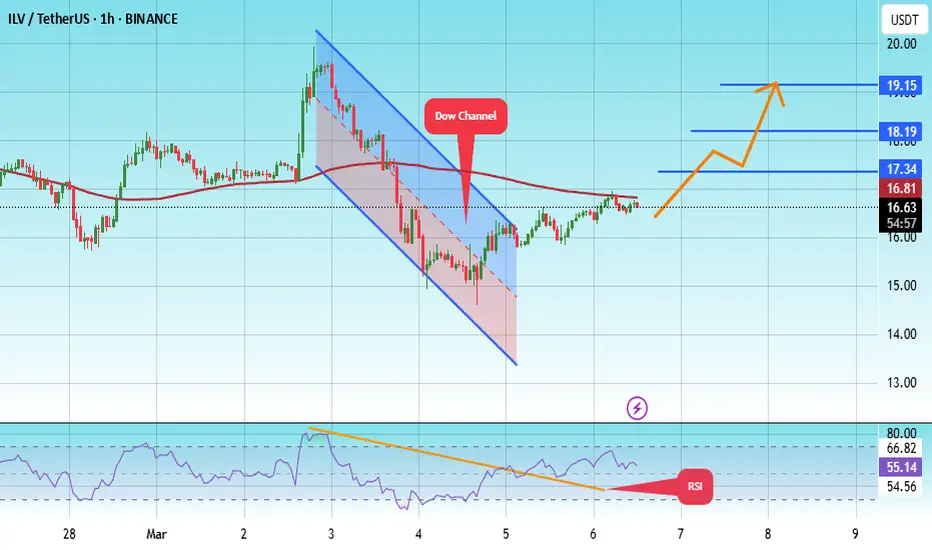
#ILV/USDT#ILV
The price is moving within a descending channel on the 1-hour frame, adhering well to it, and is heading for a strong breakout and retest.
We are seeing a rebound from the lower boundary of the descending channel, which is support at 16.40.
We have a downtrend on the RSI indicator that is abo
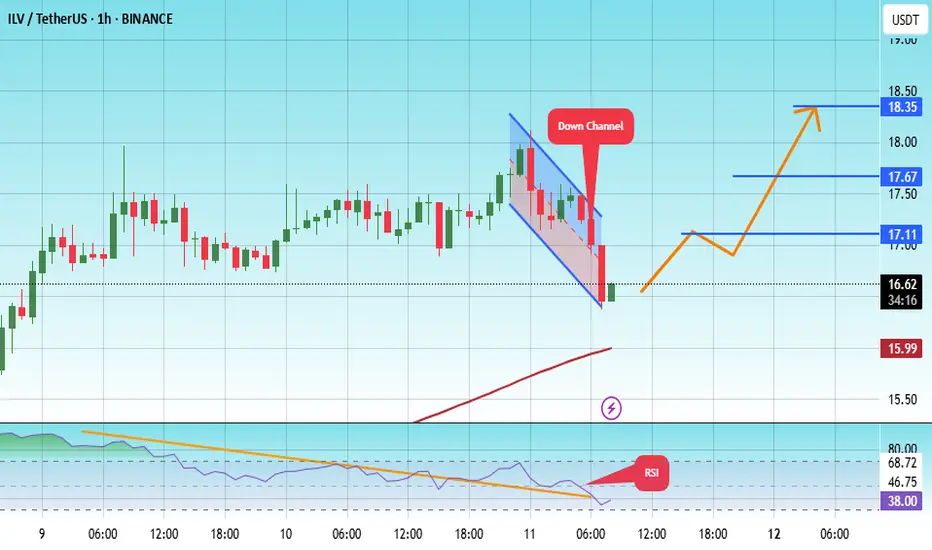
#ILV/USDT#ILV
The price is moving within a descending channel on the 1-hour frame, adhering well to it, and is heading for a strong breakout and retest.
We are experiencing a rebound from the lower boundary of the descending channel, which is support at 13.56.
We are experiencing a downtrend on the RSI in

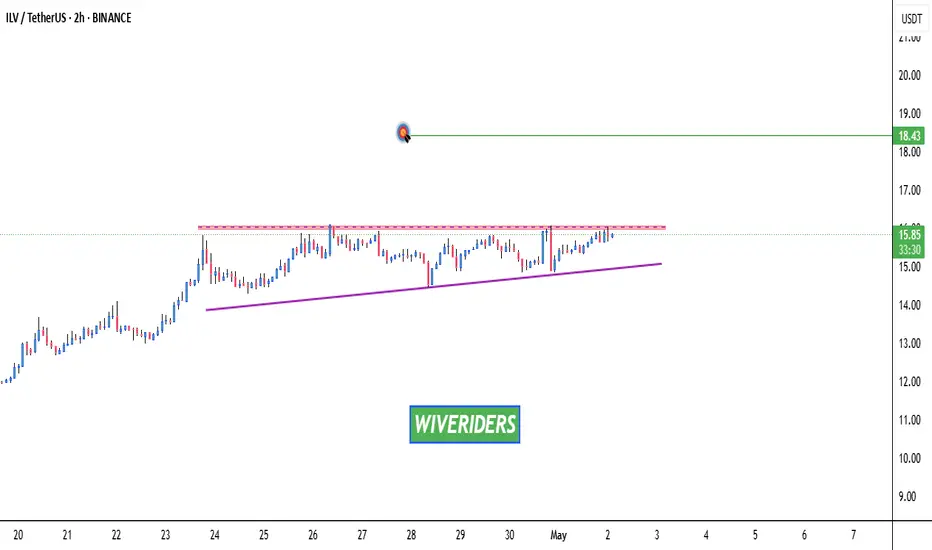
ascending triangle patternSEED_DONKEYDAN_MARKET_CAP:ILV is forming an ascending triangle pattern and is approaching a key red resistance zone. If the price breaks out above this level with confirmation, the target will be the green line level.
📈 Technical Overview:
Pattern: Ascending Triangle
Resistance Zone: Red area cur
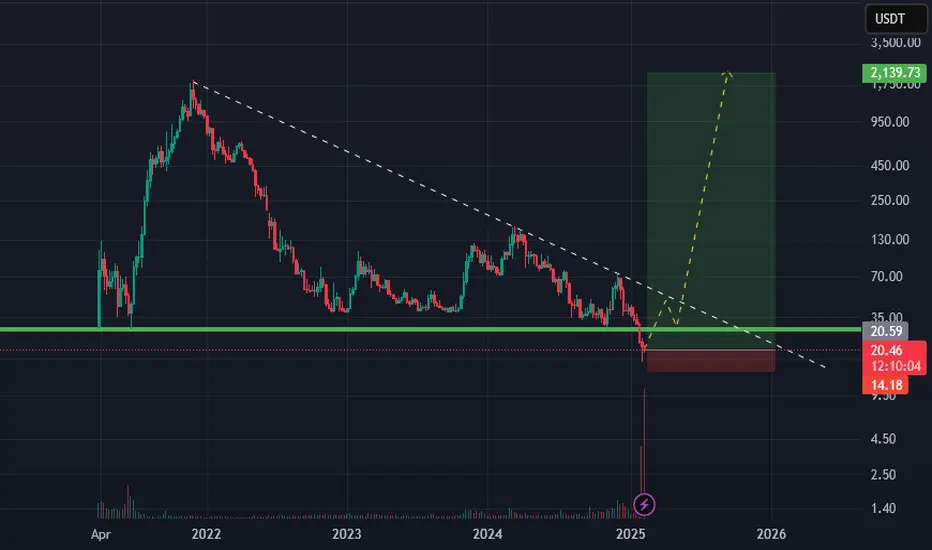
If it doesn't bounce here, I don't know whereILV grazing the 1.618 FIB, this Fibbonacci set-up would explain why it went so low.
ILVUSDT – Blue Box Resistance in Play!“Key level ahead—will the sellers step in, or are we breaking through?”
🔥 Key Insights:
✅ Blue Box = Resistance Zone – Watching for reactions.
✅ Breakout & Retest = Bullish Entry – No FOMO, only confirmed trades.
✅ Rejection = Short Setup – But only with LTF breakdown + CDV confirmation.
💡 How I’
#ILV/USDT#ILV
The price is moving in a descending channel on the 1-hour frame and is adhering to it well and is heading to break it strongly upwards and retest it
We have a bounce from the lower limit of the descending channel, this support is at a price of 14.30
We have a downtrend on the RSI indicator t
Bullish Time on ILV/USDT: A New Uptrend in Sight!In my opinion, ILV/USDT is showing strong signs of potential upward momentum. Bulls seem to be gaining control, and the market is shaping up for a possible breakout to new highs. The current price structure suggests the development of a bullish trend, supported by key levels of support and resistanc
See all ideas
Summarizing what the indicators are suggesting.
Oscillators
Neutral
SellBuy
Strong sellStrong buy
Strong sellSellNeutralBuyStrong buy
Oscillators
Neutral
SellBuy
Strong sellStrong buy
Strong sellSellNeutralBuyStrong buy
Summary
Neutral
SellBuy
Strong sellStrong buy
Strong sellSellNeutralBuyStrong buy
Summary
Neutral
SellBuy
Strong sellStrong buy
Strong sellSellNeutralBuyStrong buy
Summary
Neutral
SellBuy
Strong sellStrong buy
Strong sellSellNeutralBuyStrong buy
Moving Averages
Neutral
SellBuy
Strong sellStrong buy
Strong sellSellNeutralBuyStrong buy
Moving Averages
Neutral
SellBuy
Strong sellStrong buy
Strong sellSellNeutralBuyStrong buy
Displays a symbol's price movements over previous years to identify recurring trends.