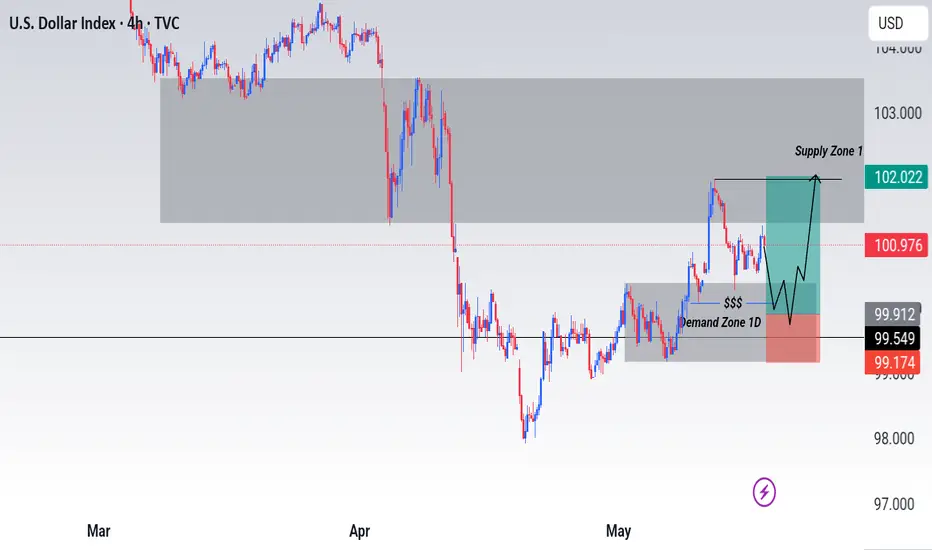
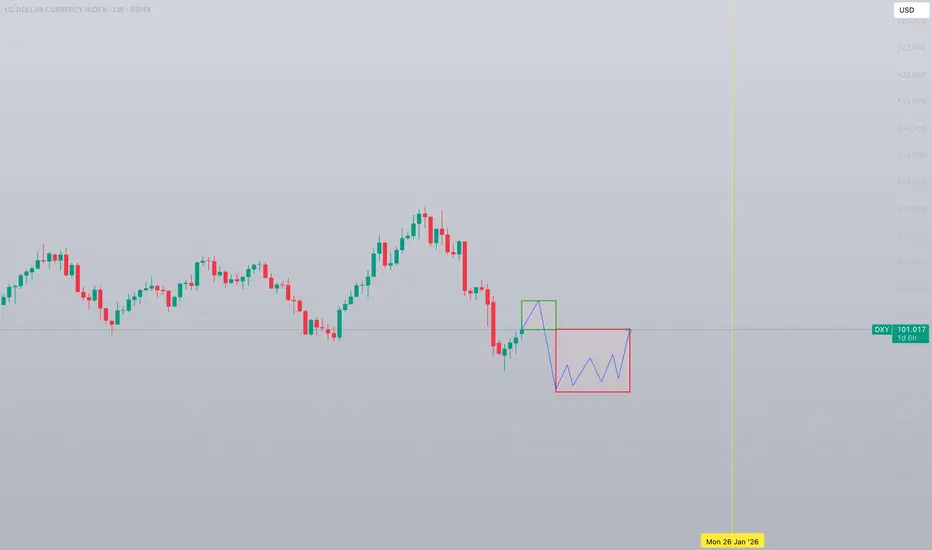
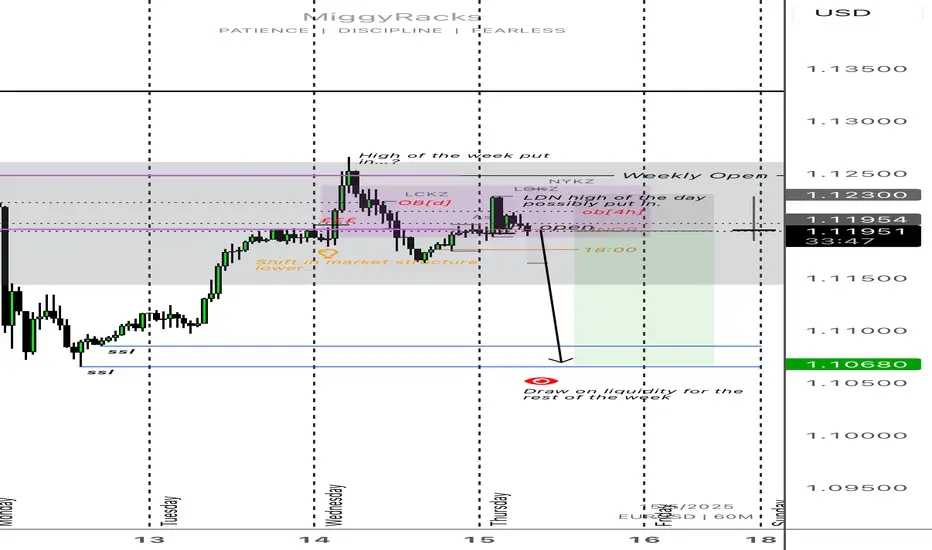
My Thoughts #008Well the pair could still buy after the sweep
Of the liquidity on the 1D Demand Zone.
Yet we will buy after we get a choch on the demand zone and sweep liquidity
The pair could invalidate the set up
And continue selling so use proper risk management
Let's do the most
DXY trade ideas
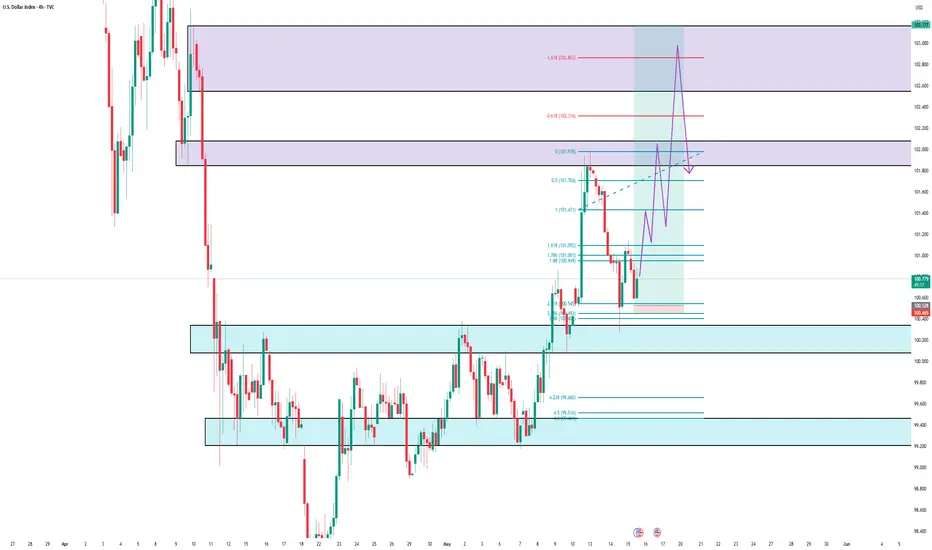
STRAP IN FOR A TURBULENT WEEK DXY- USD INDEX FORECAST Q2 W21 Y25DXY USD INDEX FORECAST Q2 W21 Y25
Professional Risk Managers👋
Welcome back to another FRGNT chart update📈
Diving into some Forex setups using predominantly higher time frame order blocks alongside confirmation breaks of structure.
✅ U.S. dollar index is a measure of the value of the dollar against a basket of six foreign currencies.
✅The currencies are the Euro, Swiss franc, Japanese yen, Canadian dollar, British pound, and Swedish krona.
💡Here are some trade confluences📝
✅ Break an d close below July 2023 key 100.00 levels.
✅ Foresee a pull back to, weekly imbalance, daily order block, daily 50ema, weekly order block and or weekly 50 ema.
✅ Awaiting to identify a significant break of structure bullish to use the DXY as confluence for our trading week 18 of Q2 toward key points of interest mentioned above.
✅ Forecasting continued bearish pressure long term.
✅Initially bullish outlook however upon price turn around. DXY to break 100.000 level again.
🔑 Remember, to participate in trading comes always with a degree of risk, therefore as professional risk managers it remains vital that we stick to our risk management plan as well as our trading strategies.
Pairs to look out for -
EURUSD
USDCHF
USDJPY
USDCAD
GBPUSD
Simply an opinion -
We always trade what we see and not what were think BUT, with that said it just feels... Unnatural to place too many bets against the USD. For that reason, our points of interest are not based on order black from too far in the distant weeks and month. We have identified more conservative targets for the DXY for the week 21 in Q2.
We foresee that with the deals that have been brokered alongside the steadiness of USD market sentiment, THE DXY MAY RISE AGAIN.
We forecast continued bearish sentiment of the DXY to the key points of interest area 98.000, weekly lows/daily lows BEFORE creating a monthly higher high inline with USD strength and Trumps seeks to sure up US ambitions.
📈The rest, we leave to the balance of probabilities.
💡Fail to plan. Plan to fail.
🏆It has always been that simple.
❤️Good luck with your trading journey, I shall see you at the very top.
🎯Trade consistent, FRGNT X

DOLLAR INDEXNews played a big part in the dollar tapping into that monthly fair value gap , looking for a rally up from the dollar index for the new week .

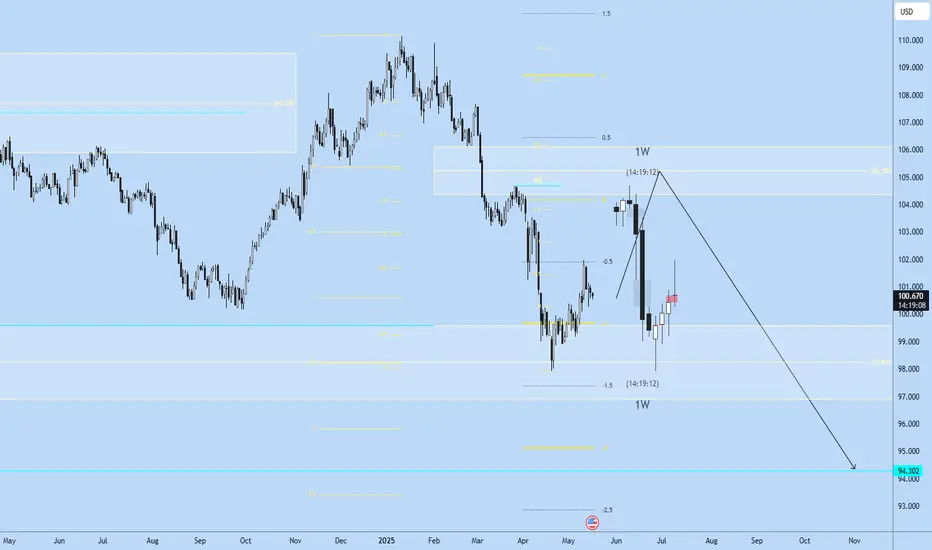
DXY Weekly ForecastDXY Weekly Forecast
- make sure to look for total down move when price reached 103.5 zone level
- in any case DXY has to come down to 96.000 level
"I Found the Code. I Trust the Algo. Believe Me, That’s It."

Stronger Dollar = BTC Weakens | Weak Dollar = BTC PeaksStronger Dollar (DXY), BTC & crypto weakens.
Weak Dollar (DXY), BTC & crypto Peaks.
These are not random patterns.
Macro forces are at play.
The outcome is clear. (Massive Bullrun)

$DXY Dump Incoming? What’s Next for Cryptos!TVC:DXY Dump Incoming? What’s Next for Cryptos!
The fractals in the chart are insane and indicate a drop in the U.S. Dollar Index (DXY) that can fuel significant moves in the crypto market:
Bitcoin & Altcoins Surge:
As the dollar weakens, cryptocurrencies become more attractive, expecting strong rallies in BTC and altcoins.
Commodities Rise:
Gold, silver, and oil typically gain, making crypto a competitor in the “store of value” race.
Risk-On Sentiment:
Investors shift to riskier assets like crypto, increasing prices.
Global FX Shift:
Other currencies gain strength, making crypto a go-to asset for global investors.
Bottom line: When the dollar drops, crypto thrives.
Like and repost if you agree! Bookmark for future posts!

Trump's dollar disregardUpdated version of my chart from 2022, whereby we predicted the rising strength of TVC:DXY to fill out the channel forecasted. Gold pumping to ATH's with increased political uncertainty throughout the globe and China dumping its US treasuries i am surprised the dollar has held sustained this price.
Here present is some technical analysis outlining the key levels for $TVC:DXY. Keeping this text short i am predicting the decline of the Dollar and i am currently keeping my eye on the GBP/USD chart alongside NOK/USD as see these as the most interesting in the FX markets.
DOLLARDollar (DXY) Outlook: Bearish Near-Term, Consolidation with Mild Depreciation
Current Trends: The U.S. dollar has weakened 8.4% year-to-date, pressured by:
Economic Contraction: Q1 2025 GDP shrank by 0.3%, driven by pre-tariff import surges and softening domestic demand.
Fed Policy Uncertainty: Mixed signals on inflation control and delayed rate cuts erode confidence.
Trade Tensions: Escalating U.S. tariffs disrupt global markets, favoring alternatives like the euro as a safe haven.
Technical Momentum: Bearish chart patterns suggest further downside, with key support levels at risk.
Reserve Currency Status: Despite concerns, the USD retains 57.8% of global reserves, providing a floor against rapid declines.
Treasury Yields and Recession Signals
Yield Levels
10-year: 4.439%
2-year: 3.976%
30-year: 4.900%
Inverted Yield Curve: The 10-2 spread remains negative, a historically reliable recession indicator. Past inversions preceded downturns by 18–92 weeks, signaling heightened recession risks.
Implications for USD:
Inverted curves typically weaken the dollar as markets price in future Fed rate cuts.
Rising long-term yields (e.g., 10-year at 4.439%) paradoxically coincide with dollar weakness, reflecting investor skepticism about U.S. economic resilience.
Key Drivers and Cross-Currency Impacts
Factor Impact on USD Impact on Yields
Fed Policy Uncertainty ↓ (Delayed cuts weigh) ↑ (Volatility in rate expectations)
Trade Tariffs ↓ (Safe-haven flows to EUR) ↑ (Risk premium in long-term yields)
Inverted Yield Curve ↓ (Recession fears) – (Historically precedes recessions)
Eurozone Growth (0.4% Q1) ↓ (EUR strength pressures USD) –
Conclusion
The U.S. dollar faces a bearish near-term bias, driven by economic softness, tariff headwinds, and technical breakdowns. Treasury yields, particularly the inverted curve, reinforce recession risks and further USD downside. However, the dollar’s reserve status and higher relative rates (vs. peers like the euro and yen) may limit severe declines, favoring consolidation with mild depreciation.
Watch for:
Fed communication on rate cuts and inflation.
Eurozone PMI data (May 22) to gauge EUR resilience.
10-2 yield spread dynamics for recession timing clues.
In summary, the dollar’s trajectory hinges on balancing recession risks against its yield advantage, with bears currently in control.

DXY - market structure - ADAPT to the marketDXY - market structure - ADAPT to the market , use risk and trade managment, is about risk managment and discipline
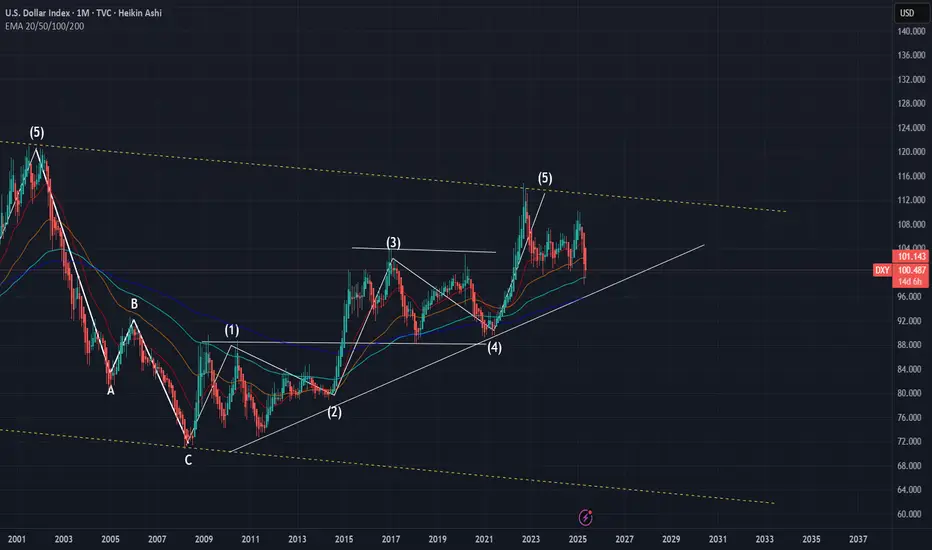
DXYLong term view on DXY. Retracement into range after reaching D 3.5-4 levels - which is also W 1-1.5 (SBZ) levels, to continue to W 2-2.5/M 1-1.5 levels. Eyes on M SIBI paired with bullish D SD levels. Commercials in net long positions typically leads to higher prices.
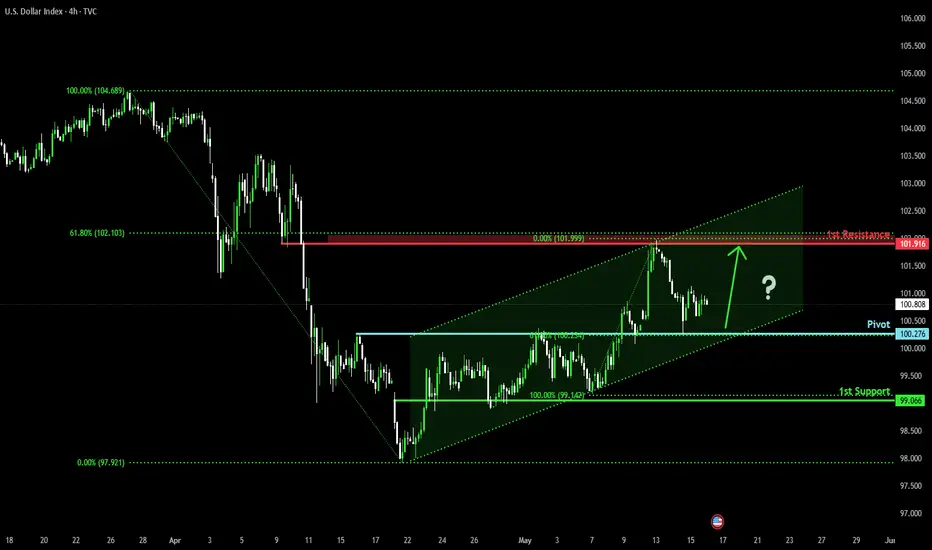
Bullish bounce?US Dollar Index (DXY) has bounced off the pivot and could rise to the 1st resistance.
Pivot: 100.27
1st Support: 99.06
1st Resistance: 101.91
Risk Warning:
Trading Forex and CFDs carries a high level of risk to your capital and you should only trade with money you can afford to lose. Trading Forex and CFDs may not be suitable for all investors, so please ensure that you fully understand the risks involved and seek independent advice if necessary.
Disclaimer:
The above opinions given constitute general market commentary, and do not constitute the opinion or advice of IC Markets or any form of personal or investment advice.
Any opinions, news, research, analyses, prices, other information, or links to third-party sites contained on this website are provided on an "as-is" basis, are intended only to be informative, is not an advice nor a recommendation, nor research, or a record of our trading prices, or an offer of, or solicitation for a transaction in any financial instrument and thus should not be treated as such. The information provided does not involve any specific investment objectives, financial situation and needs of any specific person who may receive it. Please be aware, that past performance is not a reliable indicator of future performance and/or results. Past Performance or Forward-looking scenarios based upon the reasonable beliefs of the third-party provider are not a guarantee of future performance. Actual results may differ materially from those anticipated in forward-looking or past performance statements. IC Markets makes no representation or warranty and assumes no liability as to the accuracy or completeness of the information provided, nor any loss arising from any investment based on a recommendation, forecast or any information supplied by any third-party.
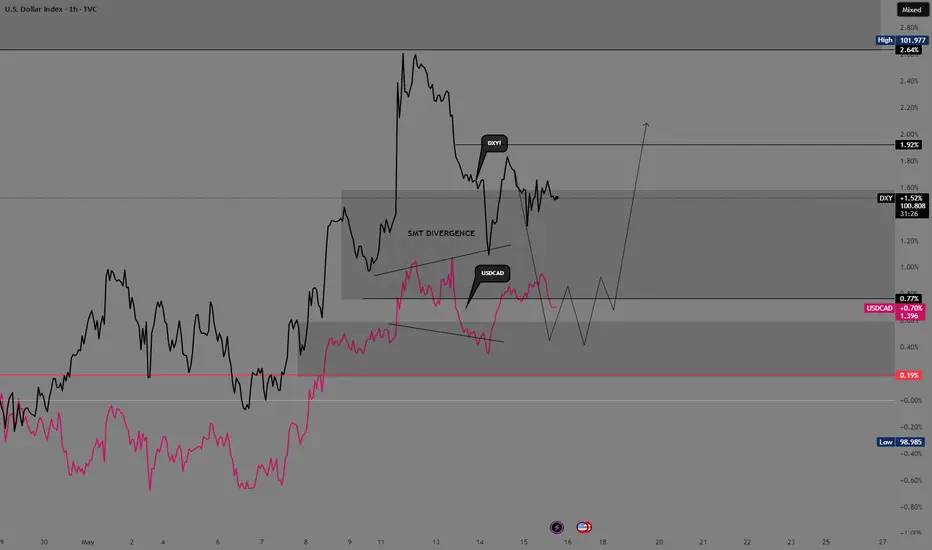
DXY Comparing the dollar index and Usdcad , According to price, I can see an SMT Divergence upon the two corelated pairs that should be moving on the same direction , but divergence was formed. Looking forward for bearish on the Dollar index this day 16th May 2025.
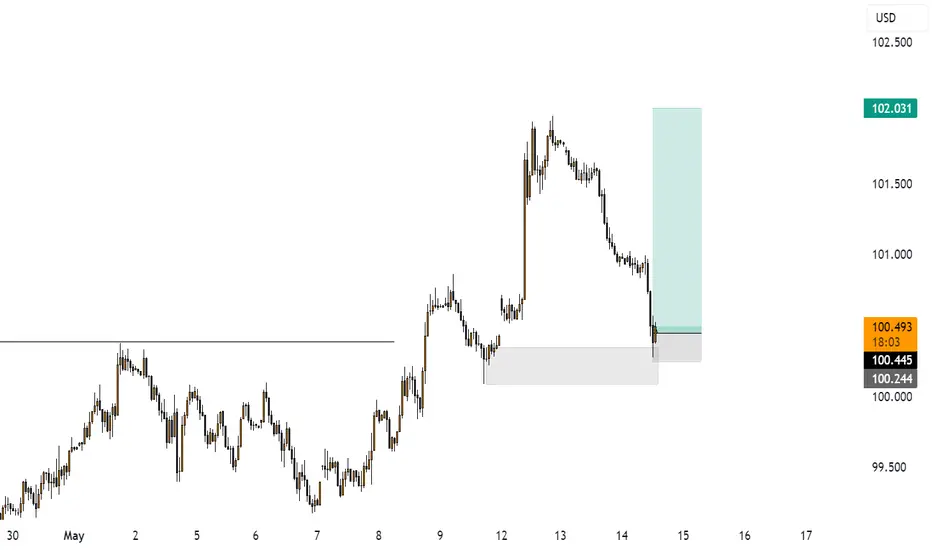
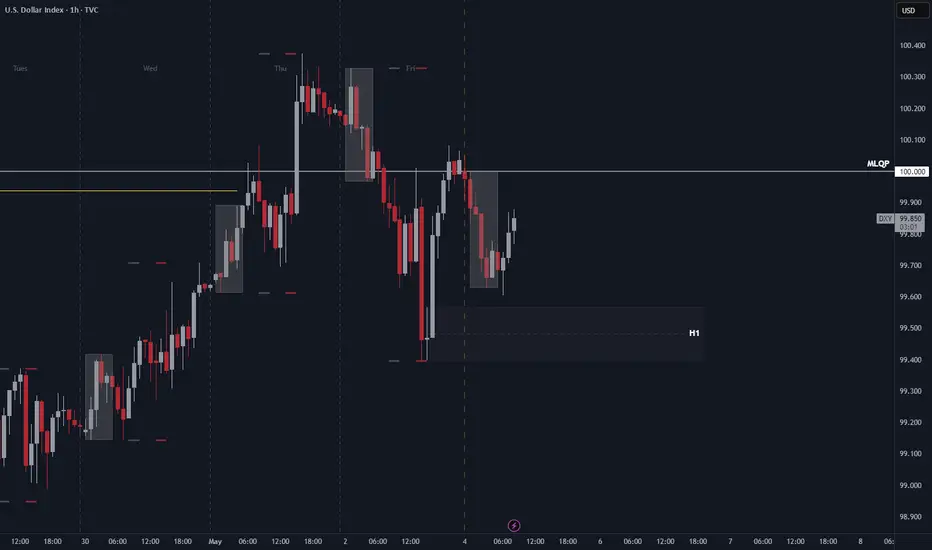
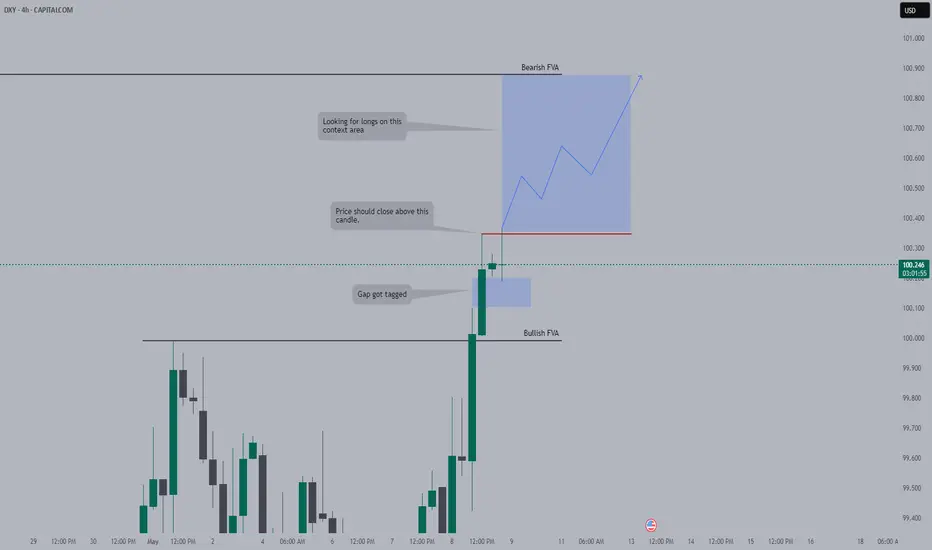
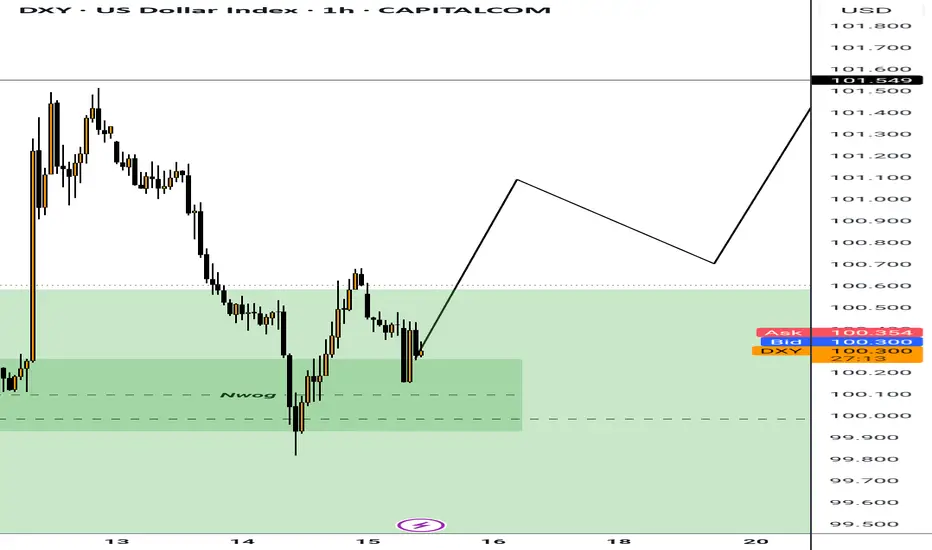
DXY (US Dollar): Bullish Order FlowA bullish order block has been identified on the H1 timeframe, situated below the Asian session range. With the US Dollar maintaining steady strength, there is potential for price to retrace into this order block for mitigation. Should this occur, a continuation of the bullish trend is anticipated, with price likely to rally and break above the recent structural high.
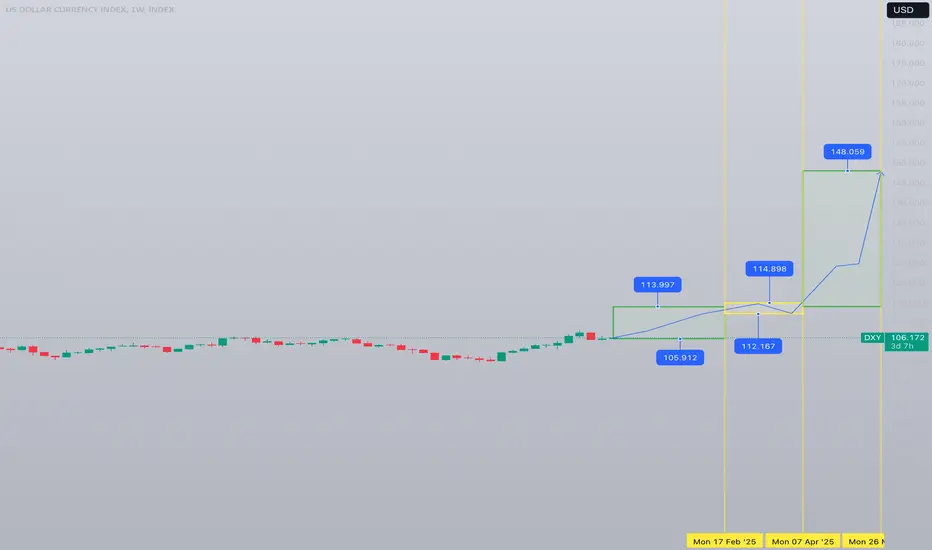
DXY 1W Forecast until the end of MAY 2025Up-trend will resume and last until the end of February 2025 topping no higher than 114. Current bottom is in at 105.9
Hence, it shouldn't fall below.
After February a consolidation period of 1,5 months will trap price action between the bottom of 122.16 and upper level of 114.9
The spring squeezed during consolidation will provide enough energy for further upwards movement starting in the end of April 2025. This will ignite a chain of devaluation of national currencies followed by epidemic inflation across the globe. This will finish/cool-down at DXY reaching the mark of 148.
New reality after May 2025?
US Dollar Index 1WCurrent strengthening of DXY will not last for long. Optimal level for start of reversal is 103.122
After the reversal the downtrend will resume and go for final stage (discharge) which may look like a flash crash on the last week of June 2025 down to 96.362
Starting from July 2025 DXY will print a reversal pattern moving sideways and slightly up all the way until September 2025. In the mid-end of September we will see a major retest which will mark a start big bullish cycle and global domination of US Dollar.
Looking for Longs in DXYDXY Looks good to look for longs. Arguably, I will be looking for scalping longs only on Friday. This is due to no high impact news to drive price, hence, we might face consolidation on higher timeframe.
DXY: Absolute Price Collapse Ahead! Short!
My dear friends,
Today we will analyse DXY together☺️
The in-trend continuation seems likely as the current long-term trend appears to be strong, and price is holding below a key level of 100.450 So a bearish continuation seems plausible, targeting the next low. We should enter on confirmation, and place a stop-loss beyond the recent swing level.
❤️Sending you lots of Love and Hugs❤️

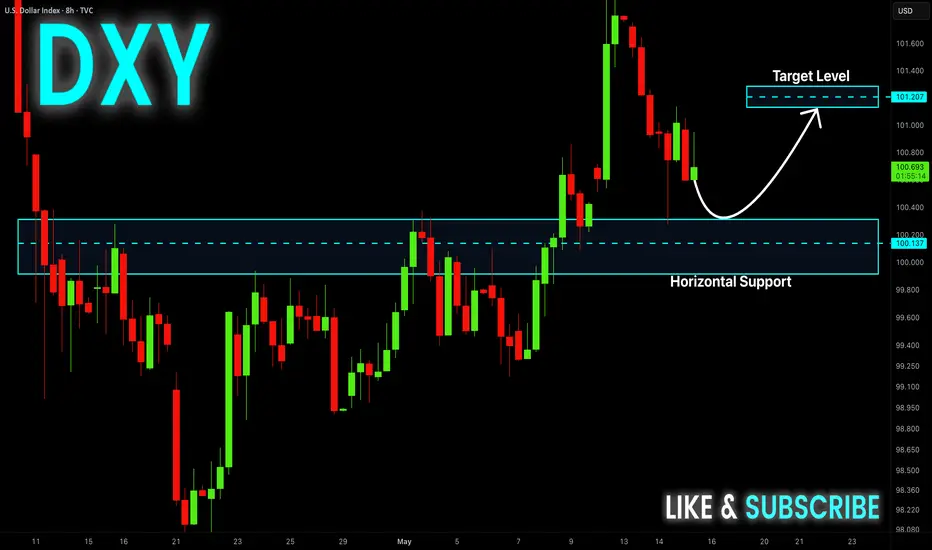
DXY Bullish Rebound Expected! Buy!
Hello,Traders!
DXY is making a local
Bearish correction towards
The horizontal support level
Around 100.200 but we are
Locally bullish biased so
After the retest we will be
Expecting a local bullish rebound
Buy!
Comment and subscribe to help us grow!
Check out other forecasts below too!
Disclosure: I am part of Trade Nation's Influencer program and receive a monthly fee for using their TradingView charts in my analysis.
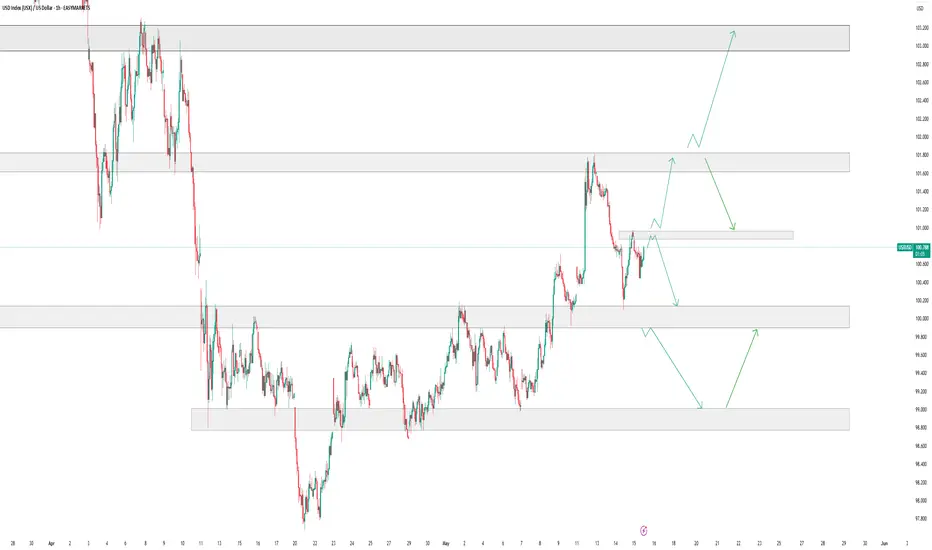
Dxy 1Hr Analysis 15-May-2025The US Dollar Index (DXY) showed signs of recovery following its sharp decline in April 2025. This rebound appeared to coincide with easing concerns around trade tensions between the US and other countries, particularly China. The index climbed toward the 102 level before retreating, likely influenced by lower-than-expected CPI (inflation) data.
Looking ahead, potential scenarios for DXY include:
• A sustained move above the 101 level may open the door for a test of the 102 area. If momentum continues, market participants may observe whether the index approaches the 103–103.2 range.
• Alternatively, if DXY struggles to stay above the 101 level and a downward pressure persists, attention may shift to the 100, and even lower to the 99 level — a zone that has previously attracted buying interest.
Disclaimer: easyMarkets Account on TradingView allows you to combine easyMarkets industry leading conditions, regulated trading and tight fixed spreads with TradingView's powerful social network for traders, advanced charting and analytics. Access no slippage on limit orders, tight fixed spreads, negative balance protection, no hidden fees or commission, and seamless integration.
Any opinions, news, research, analyses, prices, other information, or links to third-party sites contained on this website are provided on an "as-is" basis, are intended only to be informative, is not an advice nor a recommendation, nor research, or a record of our trading prices, or an offer of, or solicitation for a transaction in any financial instrument and thus should not be treated as such. The information provided does not involve any specific investment objectives, financial situation and needs of any specific person who may receive it. Please be aware, that past performance is not a reliable indicator of future performance and/or results. Past Performance or Forward-looking scenarios based upon the reasonable beliefs of the third-party provider are not a guarantee of future performance. Actual results may differ materially from those anticipated in forward-looking or past performance statements. easyMarkets makes no representation or warranty and assumes no liability as to the accuracy or completeness of the information provided, nor any loss arising from any investment based on a recommendation, forecast or any information supplied by any third-party.
TARIFF IMPACT TO DOLLAR ?Hi Trader,
Here my analysis for TVC:DXY , Looking on how the hot topic about tariff right now. For now bias on the strong move for TVC:DXY
DXY buyMy bias on the 4hr timeframe is definitely bullish, this technical analysis and the deals that we see trump making with the mid east guys is definitely a good sign for the dollar, hopefully powell's speech today will be good news.
DXY price created an impulse to the downside now we starting to see a correction forming
waiting for the completion of the structure in accordance to our trading plan to take
The us Dollars to the downside.
