DOLLAR INDEXThe DXY (U.S. Dollar Index) is a measure of the U.S. dollar’s value relative to a basket of six major foreign currencies: the euro (57.6%), Japanese yen (13.6%), British pound (11.9%), Canadian dollar (9.1%), Swedish krona (4.2%), and Swiss franc (3.6%). It serves as a benchmark for the dollar’s global strength and is influenced by macroeconomic factors like interest rates, trade flows, and inflation expectations.
10 years bond yield Correlations with DXY
1. 10-Year Bond Yield
Positive Correlation: The DXY and U.S. 10-year Treasury yields generally move in the same direction. Higher yields attract foreign capital into U.S. bonds, increasing demand for dollars and strengthening the DXY.
Current 10-Year Yield (June 12, 2025): 4.36%, down slightly from 4.41% the previous day but up 1.16% year-over-year.
2. Bond Price
Inverse Relationship with Yields: Bond prices fall when yields rise (and vice versa). Since DXY and yields are positively correlated, the dollar tends to strengthen when bond prices decline.
3. Interest Rates
Direct Link: Higher U.S. interest rates increase the dollar’s appeal as investors seek higher returns, boosting DXY. Conversely, rate cuts weaken the dollar.
Example: The Federal Reserve’s rate hikes in 2023–2024 contributed to DXY strength, while recent rate-cut expectations have moderated its gains.
Current 10-Year Treasury Yield
As of June 12, 2025, the 10-year Treasury yield is 4.36%, below its long-term average of 5.83%.
Key Drivers of DXY in 2025
Federal Reserve Policy: Markets are pricing in potential rate cuts later in 2025, which could limit DXY upside.
Global Risk Sentiment: Safe-haven dollar demand rises during geopolitical or economic uncertainty.
Inflation Trends: Persistent U.S. inflation could delay Fed easing, supporting DXY
technical level to watch is the support level at 97,949
DXY trade ideas
US dollar, a potential bullish divergence to watchThe US Federal Reserve (FED) recently updated its economic projections against a backdrop of growing uncertainty. It is now openly concerned about a scenario of stagflation, a combination of weak growth, persistent inflation and rising unemployment. This concern stems in particular from the as yet unquantified impact of the new tariffs imposed by the Trump administration, as well as rising geopolitical tensions, particularly in the Middle East.
Gloomy forecasts, but monetary policy still flexible
At its last meeting, the FED kept its key rate in the 4.25% - 4.5% range, while publishing gloomy forecasts for the US economy. By the end of 2025, it anticipates PCE inflation at around 3%, unemployment at 4.5% and moderate growth. Despite this worrying picture, the central bank is still planning two rate cuts this year, demonstrating its determination to support economic activity.
Nevertheless, this monetary stance is the subject of debate within the committee: ten members support the cuts, while seven believe that rates should remain unchanged. Jerome Powell, Chairman of the FED, advocates caution, insisting on the need to observe the evolution of economic data before acting, particularly in view of the delayed effects of tariffs.
The FED is faced with a dilemma: it must curb inflation without destroying growth. Its diagnosis of stagflation is harsh, but perhaps too pessimistic if inflation figures remain under control. A rate cut in September is still conceivable, but will largely depend on the evolution of geopolitical tensions and international trade in the weeks ahead.
Below, you can see the table with the latest update of the FED's macroeconomic projections
US dollar (DXY), a potential bullish technical divergence to be monitored
The FED's confirmed intransigence is having an impact on the foreign exchange market. While the US dollar has been the weakest Forex currency since the beginning of the year, it has been stabilizing for several weeks now. If the FED maintains its current wait-and-see stance on a resumption of Fed funds rate cuts, the US dollar could be close to a low point on the Forex market.
At present, there are no resistance breaches to suggest this, but a potential bullish technical divergence has appeared on the weekly timeframe. In the past, this signal was a precursor to a future rebound in the US dollar against a basket of major Forex currencies.
DISCLAIMER:
This content is intended for individuals who are familiar with financial markets and instruments and is for information purposes only. The presented idea (including market commentary, market data and observations) is not a work product of any research department of Swissquote or its affiliates. This material is intended to highlight market action and does not constitute investment, legal or tax advice. If you are a retail investor or lack experience in trading complex financial products, it is advisable to seek professional advice from licensed advisor before making any financial decisions.
This content is not intended to manipulate the market or encourage any specific financial behavior.
Swissquote makes no representation or warranty as to the quality, completeness, accuracy, comprehensiveness or non-infringement of such content. The views expressed are those of the consultant and are provided for educational purposes only. Any information provided relating to a product or market should not be construed as recommending an investment strategy or transaction. Past performance is not a guarantee of future results.
Swissquote and its employees and representatives shall in no event be held liable for any damages or losses arising directly or indirectly from decisions made on the basis of this content.
The use of any third-party brands or trademarks is for information only and does not imply endorsement by Swissquote, or that the trademark owner has authorised Swissquote to promote its products or services.
Swissquote is the marketing brand for the activities of Swissquote Bank Ltd (Switzerland) regulated by FINMA, Swissquote Capital Markets Limited regulated by CySEC (Cyprus), Swissquote Bank Europe SA (Luxembourg) regulated by the CSSF, Swissquote Ltd (UK) regulated by the FCA, Swissquote Financial Services (Malta) Ltd regulated by the Malta Financial Services Authority, Swissquote MEA Ltd. (UAE) regulated by the Dubai Financial Services Authority, Swissquote Pte Ltd (Singapore) regulated by the Monetary Authority of Singapore, Swissquote Asia Limited (Hong Kong) licensed by the Hong Kong Securities and Futures Commission (SFC) and Swissquote South Africa (Pty) Ltd supervised by the FSCA.
Products and services of Swissquote are only intended for those permitted to receive them under local law.
All investments carry a degree of risk. The risk of loss in trading or holding financial instruments can be substantial. The value of financial instruments, including but not limited to stocks, bonds, cryptocurrencies, and other assets, can fluctuate both upwards and downwards. There is a significant risk of financial loss when buying, selling, holding, staking, or investing in these instruments. SQBE makes no recommendations regarding any specific investment, transaction, or the use of any particular investment strategy.
CFDs are complex instruments and come with a high risk of losing money rapidly due to leverage. The vast majority of retail client accounts suffer capital losses when trading in CFDs. You should consider whether you understand how CFDs work and whether you can afford to take the high risk of losing your money.
Digital Assets are unregulated in most countries and consumer protection rules may not apply. As highly volatile speculative investments, Digital Assets are not suitable for investors without a high-risk tolerance. Make sure you understand each Digital Asset before you trade.
Cryptocurrencies are not considered legal tender in some jurisdictions and are subject to regulatory uncertainties.
The use of Internet-based systems can involve high risks, including, but not limited to, fraud, cyber-attacks, network and communication failures, as well as identity theft and phishing attacks related to crypto-assets.
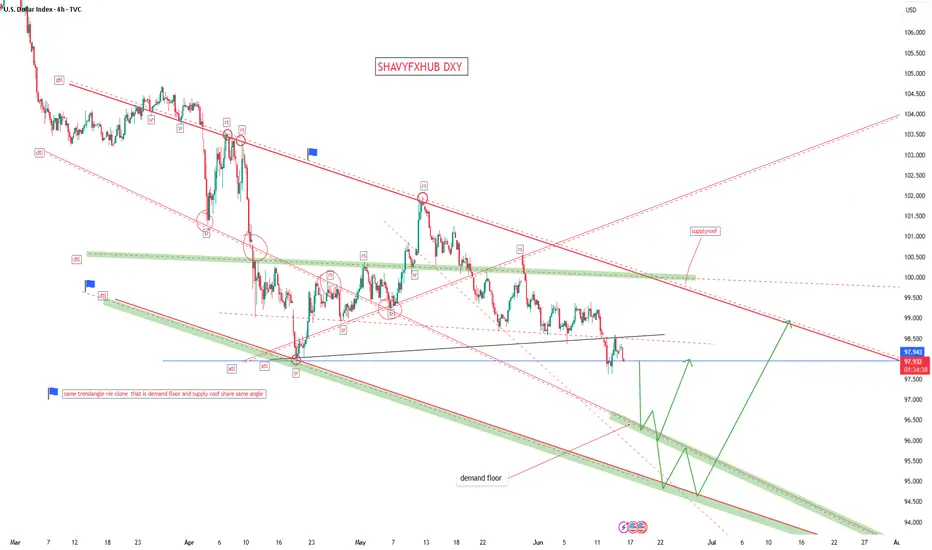
DXY OUTLOOK - SWING SETUPThe dollar has been on a six-month decline, but I anticipate a recovery. This is primarily due to the current economic climate, geopolitical landscape, and the dollar's traditional role as a safe-haven currency during periods of significant uncertainty
"May fortune attend thee, and thy trade prosper." .......L2Earned

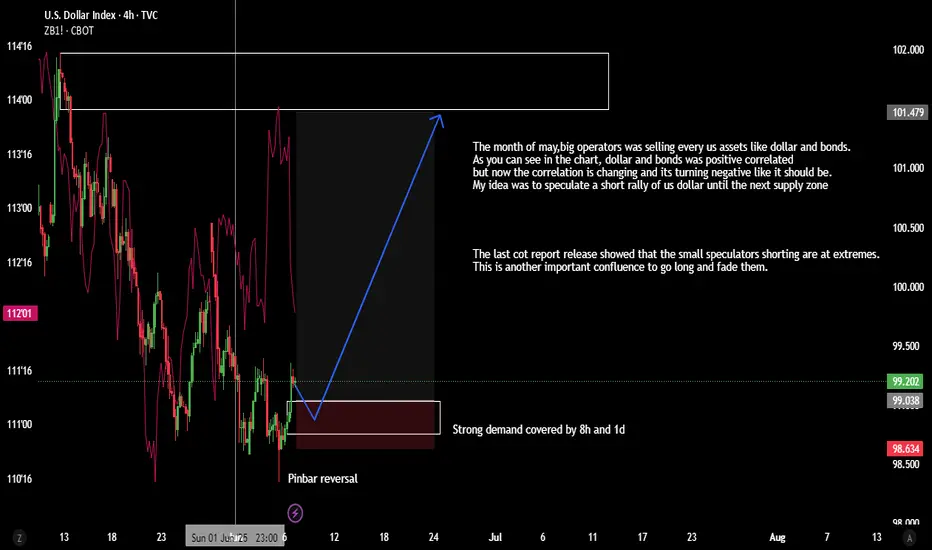
Short Idea on DXYBased on :
- Investors surprised by the cpi new and seeking safety in bonds (ZB1!) making dollar go down
- break out of an important support level
- 2 supply zones
Price action Dxy broke structure above had to wait for this confirmation all that needed is sweep the liquidity above
check the trendIt is expected that the correction trend will form up to the specified support zone, then there will be a possibility of a trend change. With the failure of the green resistance zone, confirmation of the bullish trend will be formed.
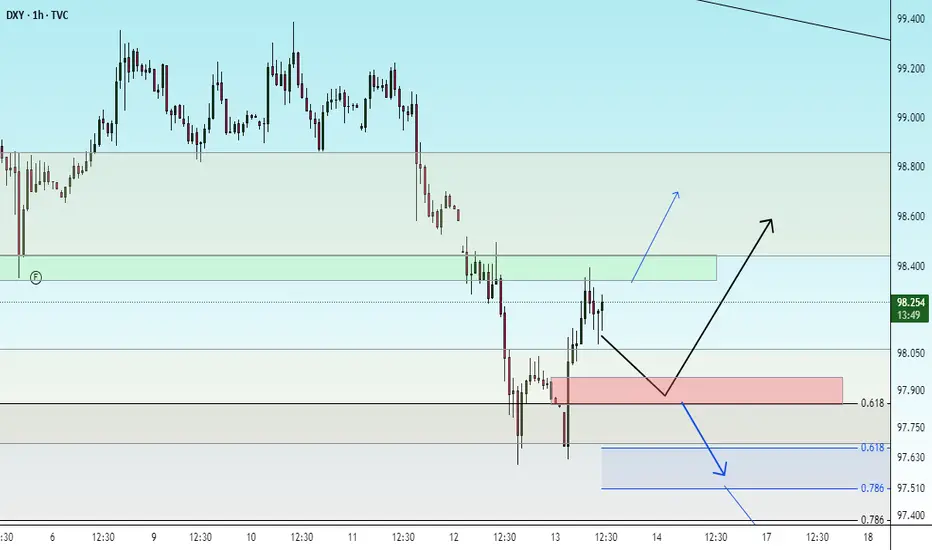
Buy Idea on Us Dollar Index (Dxy)Based on :
- Demand zone
- Pin bar Reversal
- Changing of correlation between dxy and zb1!
- cot report
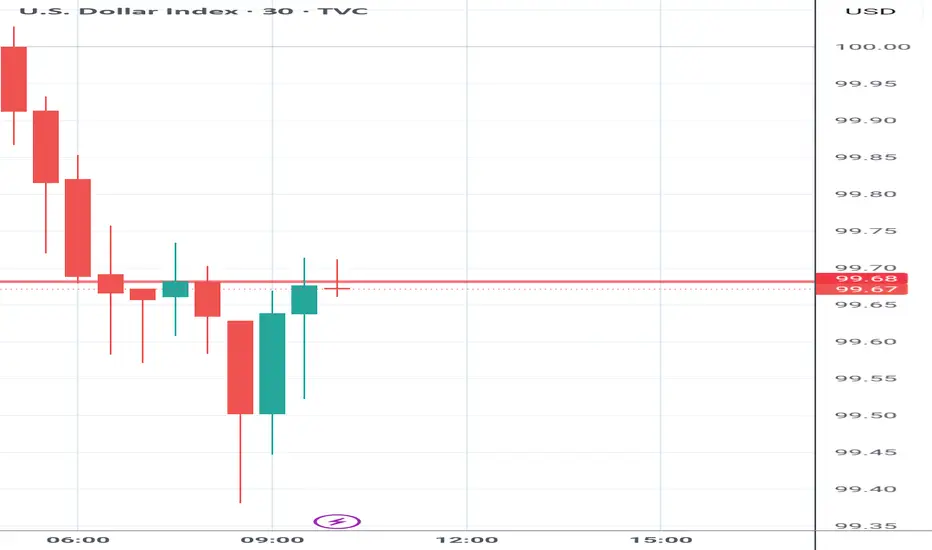
Price action If the 30 min candle close above the red line I'll resume selling Gbpusd currently sitting on my hands
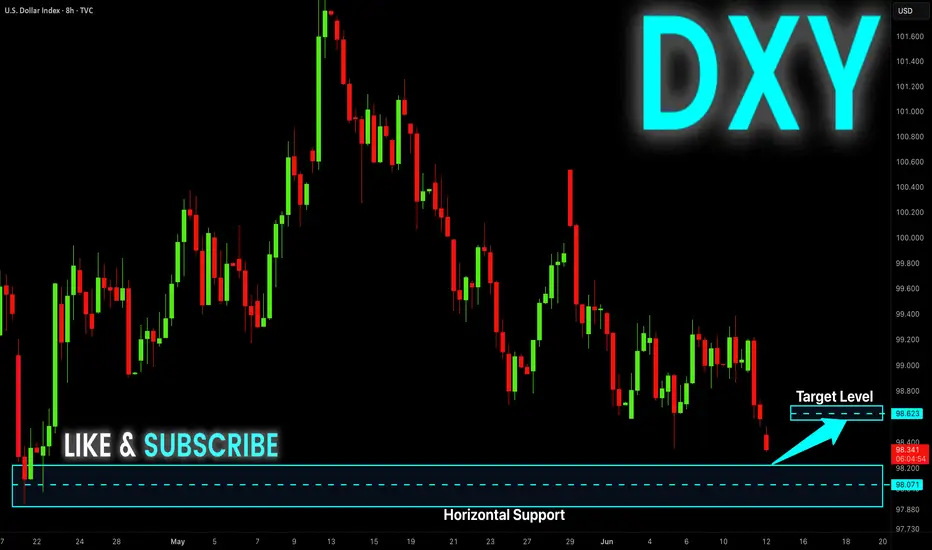
DXY Support Ahead! Buy!
Hello,Traders!
DXY keeps going down
But the strong horizontal
Support is ahead around 98.000
So after the price hit the level
We will be expecting a
Local rebound and a move up
Buy!
Comment and subscribe to help us grow!
Check out other forecasts below too!
Disclosure: I am part of Trade Nation's Influencer program and receive a monthly fee for using their TradingView charts in my analysis.
Short Term USD Strength This Week! Sell The Majors?This is the FOREX futures outlook for the week of Jun 8 - 12th.
In this video, we will analyze the following FX markets:
USD Index, EUR, GBP, AUD, NZD, CAD, CHF, and JPY.
USD gained some strength on Friday's job data. Talks with China this week may add to it. But I believe the bullishness will be short term.
Look for valid sells in EUR and GBP. Be cautious with AUD and NZD. CAD and CHF will also offer opportunities to sells.
CPI Data due Wed, making that day and the days that follow potentially the best trading days this week.
Enjoy!
May profits be upon you.
Leave any questions or comments in the comment section.
I appreciate any feedback from my viewers!
Like and/or subscribe if you want more accurate analysis.
Thank you so much!
Disclaimer:
I do not provide personal investment advice and I am not a qualified licensed investment advisor.
All information found here, including any ideas, opinions, views, predictions, forecasts, commentaries, suggestions, expressed or implied herein, are for informational, entertainment or educational purposes only and should not be construed as personal investment advice. While the information provided is believed to be accurate, it may include errors or inaccuracies.
I will not and cannot be held liable for any actions you take as a result of anything you read here.
Conduct your own due diligence, or consult a licensed financial advisor or broker before making any and all investment decisions. Any investments, trades, speculations, or decisions made on the basis of any information found on this channel, expressed or implied herein, are committed at your own risk, financial or otherwise.

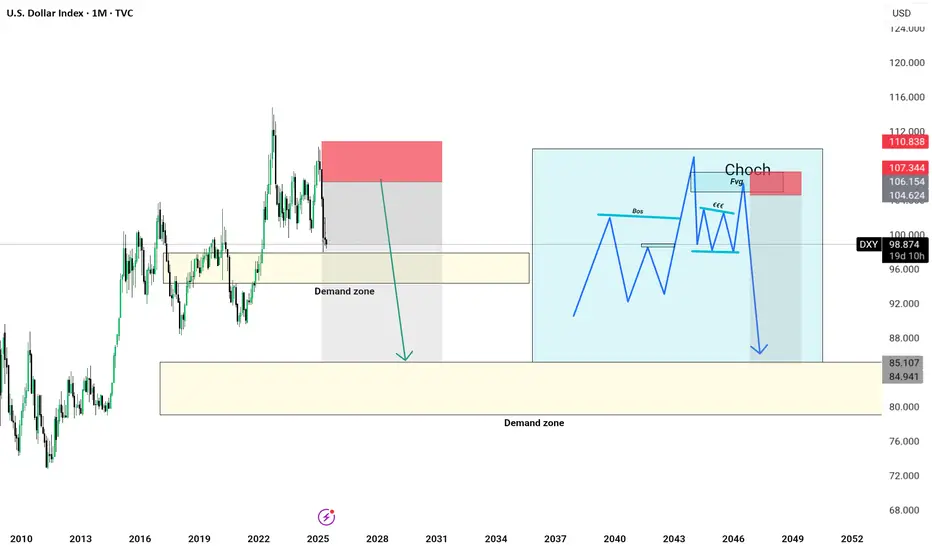
DXY Monthly Analysis | Smart Money Concept + CHoCH BreakdownPair: US Dollar Index (DXY)
Timeframe: 1M (Monthly)
Strategy: Smart Money Concept (SMC) + Market Structure + Demand/Supply Zones
Bias: Bearish (Mid to Long-Term)
Breakdown:
Price reacted strongly from the monthly supply zone (110–104), showing signs of exhaustion.
Clear CHoCH (Change of Character) visible at the top structure, confirming loss of bullish intent.
Internal structure printed a liquidity sweep + FVG (Fair Value Gap) ➝ BOS ➝ lower low.
Current PA (price action) is targeting the first demand zone near 92–94, but major interest lies at the macro demand zone (85.100–84.900).
This level aligns with unmitigated historical demand and potential long-term accumulation range.
---
📅 Projection:
Expecting a continuation to the downside after retesting minor imbalance zones.
Potential multi-year bearish leg forming Wave 3 (macro view).
Ideal accumulation/buy zone: 85.100–84.900 – if structure supports.
---
📌 Key Levels to Watch:
Supply Zone: 110.800 – 104.600
CHoCH Level: ~102.300
Short-Term Demand: 92.000 – 94.000
Long-Term Demand (Institutional Interest): 85.100 – 84.900
---
💡 Conclusion: Smart Money has exited from premium pricing, and the macro structure aligns with a bearish transition. As long as price respects current lower highs, we may see a deeper correction or possible trend reversal near 85 levels.
---
🧠 #DXY #SmartMoney #CHoCH #ForexAnalysis #SupplyAndDemand #PriceAction #Forex #Month
Dollar on the move now after the news - as expectedQuick follow up on other videos
Dollar is heading strong towards our target as outlined for the last few weeks. If you followed all my videos you would see where markey technicals came into play the last few weeks
Beautiful read on this

Bearish continuation?US Dollar Index (DXY) is rising towards the pivot and could drop to the 1st support.
Pivot: 100.54
1st Support: 98.32
1st Resistance: 101.78
Risk Warning:
Trading Forex and CFDs carries a high level of risk to your capital and you should only trade with money you can afford to lose. Trading Forex and CFDs may not be suitable for all investors, so please ensure that you fully understand the risks involved and seek independent advice if necessary.
Disclaimer:
The above opinions given constitute general market commentary, and do not constitute the opinion or advice of IC Markets or any form of personal or investment advice.
Any opinions, news, research, analyses, prices, other information, or links to third-party sites contained on this website are provided on an "as-is" basis, are intended only to be informative, is not an advice nor a recommendation, nor research, or a record of our trading prices, or an offer of, or solicitation for a transaction in any financial instrument and thus should not be treated as such. The information provided does not involve any specific investment objectives, financial situation and needs of any specific person who may receive it. Please be aware, that past performance is not a reliable indicator of future performance and/or results. Past Performance or Forward-looking scenarios based upon the reasonable beliefs of the third-party provider are not a guarantee of future performance. Actual results may differ materially from those anticipated in forward-looking or past performance statements. IC Markets makes no representation or warranty and assumes no liability as to the accuracy or completeness of the information provided, nor any loss arising from any investment based on a recommendation, forecast or any information supplied by any third-party.

DXY's pullback is dueThe USD has been very weak, which means that a pullback is due. I won't be participating in shorting the USD this coming week despite the Fundamentals have been telling us. Seeing through the technical point of view, we 've seen that May's low had been purged last week. Price action is anticipated to make its way buyside. The full-bodied Daily bearish candle to the left at 100.500 is going to be the magnet for price to seek into mitigate next week.

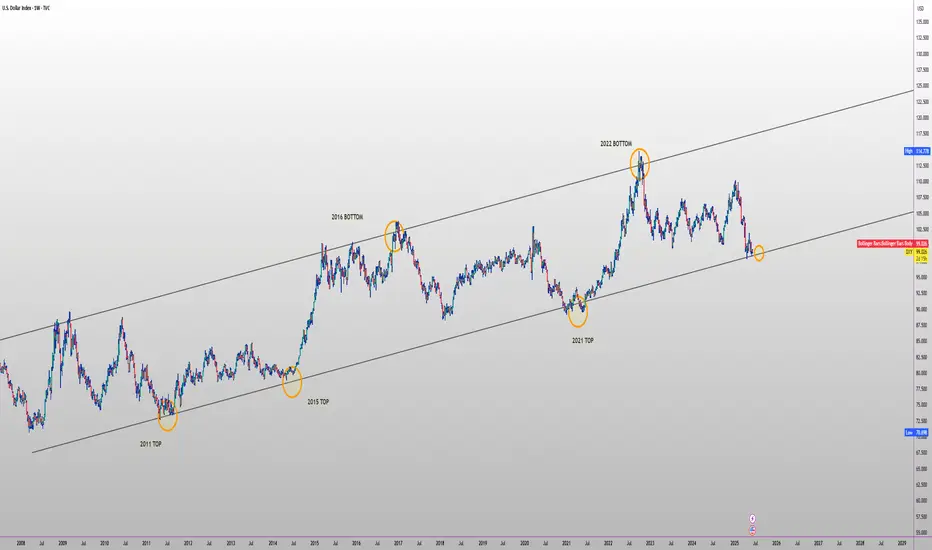
CRYPTO CORRELATION WITH DXYThe U.S. Dollar Index (DXY) is probing 99-100—the same lower-rail support of its 14-year ascending channel that caught the 2011, 2015 and 2021 inflection points and launched the 2016 and 2022 dollar surges
macrotrends.net
forex.com
. History shows that when the dollar sinks beneath this zone (April 2017 and June 2020) Bitcoin has ripped 10-fold or more within months
cointelegraph.com
, whereas a sharp bounce from here (September 2022 above 110) coincided with BTC’s plunge to the cycle low near $16 k
forex.com
coindesk.com
. The macro backdrop currently favours at least a reflex rally: the Fed’s latest survey and dot-plot point to “higher-for-longer” policy with only two cuts pencilled in for 2025
reuters.com
finance.yahoo.com
, 10-year Treasuries still yield about 4.7 %—a near-cycle high that supports dollar carry demand
wsj.com
, and U.S. growth has just been revised up to 2.7 % for 2025 while euro-area PMIs languish in contraction and the ECB is already easing
mdm.com
ecb.europa.eu
. Add in lingering negative BTC-DXY correlation metrics
coindesk.com
and the structural importance of the psychologically charged 100 level, and this pivot becomes a practical timing gauge: a sustained break below 99 would clear the way for the next broad crypto bull-phase, whereas a confirmed dollar rebound warns that any exuberance in digital assets could mark a cyclical top.
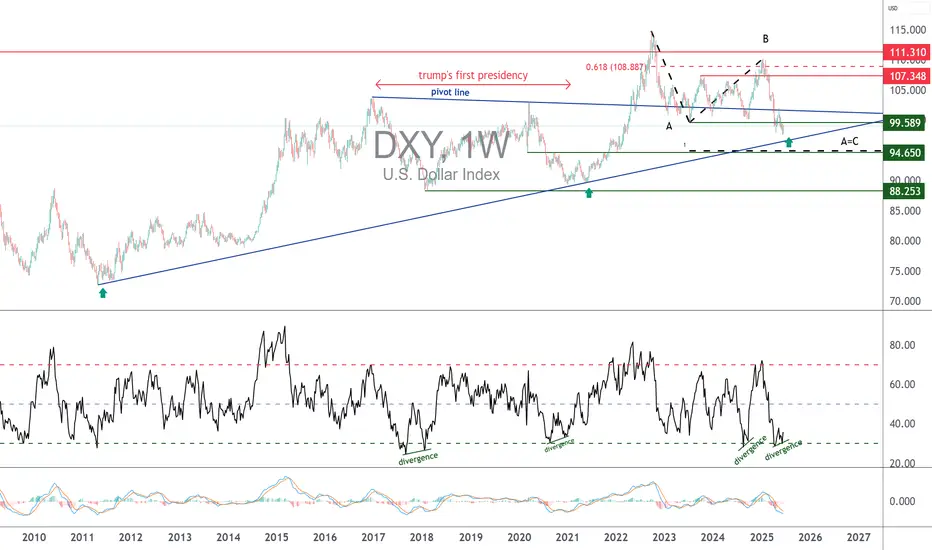
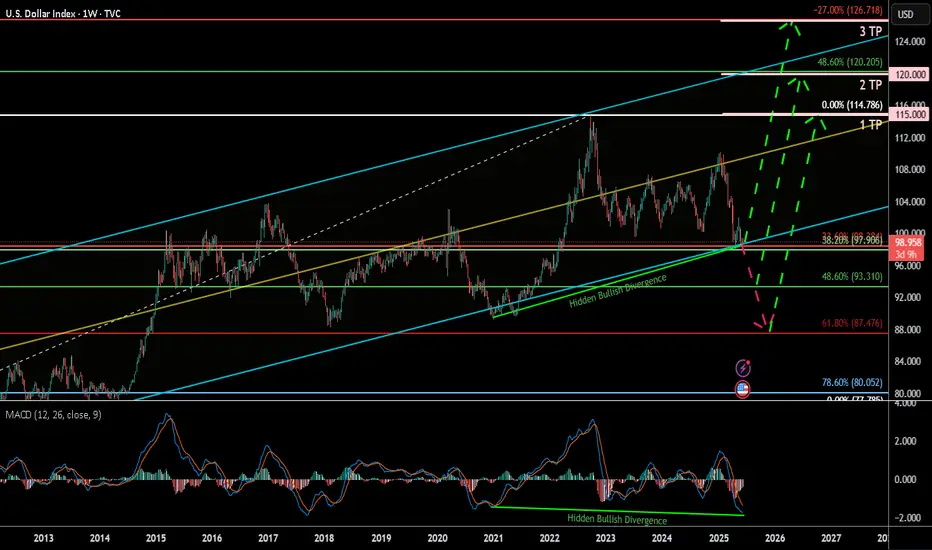
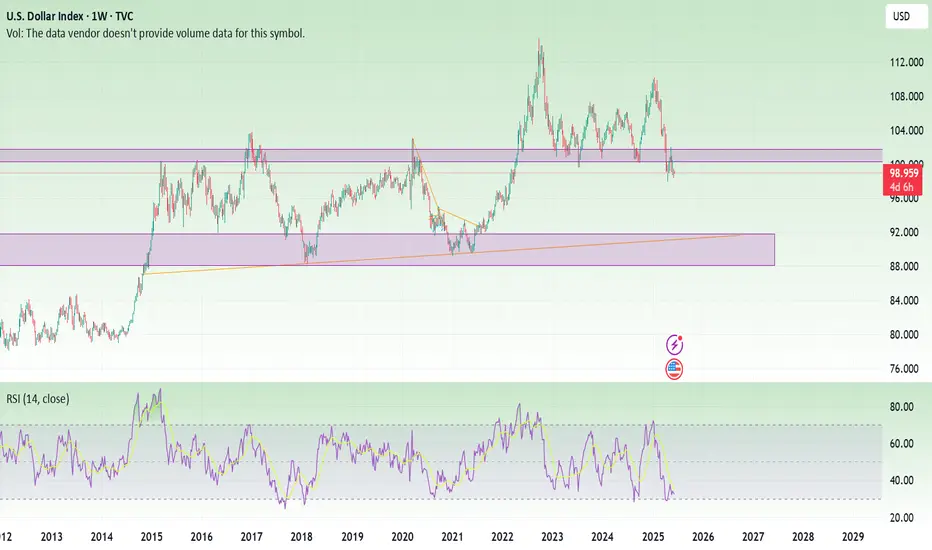
U.S. Dollar Index (DXY) Weekly 2025Summary:
The U.S. Dollar Index (DXY) has corrected down to the key 38.60% Fibonacci retracement zone and is currently showing signs of a potential bullish reversal, bolstered by a clear hidden bullish divergence on the MACD. This may signal a renewed rally toward key upside targets, especially if the 93.3–99.9 support Zone holds.
Chart Context:
Current Price: 98.864
Key Fib Support: 38.60% @ 99.906, 48.60% @ 93.310, 61.80% @ 87.476
Support Zone: 93.3–99.9 USD
Hidden Bullish Divergence: Observed both in 2021 and now again in 2025 on the MACD
Trendline Support: Long-term ascending trendline holding since 2011
Fib Extension Targets (Trend-Based):
TP1: 115.000
TP2: 120.000
TP3: 126.666
Key Technical Observations:
Fibonacci Confluence: DXY is bouncing from a strong Fib cluster between 93.310 and 99.906, historically acting as a reversal zone.
Hidden Bullish Divergence: Suggests potential upside despite price weakness.
Downtrend Retest: Price may revisit 93.3–87.4 before confirming full reversal.
Breakout Pathway: Green dashed arrows outline the likely recovery trajectory toward 114–126 range.
Indicators:
MACD: Showing hidden bullish divergence and potential signal crossover.
Trendline Support: Holding intact from 2021 low.
Fib Levels: Used for retracement and trend-based extension.
Fundamental Context:
Interest Rate Outlook: If U.S. inflation remains controlled and Fed signals future hikes or sustained high rates, DXY strength may persist.
Global Liquidity & Recession Risk: If risk aversion returns, the dollar may rise as a safe haven.
Geopolitical Risks: Conflicts, trade tensions, or BRICS dedollarization efforts may create volatility.
Our Recent research suggests the Fed may maintain higher-for-longer rates due to resilient labor markets and sticky core inflation. This supports bullish USD bias unless macro shifts rapidly.
Why DXY Could Continue Strengthening:
Robust U.S. economic performance & monetary policy divergence
U.S. GDP growth (~2.7% in 2024) outpaces developed peers (~1.7%), supporting stronger USD
The Fed maintains restrictive rates (4.25–4.50%), while the ECB pivots to easing, widening the policy and yield gap .
Inflation resilience and Fed hawkishness
Labor markets remain tight, keeping inflation “sticky” and delaying expected rate cuts; market-implied cuts for 2025 have been pushed into 2026
Fed officials (e.g. Kugler) emphasize ongoing tariff-driven inflation, suggesting rates will stay elevated.
Safe-haven and yield-seeking capital flows
With global risks, capital favors USD-denominated assets for yield and stability
Why the Dollar Might Face Headwinds
Fiscal expansion & trade uncertainty
Ballooning U.S. deficits (~$3.3 trn new debt) and erratic tariff policy undermine confidence in USD
Wall Street’s consensus bearish position.
Major banks largely expect a weaker dollar through 2025–26. However, this crowded bearish sentiment poses a risk of a sharp rebound if data surprises occur
barons
Tariff policy risks
Trump's new tariffs could dampen dollar demand—yet if perceived as fiscal stimulus, they could unexpectedly buoy the USD .
Synthesis for Our Biases
A bullish DXY thesis is well-supported by:
Economic and policy divergence (U.S. growth + Fed vs. peers).
Hawkish Fed commentary and sticky inflation.
Safe-haven capital inflows.
Conversely, risks include:
Deteriorating fiscal/trade dynamics.
Potential Fed pivot once inflation shows clear decline.
A consensus that could trigger a short squeeze or reversal if overstretched.
Philosophical / Narrative View:
The dollar remains the world’s dominant reserve currency. Periodic dips often act as strategic re-accumulation phases for institutional capital—especially during global macro uncertainty. A return toward 120+ reflects this persistent demand for USD liquidity and safety.
Bias & Strategy Implication:
1. Primary Bias: Bullish, contingent on support at 93.3–99.9 holding.
2. Risk Scenario: Breakdown below 93.3 invalidates bullish thesis and targets 87.4–80 zones.
Impact on Crypto & Gold and its Correlation and Scenarios:
Historically, DXY has had an inverse correlation to both gold and crypto markets. When DXY strengthens, liquidity tends to rotate into dollar-denominated assets and away from risk-on trades like crypto and gold. When DXY weakens, it typically acts as a tailwind for both Bitcoin and gold.
Correlation Coefficients:
DXY vs. Gold: ≈ -0.85 (strong inverse correlation)
DXY vs. TOTAL (crypto market cap): ≈ -0.72 (moderate to strong inverse correlation)
Scenario 1: DXY Rallies toward 115–126 then, Expect gold to correct or stagnate, especially if yields rise. Crypto likely to pull back or remain suppressed unless specific bullish catalysts emerge (e.g., ETF flows or tech adoption).
Scenario 2: DXY ranges between 93–105 then Gold may consolidate or form bullish continuation patterns. Then Crypto may see selective strength, particularly altcoins, if BTC.D declines.
Scenario 3: DXY falls below 93 and toward 87 Then Gold likely to rally, possibly challenging all-time highs. Crypto could enter a major bull run, led by Bitcoin and followed by altcoins, fueled by increased liquidity and lower opportunity cost of holding non-USD assets.
Understanding DXY’s direction provides valuable insight for portfolio positioning in macro-sensitive assets.
Notes & Disclaimers:
This analysis reflects a technical interpretation of the DXY index and is not financial advice. Market conditions may change based on unexpected macroeconomic events, Fed policy, or geopolitical developments.
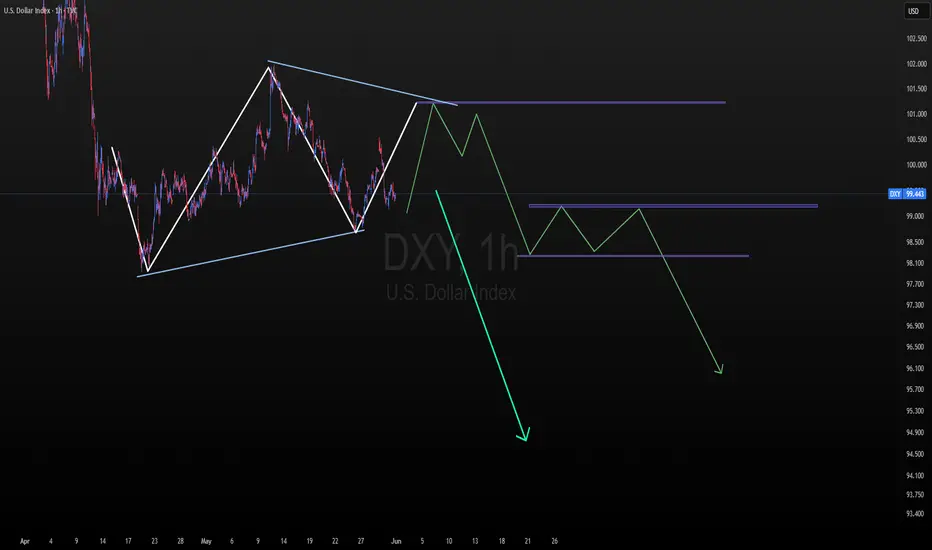
DXY 4hr chart Analaysis It is possible that the DXY may retrace back to the 101.208 level, which previously marked the beginning of a bearish move. Alternatively, it could also resume a bearish trend from its current level or around the 99.80 zone. The market at this point requires heightened caution.
A potential bearish entry could be considered if DXY breaks below the 98.66 – 98.30 support area. A clear break of this level would confirm a fully established bearish trend, with a likely continuation towards the 94.00 – 93.00 range. From there, a bullish momentum may be anticipated.
DXY Analysis - Framing TradesHere is a DXY analysis and more guidance on how to frame trades using ICT concepts, at least the way I use it.
-R2F Trading

DXY DownHaven't posted here in quite awhile, however just have been following trends watching bonds, stocks and bitcoin/gold. Looking at the DXY it appears to have fallen below the 100-101 level support and has since been rejected by that region on a weekly time frame. The support/resistance levels and trends line within have been charted for years and left unchanged. RSI is in the oversold territory but that can remain low for quite a long time, especially if the trend changes. I think the DXY goes to 90 over the next 6 months to 1 year.
Bullish for stocks, bitcoin, gold etc. Who is the fastest horse?
DXY for short *The content on this analysis is subject to change at any time without notice, and is provided for the sole purpose of assisting traders to make independent investment decisions.
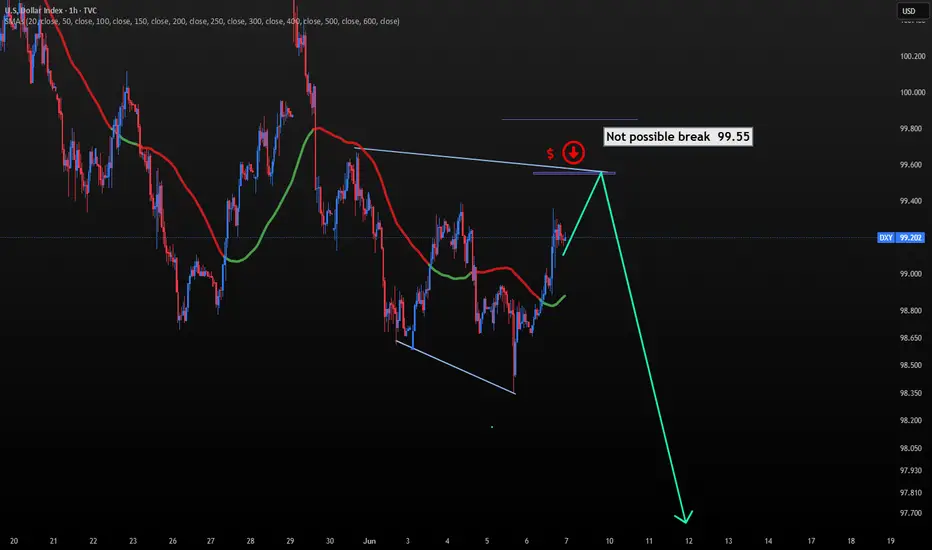
dxy 1hr chart analaysis The current bullish trend in the DXY is likely to face a strong rejection around the 99.55–99.65 zone. Unless there is major news that significantly shifts the market direction — such as a surprise policy announcement like the tariffs introduced during Trump's era — the dollar index is not expected to break above that level. That zone could act as a major turning point, and a bearish reversal is likely to emerge from there
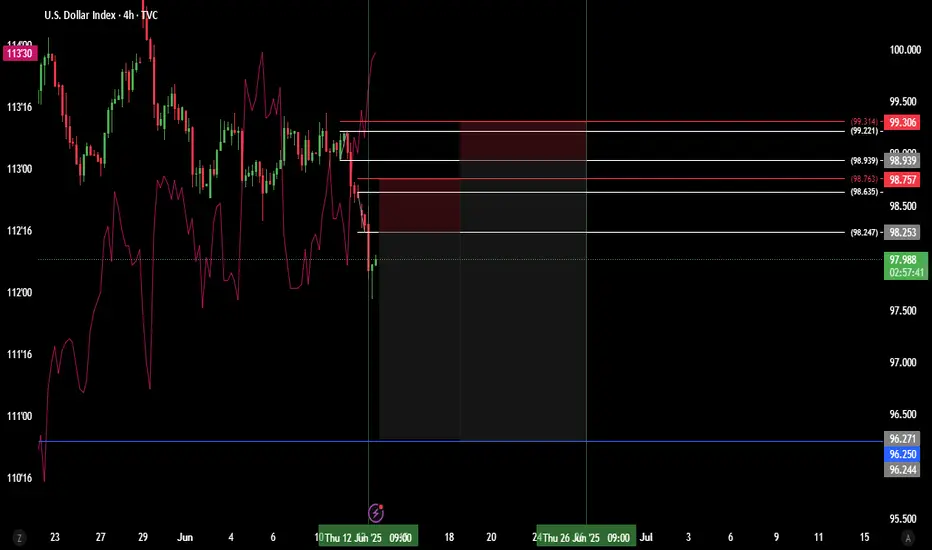
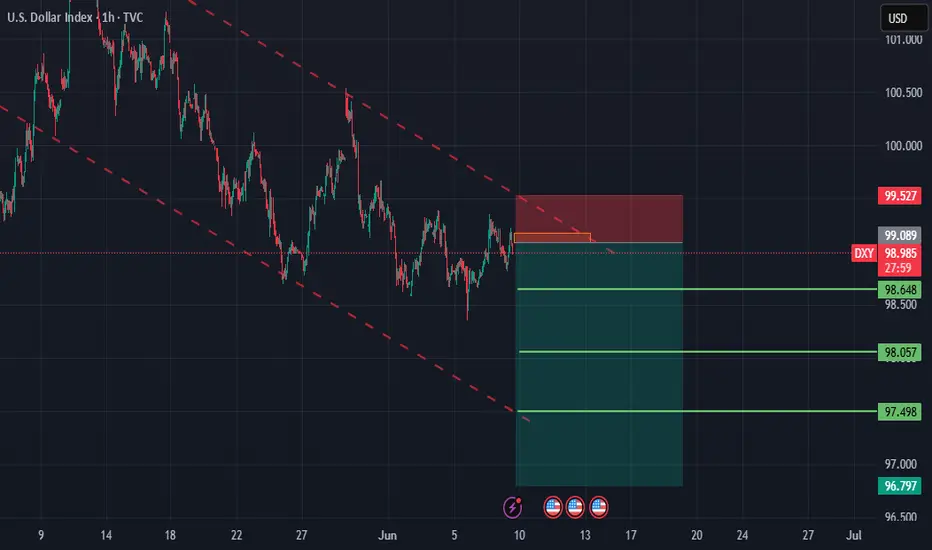
Dollar Index Eyes FVG Breakout Ahead of CPIDXY 11/06 – Dollar Index Eyes FVG Breakout Ahead of CPI | Reversal Risk After 100.31?
The US Dollar Index (DXY) continues to consolidate within a rising channel on the H2 timeframe, with price tightening just ahead of a key macro event — the US CPI report. DXY is now approaching a critical Fair Value Gap (FVG) zone, where liquidity hunts and potential reversals become highly probable.
🌐 MACRO OUTLOOK & MARKET SENTIMENT
📌 US CPI (June 12):
The main macro driver for DXY this week.
A hotter-than-expected print → strengthens the Fed’s hawkish stance → DXY likely to spike.
A weaker-than-expected CPI → boosts rate cut expectations → downside pressure on DXY.
📌 Risk Sentiment:
Institutions are readjusting their exposure ahead of CPI and FOMC. This has caused DXY to hover near EMA89 — a sign of indecision.
📌 Cross-asset Flows (Bonds & Gold):
Treasury yields are stable, but surprises in CPI could lead to capital rotation between gold and USD, increasing volatility in XAUUSD and DXY simultaneously.
📈 TECHNICAL ANALYSIS
Trend Structure:
DXY is following a clean ascending channel on H2, with higher lows respecting the lower trendline.
EMA Confluence (13–34–89–200)
Price is consolidating near EMA89 and below EMA200 (99.40), forming a neutral short-term bias.
A clean breakout above EMA200 could trigger acceleration into the FVG zone.
Key FVG Zone (H2):
99.63 – 100.31 is an unfilled Fair Value Gap.
This zone may act as a magnet for price before any meaningful rejection or breakout.
Potential Reversal Area:
A rejection at 100.31 could trigger a sharp pullback toward the liquidity zone around 98.68.
🧠 STRATEGIC OUTLOOK
CPI will set the tone for DXY’s mid-term trend.
Watch the 99.63 – 100.31 FVG zone for liquidity sweeps and potential rejection.
Wait for confirmation, not prediction — especially in macro-sensitive environments.

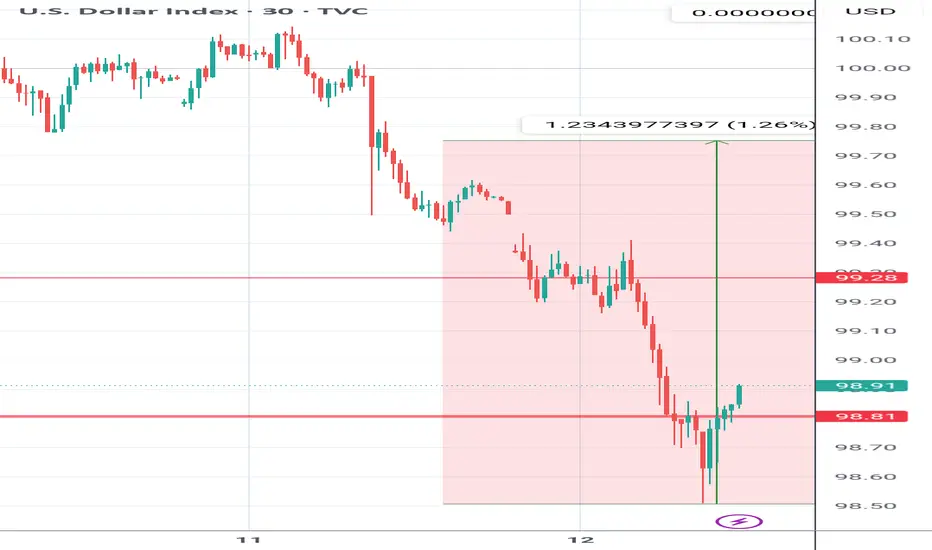
Is the dollar's a trend or temporary?📊Technical Analysis for:
🕒 Timeframe:
📈 General Trend:
🔍 Analysis Summary:
We are currently observing a rebound from the 98.400 level.
• Major Support Level:
• Resistance Level:
• Technical Indicators: We note that this correction is due to divergence.
🎯 Suggested Entry and Exit Points:
✅ Entry: Upon a breakout/rebound from
⛔ Stop Loss:
🎯 Targets:
• First Target:
• Second Target:
📌 Recommendation:
– It is recommended to wait for confirmation of the technical signal before making a decision.
🛑 Disclaimer:
This analysis is not considered financial advice or a direct buy or sell recommendation. Do your own research and carefully consider risk management before making any decisions.
📥 Do you agree with this analysis? Share your opinion in the comments!
🔁 Follow me for daily analysis. ICEUS:DX1! ICEUS:DX1!
