#INJ: The Perfect Setup for a Strong Bullish Breakout I have a keen eye for identifying patterns that signal lucrative opportunities, and #INJUSDT on Binance is presenting an enticing setup. The descending wedge pattern, visible in the chart, is a classic bullish reversal signal. Here's why I believe this is a trade with great potential:
1. Descending Wedge Pattern: The descending wedge is a bullish pattern that typically signals a reversal. After a prolonged downtrend, INJ is poised to break out upwards, as indicated by the narrowing of the wedge.
2. Volume Confirmation: Notice the increase in volume as the price approaches the apex of the wedge. This surge in volume often precedes a breakout, adding credibility to the bullish scenario.
3. Strong Support Level: The lower boundary of the wedge has acted as a strong support, preventing further declines and indicating that buyers are stepping in.
4. Positive Momentum Indicators: The RSI and MACD indicators are showing bullish divergence, further supporting the likelihood of an upward move.
In conclusion, the technical indicators and pattern formations on INJ/US Dollar are aligning perfectly for a breakout. This trade setup offers an excellent risk-reward ratio, making it a high-probability opportunity. Always remember to set your stop-loss levels and manage your risk appropriately.
⚠️All trade ideas are published with a time delay. If you want to follow the trade in real time, please follow the link to our open copy trading account on Binance.
👉Our account with open trading, and all our other resources at this link:
INJUSD trade ideas

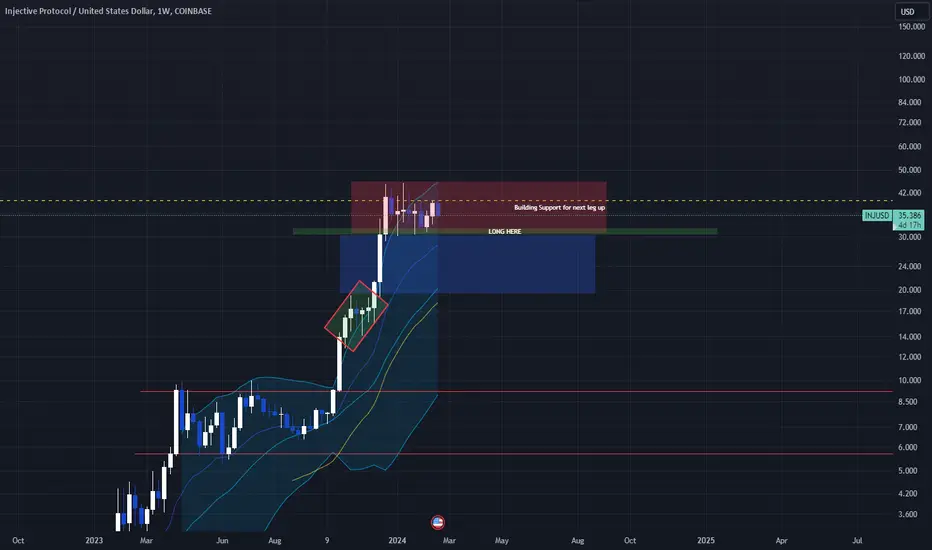
Swing Long...Like many charts they look too good to pass on - yes we can always go lower but It won't matter in 6-12months - this is already established as an early winner in this cycle so it makes sense to own it.
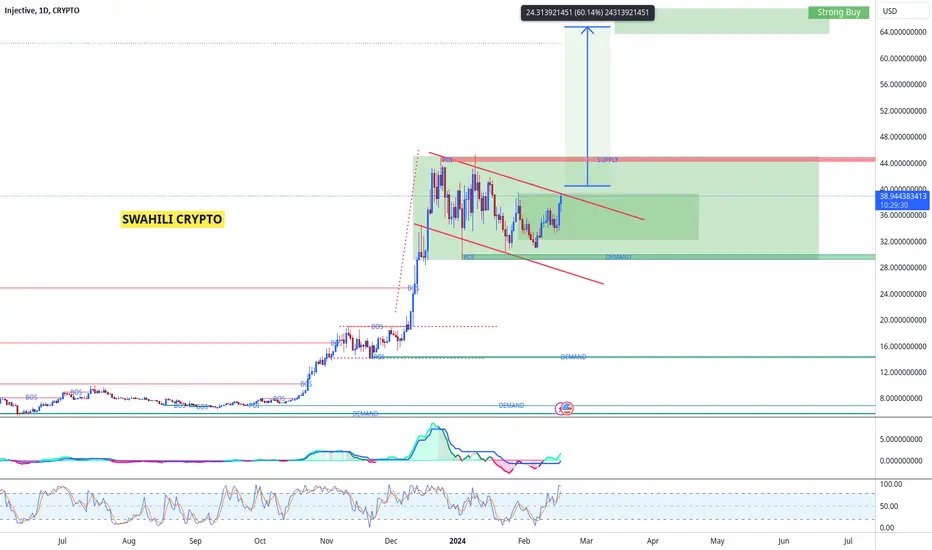
Injective, Refuses to Stay Above $30- $30 is a key level, acted as support, broke below, resisted and tested again this week.
- The retracement distance in the EQ channel is measured and placed to the top.
- Prices has broken below the green box giving indication that down trend continues. Price has also broke below the EQ channel.
- This is further exacerbated by price breaking below the week washline indicating that all gains are washed out from the week's token burn.
- Should price finds support at 23.73 level, then there's a possibility of a right shoulder forming.
- A week close below 23.73 level would also washed away all the gains.
- Near term support as shown.
- The author has skin in the game.

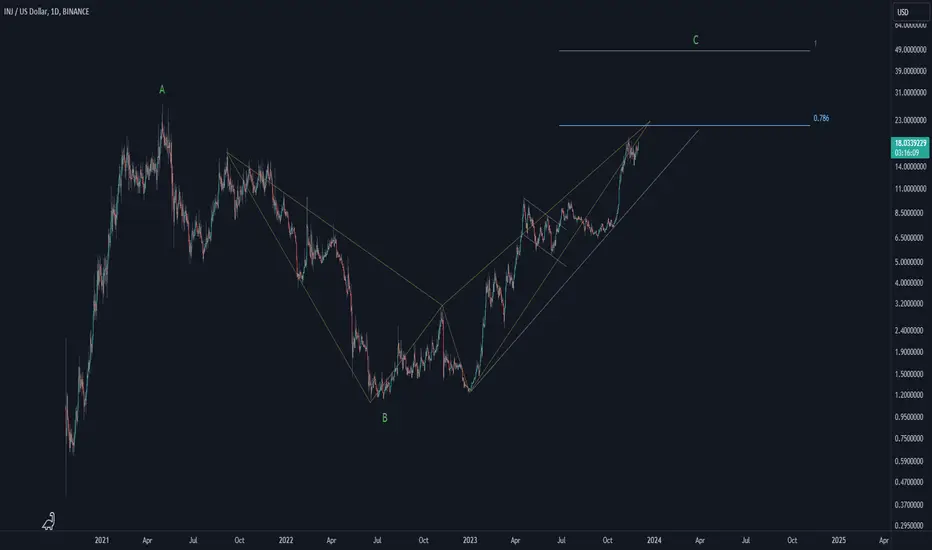
Injective (INJ)Injective is one of the famous pioneers of layer-one blockchain for finance, in which user can build and use the Web3 applications. Anyway, Injective also was the first (or one of the first) altcoin which started the next upward/impulse wave sooner than others; and it seems INJ is making an inverted harmonic pattern. If this harmonic pattern takes place, major correction can be anticipated. Although, there is another scenario, that is, a three waves pattern of A-B-C unfold. If this happens, INJ can continue its rise to the Fib level 1; about $50 price level. Or even a mixture of these two scenarios might happen. Let's see which scenario happen.
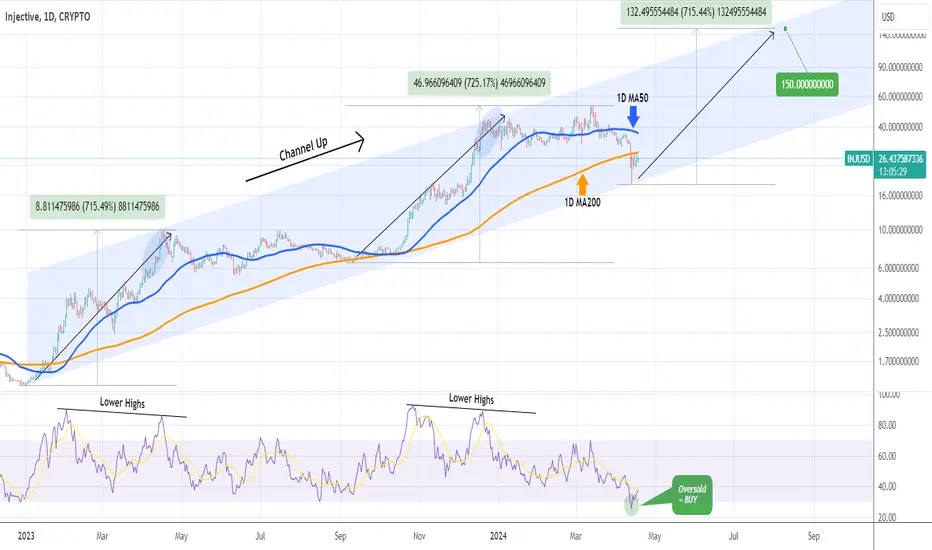
INJUSD Bottom of the Channel Up. BUY.Last time we looked at Injective (INJUSD) was 4 months ago (December 18 2023, see chart below) and gave us an excellent sell signal that hit the 30.000 Target:
The price now sits at the bottom of the Channel Up and this is the most optimal buy entry for the long-term. We expect another +715% rise, targeting 150.00.
-------------------------------------------------------------------------------
** Please LIKE 👍, FOLLOW ✅, SHARE 🙌 and COMMENT ✍ if you enjoy this idea! Also share your ideas and charts in the comments section below! This is best way to keep it relevant, support us, keep the content here free and allow the idea to reach as many people as possible. **
-------------------------------------------------------------------------------
💸💸💸💸💸💸
👇 👇 👇 👇 👇 👇
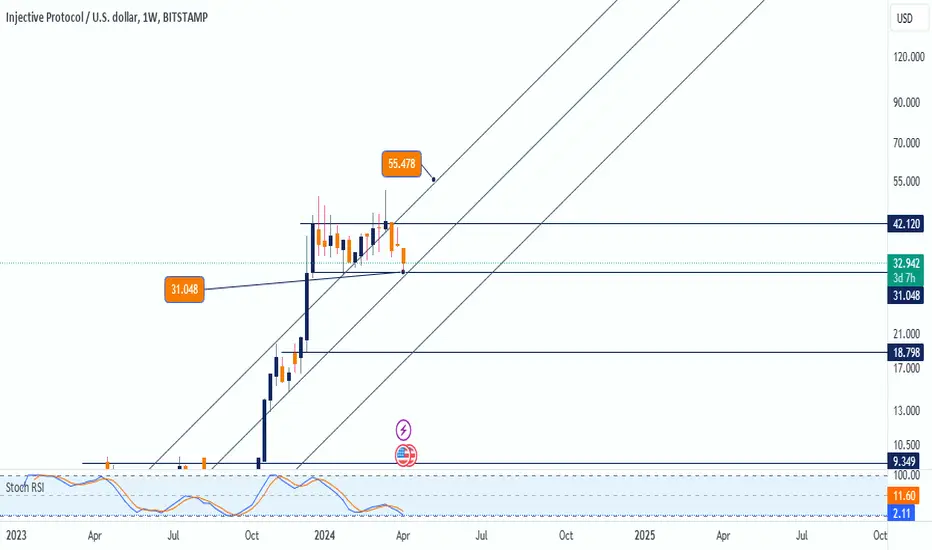
Injective (INJ) Takeoff as Whales Accumulate, Price Eyes $55Currently hovering around $31.00, which I consider a strong support level, INJ is well-positioned for a breakout. I believe the token has the momentum to reach $55 and even surpass that mark, fueled by the recent whale activity.
Strong Support Level: The current price of $31.00 is seen as a crucial support level. If INJ can hold firm at this point, it could signal a bullish reversal and pave the way for further gains.
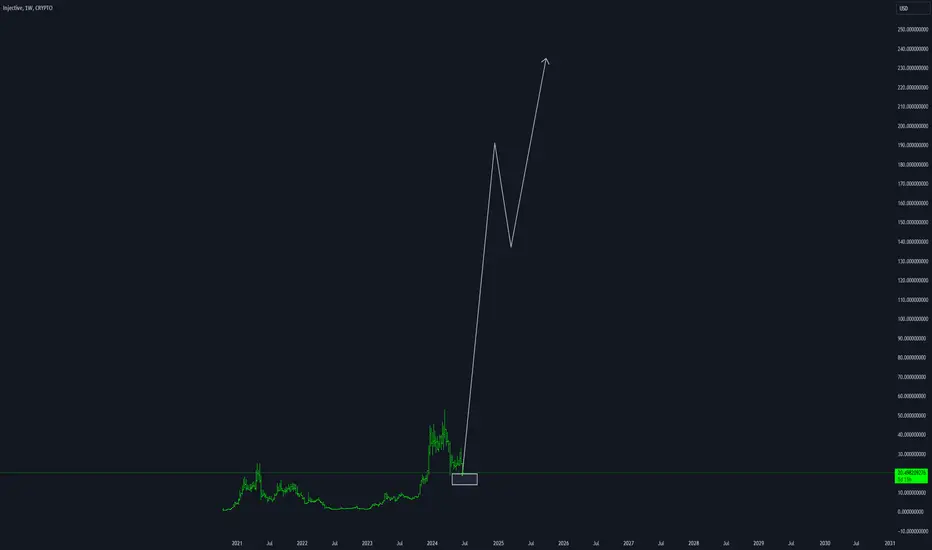
Log Plot...This is based on waves and targets are derived off fibs - this is how I potentially see us ending this year as the bull case.

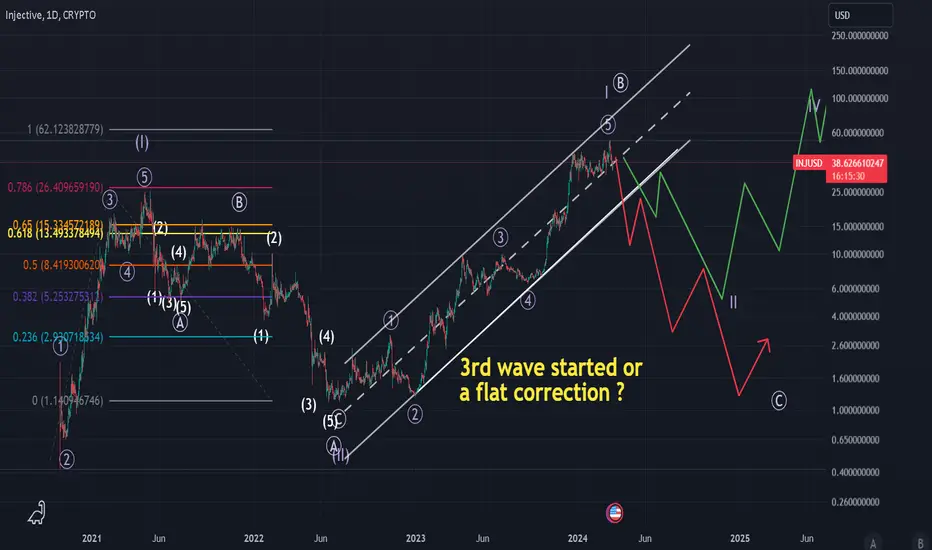
INJ Bull Run Started or Not ?In my point of view INJ has two scenarios at the current market price. That is it can be the 3rd wave or the flat correction of 2nd wave. More likely to be a 3rd wave let's see
INJUSD - Could it Top Here For a Bit?Drawing a channel between peaks and lows
I expect a downward move toward the dotted green line
from here however I think the bulls might just take back control.
A downward move makes sense with a structure like this.


$INJUSDT Breakout and Retest Successfully done!!!The purpose of this setup is to provide an analysis that suggests if the current market conditions are bullish or bearish, potential entry and exit points, and to identify key levels of support and resistance that might influence future price movements. It is important for the community to know that such technical analysis is based on historical data and patterns, and it does not guarantee future price movements. All investments and trades come with risk, and one should only trade with money they can afford to lose.
Now we move to the analysis. What are my considered parameters for this trade?
Price Action: The setup shows the priceaction of Injective in a Daily TF. There has been a recent uptrend as indicated by the price being above the 50 EMA line, which is the green curved line on the chart.
Fibonacci Retracement Levels: The chart shows a clear bounce off the 0.618 level from the recent dump, which could be seen as a potential support level and which confirms as well the Fibonacci setup that we have for this Trade.
Bullish Pennant Pattern: The purple lines show an ascending trendline as support trendline and a descending trendline as a resistance trendline. These two formed a perfect Bullish Pennant Pattern, from where the price broke and retested recently with the recent dump that we had in the market.
All these points speak for a long trade here taking no more than a 200% TPR to reduce risk and not be greedy as well.
I will keep posting follow ups and updates on this trade. Good Luck

INJ PULLED the trigger!!This is what I wanted to see!
Sweep the longs and now to target the shorts!!!
I think we could see a run up like we had seen with File coin over the recent days now.
I have sell orders going up as high as $70 but $65 might be too high.
NOT FINANCIAL ADVICE!!!

INJ is about to light up!I believe that we are about to see some positive moves!
I have been waiting since I missed the last entry.
We might breakout of the range on this move!
Can we hit $60??? I think high 50s are a real possibility.
NOT FINANCIAL ADVICE!!!

INJ .. Looking impressive.If this chart plays out.. WOW.
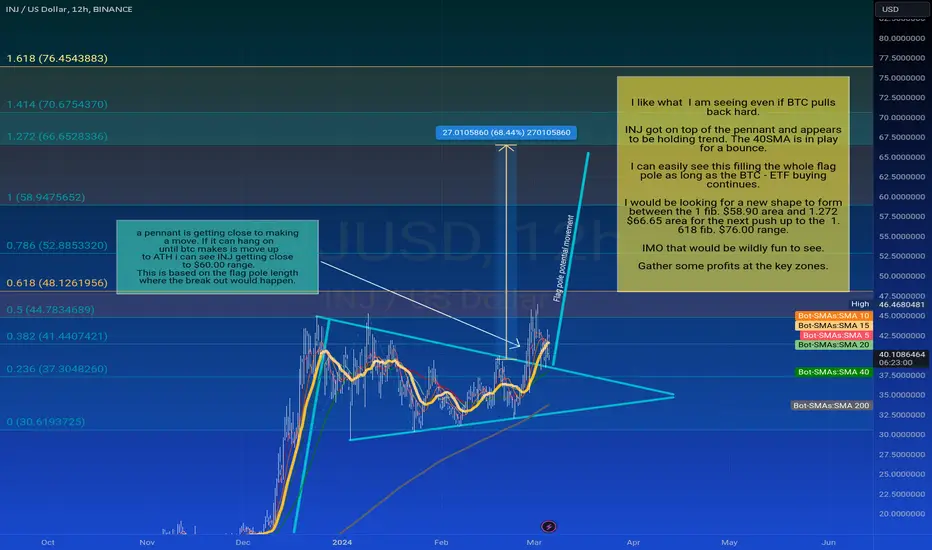
I like what I am seeing even if BTC pulls back hard.
INJ got on top of the pennant and appears to be holding trend. The 40SMA is in play for a bounce.
I can easily see this filling the whole flag pole as long as the BTC - ETF buying continues.
I would be looking for a new shape to form between the 1 fib. $58.90 area and 1.272 $66.65 area for the next push up to the 1.618 fib. $76.00 range.
IMO that would be wildly fun to see.
Gather some profits at the key zones.
INJ.. Still on trackNot much has changed with this chart.
We are working the pennants' range currently and watching that 200 sma.
BTC will decide the fate of the direction.
If the break out happens to the up side. Wow!, it looks really good.
Keep the stops active and protect them profits.
I cleaned up the chart some to help see the action better.
still looking good in the long run?If timing were to get any better than right now than the timing is now. Possible breakout to the upside long entry with enough volume to support current price and push past resistance before it rises even further.
Looking good for some of the following especially if btc and eth continues to hold its current value.

Possible Trend Reversal in INJ/USD? Double Bottom Formation MeetINJ/USD Technical Analysis:
Double bottom pattern potentially signals a trend reversal on the daily chart.
The pattern's validity and potential impact require further observation.
POC may act as potential resistance if the price attempts to break upwards.

BUY Injective here @ $38.8 for a 40% + Gain - Long $INJ toThis is a play all too familiar.
while other alts have run and made new all time highs over the last few months, one of our early, strong performers in the crypto market has become boring, while building a strong base fro 67 days.
Injective is finally starting to turn up and reach the $40 dollar range for a third time after breaking down from it's previous all time high. I thoroughly expect this crypto to reach new all time highs!
it's also crossing over it's 10/20 day EMAs. Volume looks stronger and will likely continue to climb. I can do nothing but buy the coin.
Entry $38.8
Target 1: Previous All time High.
Target 2: $56.00
Target 3: $60.5
This base looks really strong. So unless we expereince strong underlying market bearishness, ALL DIPS ARE FOR BUYING MFers!

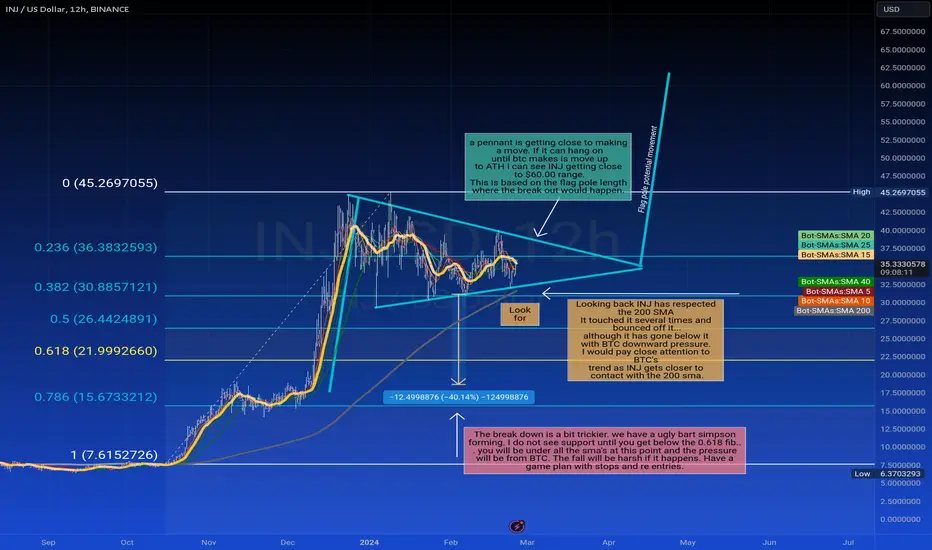
INJ... Interesting case.Lots going on with INJ.
You have a Pennant that is about to make a deciscion .
a. if it breaks out on its own it could get to the $60.00 range. based on the break out area and the flag pole length.
b. if it breaks down and under the 200 sma you will have a very ugly bart simpson pattern. that could be a 40% drop down below the 0.618 fib to previous support and break out.
So i think the best scenario would be INJ makes contact with the 200 sma and respects it.. pushes up some goes side ways for a few days and then breaks out before BTC moves down. * i believe BTC is due for a correction of about 9 to 14%.
if my BTC projections are off then INJ has a really good chance to move up to the $60.00 range.
Good luck and play with protection.

Injective Protocol, INJPretty simple. Support being built by both upward accumulation and ranging after sweep.
Advanced Multi Indicator Strategy - Buy signal on INJI am testing a new script which overlaps many data.
Short and Long-Term EMAs: For trend identification.
RSI: To gauge market momentum.
MACD (Moving Average Convergence Divergence): For both trend following and momentum, with the histogram providing visual cues on momentum shifts.
Volatility Calculation: Helps in understanding market stability or turbulence, potentially indicating periods of higher risk or opportunity.
This indicator shows the same pattern INJ repeated and I expect in the next 19 days a 133% price increase, up to $73.

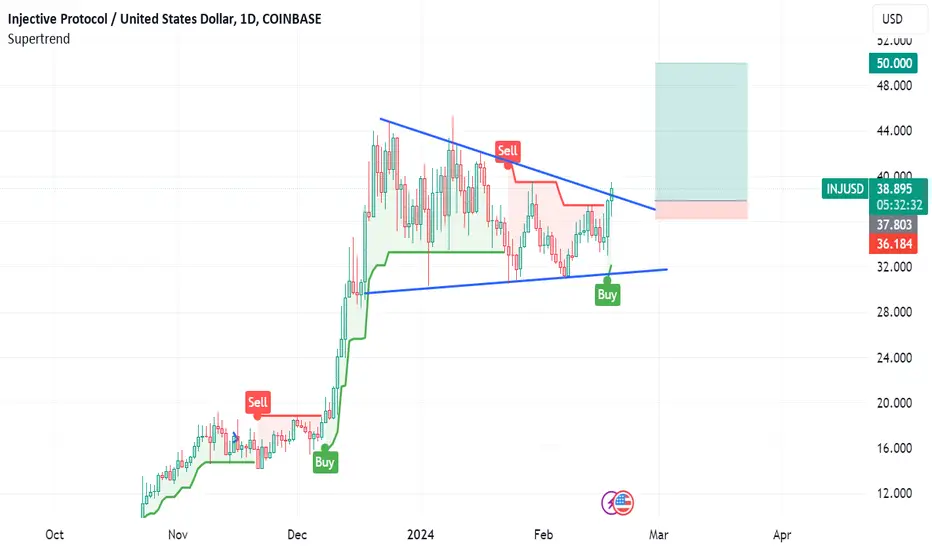
1D Inj/USD BUllFlag Breakout.Inj/Usd has been ranging for the past 61 days in a bullflag and is gearing up for new alltime highs. My target is a solid $50 dollar because of a strong psychological level. We need to break the trend line and retest trendline to confirm breakout. Supertrend also turned to a buy signal on the 1 day chart. I think once we break the $40 dollar level, 50 dollars is in play. Please use proper risk management and not financial advice.
Please leave a comment about other opinions!
INJ ABOUT TO BREAK BULL FLAG We are in consolidation area of Bull Flag and if we break from here we expect 60% + move up, we have supply zone in front us may slow up the move.