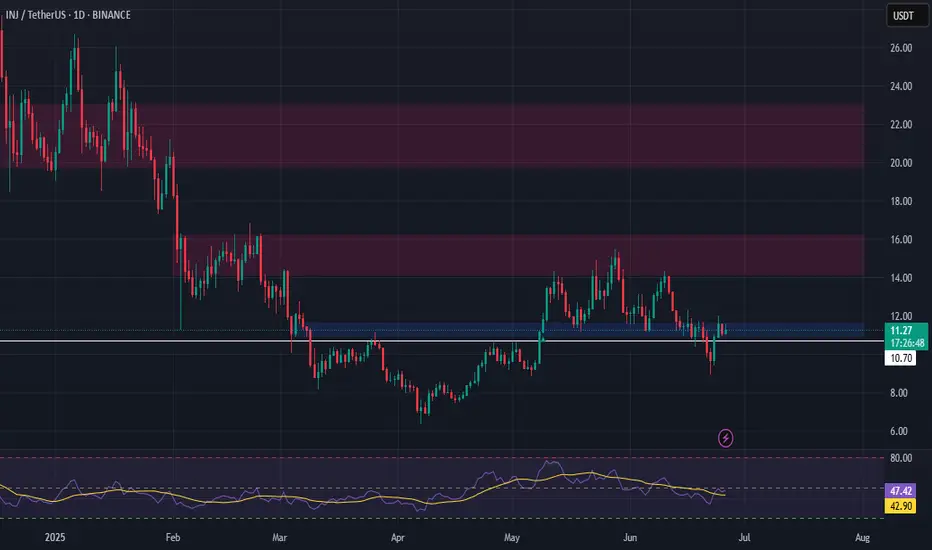
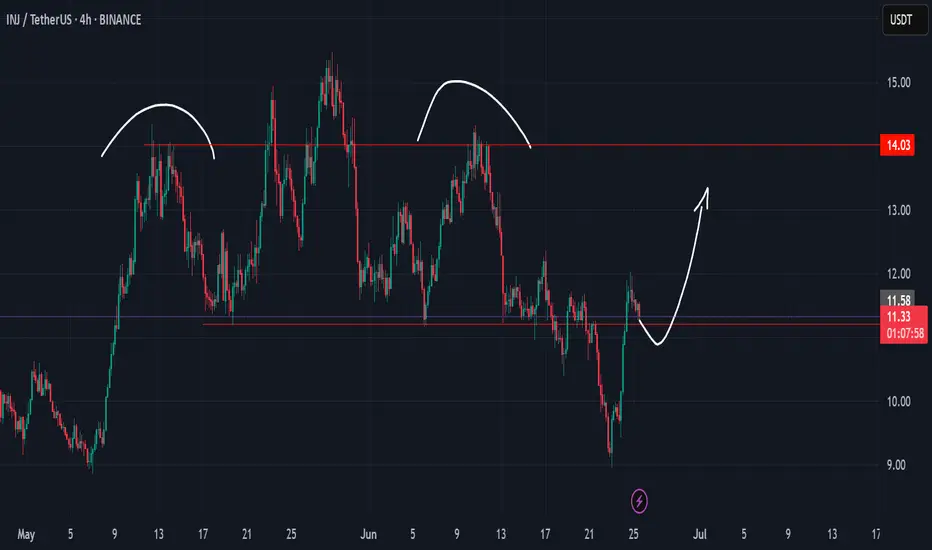
INJ Long Swing Setup – Breakout Retest Opportunity at Key LevelIf the crypto market pushes higher and INJ flips current resistance into support, we’ll be looking to enter on a retest of the $11.60 zone. This level could act as a launchpad for the next leg up.
📌 Trade Setup:
• Entry Zone: $11.60 – $11.60 (Breakout Retest)
• Take Profit Targets:
o 🥇 $14.20 – $1
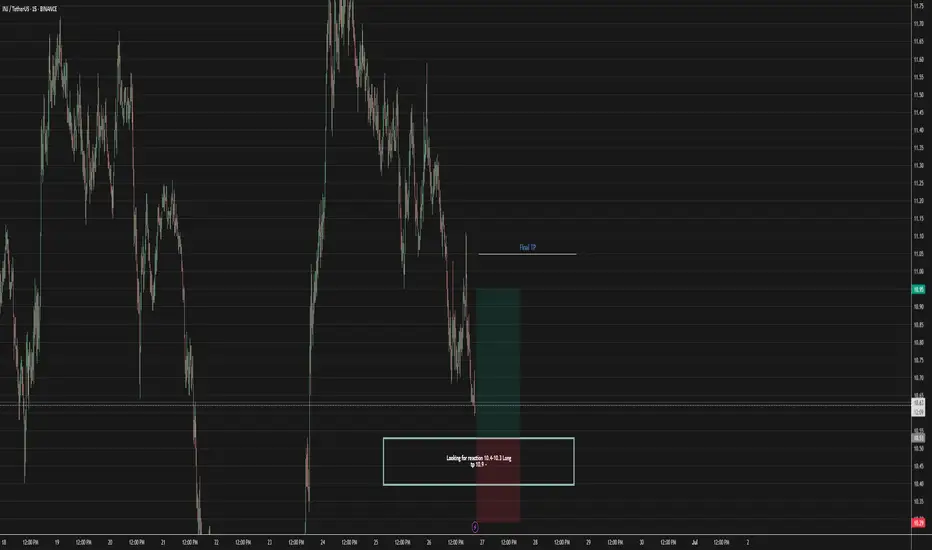
Long Inj 10.4-10.5 longWatch reaction 10.4-10.5 long
Entry: 10.4-10.5
TP1: $10.90–11.00
TP2: $11.20 (moderate)
TP3: $11.50–11.55 (ambitious if volume confirms)
SL: $10.50 (tight) or $10.40 (conservative)
Keep an eye on volume and broader crypto market movements—strength in Bitcoin or Ethereum can give your long mor
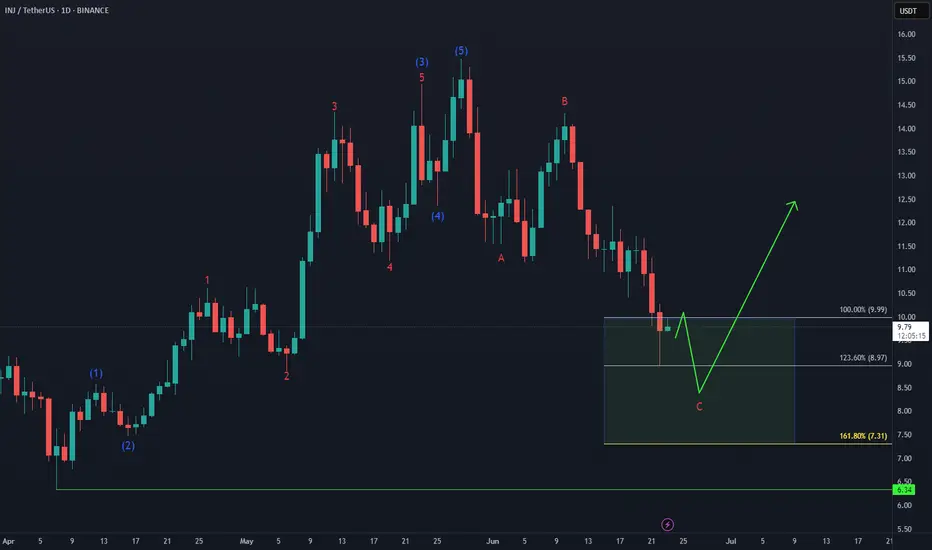
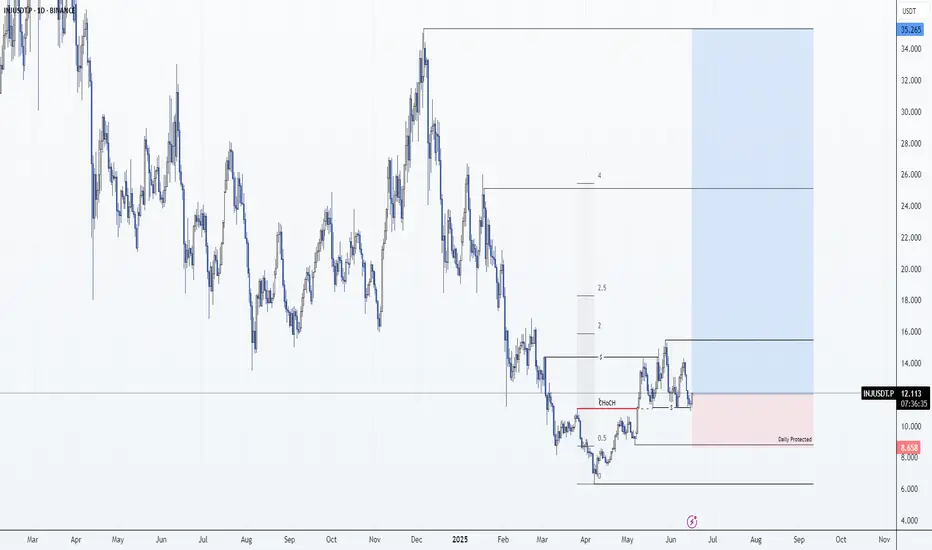
Injective Enters the Daily Bouncing AreaCRYPTO:INJUSD has tapped into the equal legs zone at $9.99–$8.97, a key Fibonacci-based support area where buyers may begin to step in. This zone often acts as a magnet for a reaction higher, especially if the broader structure supports a bullish reversal.
In the coming weeks, watch for confirmat
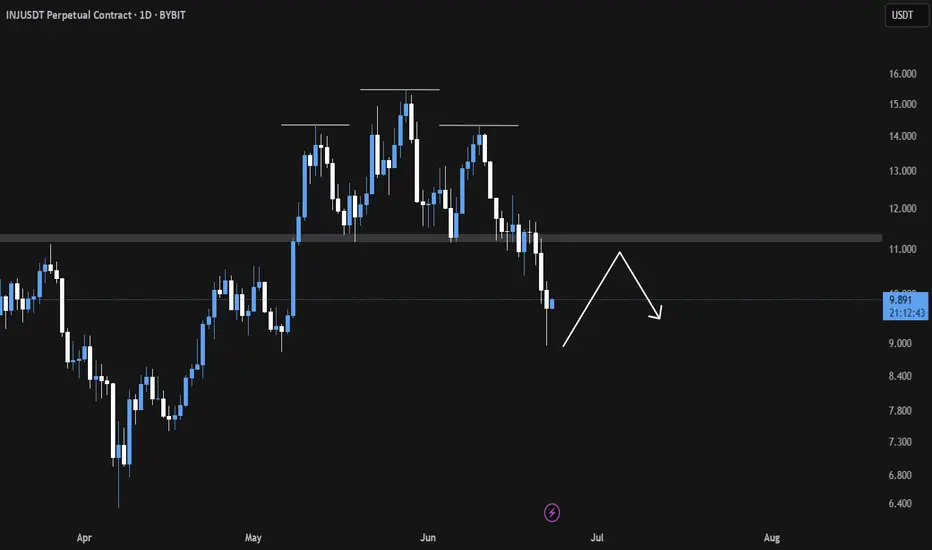
INJ Breakdown in Play Eyeing the Neckline for Precision ShortsINJ/USDT Analysis
〽️ The Head and Shoulders pattern has broken down successfully, confirming a bearish structure.
💠We anticipate a potential relief bounce towards the $11 region which aligns closely with the neckline retest zone. This area is likely to act as a liquidity trap, where institutional

Injective (INJ): Important Neckline ZoneINJ is at a crucial area where we are testing the local neckline area, which will give us the next major movement on the coin.
Now we are divided in two ways here. Once we see a breakdown, we will aim for a lower target area, but if we see a proper bounce from here, we will be aiming for the upper

INJ: Spot TradeTrade Direction:
Injective Spot Long
Risk Management:
- Spot Position 1% total spot portfolio.
- SL will be executed only when a daily / 3day close below that level.
Reason for Entry:
- 50% retracement off daily leg completed
- EQLs swept and reclaimed
- Daily CHoCH/MSB with retrace
- Injective ov
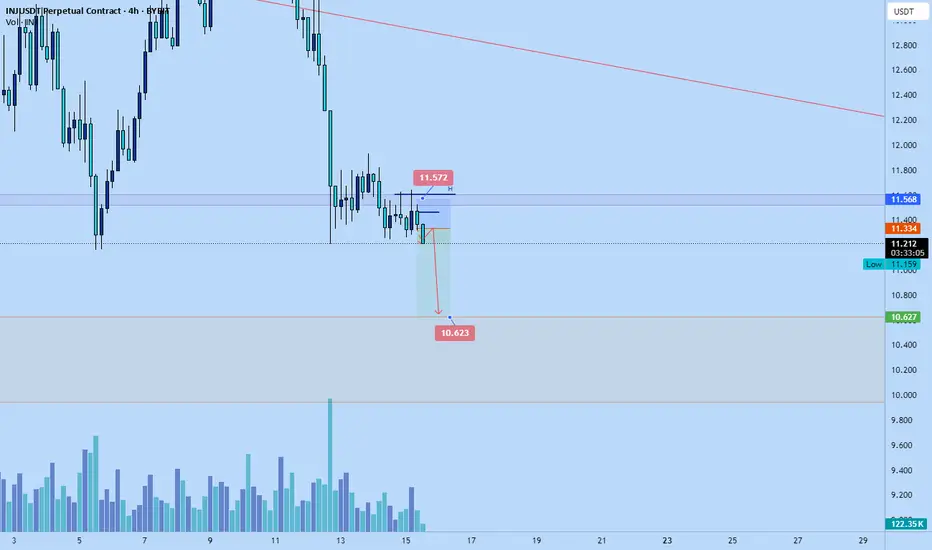
INJ short to $11.572Recently opened a short position on INJ. Might not be too late for anyone wanting to hop on. Still can get like 2RR+ from the move.
Time sensitive
market aiming for prior weekly resistance to potentially use as a new HL structure.
BTC Technical Analysis for Beginners | Bitcoin Trading Are you new to crypto trading? In this beginner-friendly video, BTCguruonline breaks down the basics of Bitcoin (BTC) technical analysis—from understanding charts to using indicators like RSI, MACD, support & resistance, and more.
What You’ll Learn:
What is Technical Analysis?
Entry & exit strat

See all ideas
Summarizing what the indicators are suggesting.
Oscillators
Neutral
SellBuy
Strong sellStrong buy
Strong sellSellNeutralBuyStrong buy
Oscillators
Neutral
SellBuy
Strong sellStrong buy
Strong sellSellNeutralBuyStrong buy
Summary
Neutral
SellBuy
Strong sellStrong buy
Strong sellSellNeutralBuyStrong buy
Summary
Neutral
SellBuy
Strong sellStrong buy
Strong sellSellNeutralBuyStrong buy
Summary
Neutral
SellBuy
Strong sellStrong buy
Strong sellSellNeutralBuyStrong buy
Moving Averages
Neutral
SellBuy
Strong sellStrong buy
Strong sellSellNeutralBuyStrong buy
Moving Averages
Neutral
SellBuy
Strong sellStrong buy
Strong sellSellNeutralBuyStrong buy
Displays a symbol's price movements over previous years to identify recurring trends.