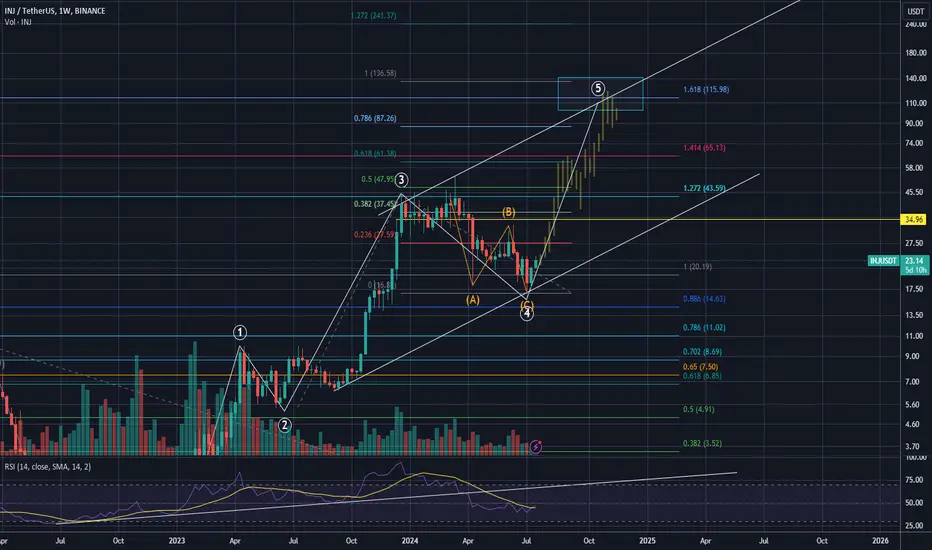
INJUSDT.1DUpon examining the INJ/USDT daily chart, it becomes apparent that the asset has navigated through varied price ranges, characterized by both surges and declines. Here's a breakdown of the critical elements in my analysis, focusing on the support and resistance levels, along with key technical indicators.
Support and Resistance Levels:
Support Level 1 (S1) at $14.30, a significant level because it previously acted as both support and resistance, suggesting a strong market reaction if approached again.
Resistance Level 1 (R1) at $24.54, where previous attempts to break higher were thwarted, indicating a robust selling area.
Resistance Level 2 (R2) at $30.84, marking the high end of the recent price range and a target for any bullish momentum resurgence.
Technical Indicators:
The MACD (Moving Average Convergence Divergence) is under the zero line and the signal line, indicating bearish momentum. This suggests that there could be more downward pressure in the near term.
The RSI (Relative Strength Index) is hovering near the mid-range, around 50. This indicates a relatively balanced market but leans slightly towards bearish conditions given the current price trend below recent highs.
Conclusion:
From my perspective, the INJ/USDT pair currently exhibits bearish tendencies with the price testing support levels. The critical area to watch is the support at $14.30; a break below this could lead to further declines towards new lows, while a hold could prompt a retest of the upper resistance levels. Given the negative MACD, traders should be wary of potential declines, but also prepared for a bounce if the RSI moves into oversold territory, signaling a possible reversal. This analysis suggests that monitoring these levels for breakouts or bounces, along with broader market sentiment and news affecting INJ, will be crucial for making informed trading decisions. As always, it's recommended to employ stop losses and manage risks appropriately in such volatile environments.
INJUSDT.P trade ideas
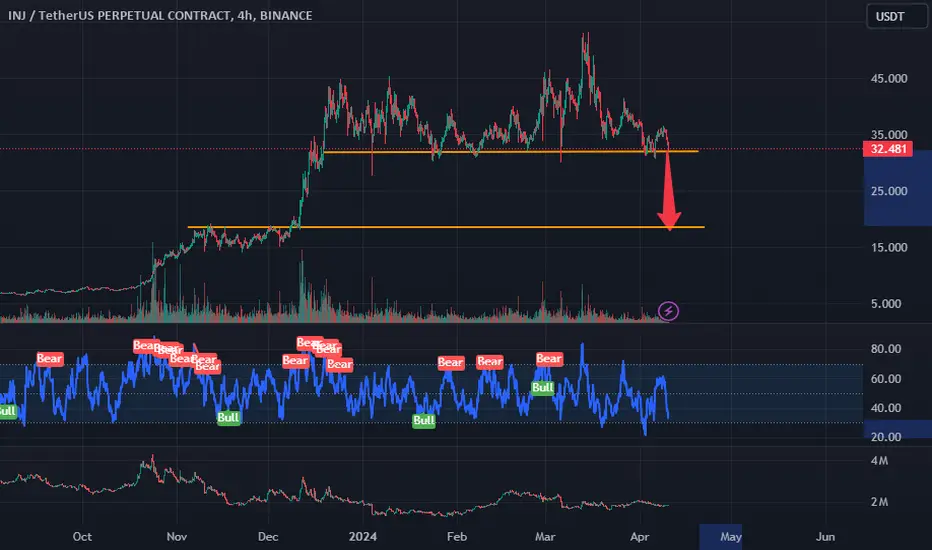
Alikze »» INJ | Descending channel🔍 Technical analysis: Descending channel
- It is moving in a descending channel in the daily and 12H time frames.
- It has faced a complex zigzag correction structure after the end of the last bullish wave that extended around the 2.618 area and the price of $53.
- Currently, according to the downward momentum, it is approaching the OB region in the form of a three-wave pattern.
- So if the $18.75 range maintains the 1.618 Fibo, it can have an attempt to the $25 range.
In addition, in the continuation of it, if it faces selling pressure again, the last log can continue up to the range of the green box and Fibo 100.
💎 Alternative scenario: But if it faces selling pressure in the range of $25 and breaks it, the downward trend will continue in the range of the green box and continue with its failure until the range of 11.36.
»»»«««»»»«««»»»«««
Please support this idea with a LIKE and COMMENT if you find it useful and Click "Follow" on our profile if you'd like these trade ideas delivered straight to your email in the future.
Thanks for your continued support.
Best Regards,❤️
Alikze.
»»»«««»»»«««»»»«««
BINANCE:INJUSDT

$INJ: Injective why I think that it is the best alt to hodl?CRYPTOCAP:INJ or Injective is my best bet for the end of the bull market. I believe it will exceed expectations and surprise all the meme coin enthusiasts. Here’s why:
**Facts:**
- Launched in November 2020, the team continues to innovate and push the project forward, more than any other L1 competitor like $AVAX.
- The mainnet is stable and has never crashed or experienced downtime, unlike CRYPTOCAP:SOL which has faced multiple issues.
- With a total supply of 100,000,000 tokens, 95% of which are already unlocked, there are no more VC unlocks, making it a safe investment. Compared to competitors who still have 20% or more in treasury and can unlock anytime, CRYPTOCAP:INJ is poised for growth.
- It has a vast ecosystem, recently integrating with ONDO to support RWA tokenization. It includes everything from memes to NFTs to staking, making it a fully functional L1 blockchain.
- It has a real community. Check their Telegram group; there are many genuine people asking questions and no mindless chatter.
- Recently, it launched an exchange with 21Share to offer ETFs (yes!).
- Last week launched AINJ stacking ETP
etc...
**So why does this coin only have a $2 billion market cap? What’s the problem?**
Remember when Solana was at $5, with a market cap of roughly $4 billion? That’s where CRYPTOCAP:INJ is right now. The project is overshadowed by Solana and Ethereum.
For me, buying CRYPTOCAP:INJ now is like buying CRYPTOCAP:SOL at $5 a coin. It's early, and the price is fluctuating as it seeks direction. But when you read the news, you know this project is going to lead. When you see the token supply, you know nothing can stop it once it takes off. It's just a matter of time.
**Market rewards patience.** Buying CRYPTOCAP:INJ at a $2 billion market cap is a sure x10 within a year. Try to find an equivalent. Don’t believe the moon boys hyping meme coins; these won't perform well in the long run. They pump and dump but quickly fade due to competition. As soon as they reach a Binance listing, they become practically stagnant, dumping as much as they pump.
**The difference between solid projects and others is that projects like CRYPTOCAP:INJ get bigger and bigger, and you can hold them for many years, continually making more money. Other projects have nice pumps, followed by nice dumps, and there’s no reason to hold them long-term.**
After studying the project, its social presence, potential, and technology, I forecast that CRYPTOCAP:INJ will be one of the biggest gainers of this bull run. By 2025, its value will exceed $100 and potentially reach $250 or more.
The real pump for CRYPTOCAP:INJ will begin once it surpasses the $30 resistance. Then CRYPTOCAP:INJ will start to attract institutional investors, possibly launch ETFs, and the masses will FOMO into it.
This is my personal opinion, not financial advice. DYOR as always.

Injective #inj #LongInj is making higher high & lower lows & breaks structure which is a good signal to go long
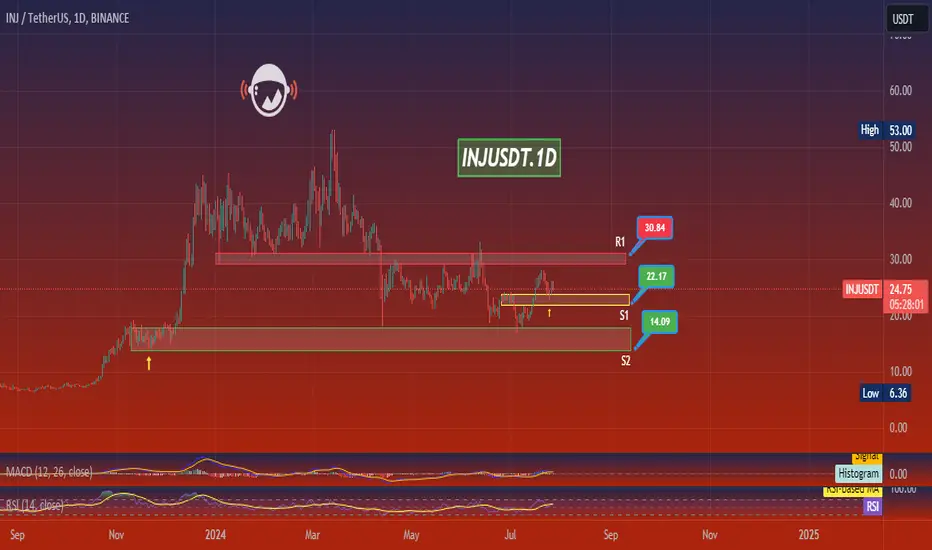
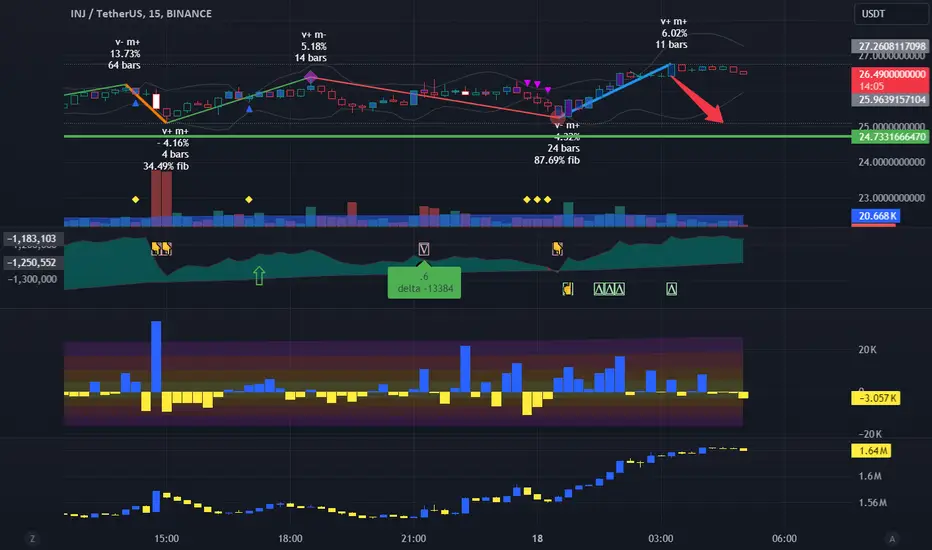
INJUSDT.1DLooking at the INJ/USDT daily chart, there are several important features and indicators to consider for a comprehensive technical analysis:
Current Market Position:
The INJ/USDT pair is trading at $24.74, down approximately 4% for the day. The price action over the past few months shows a series of peaks and troughs, suggesting significant volatility.
Support and Resistance Levels:
S1 (Support 1): The first support level at $22.17 is crucial. This level was previously resistance in early 2024 and has flipped to support. The price has tested this level several times, and it seems to be holding up as a strong base.
S2 (Support 2): The second support level at $14.09 is much lower and was last tested in November 2023. This is a significant drop from the current price and would indicate a severe downturn if reached again.
R1 (Resistance 1): The nearest resistance at $30.84 is a recent high. Overcoming this level could signify a shift in market sentiment and potential for higher highs.
Technical Indicators:
MACD (Moving Average Convergence Divergence): The MACD line is below the signal line, indicating bearish momentum. The histogram also reflects this as it is below zero, suggesting the bearish trend might continue unless there's a crossover above the signal line.
RSI (Relative Strength Index): The RSI is at 57.98, indicating neither overbought nor oversold conditions. It suggests that there is room for the price to move in either direction without immediate pressure from RSI extremes.
Analysis of Price Action:
The chart shows a failed attempt to break higher past the $30.84 resistance in mid-July 2024, followed by a decline. The price is currently testing the $22.17 support. The key will be whether this level holds in the coming days or if the price will drop to retest the much lower $14.09 support.
Conclusion:
As an analyst, I am closely monitoring the $22.17 support. A decisive close below this could lead to further declines, potentially towards $14.09. Conversely, a rebound from this level could see attempts to test and possibly break through the $30.84 resistance. The current market conditions, reflected by the bearish MACD but a relatively neutral RSI, suggest a cautious approach. Traders should consider setting stop-loss orders near the support levels to manage risks effectively. The next few trading sessions will be critical in determining the short to medium-term direction for INJ/USDT.
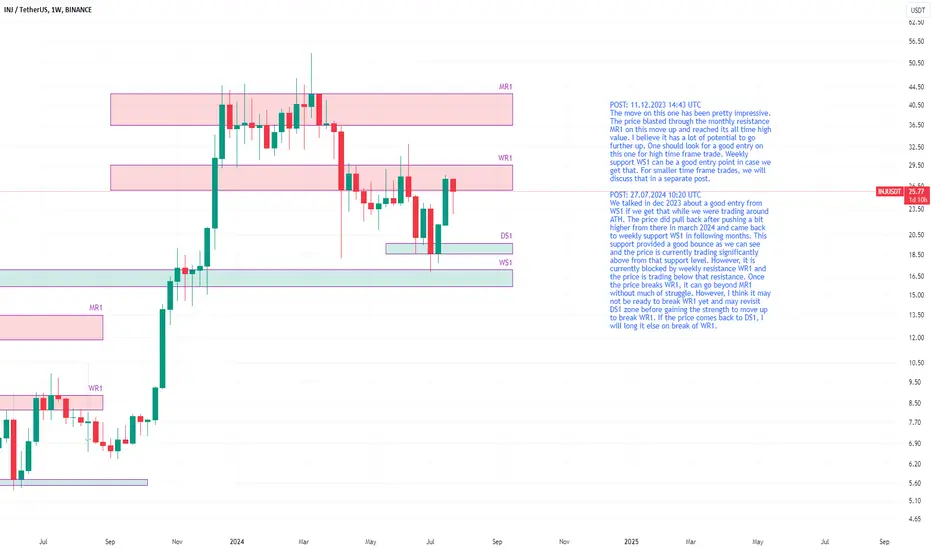
INJUSDT at weekly resistance, likely to pullback before riseWe talked in dec 2023 about a good entry from WS1 if we get that while we were trading around ATH. The price did pull back after pushing a bit higher from there in march 2024 and came back to weekly support WS1 in following months. This support provided a good bounce as we can see and the price is currently trading significantly above from that support level. However, it is currently blocked by weekly resistance WR1 and the price is trading below that resistance. Once the price breaks WR1, it can go beyond MR1 without much of struggle. However, I think it may not be ready to break WR1 yet and may revisit DS1 zone before gaining the strength to move up to break WR1. If the price comes back to DS1, I will long it else on break of WR1.
Inj Daily Chart Analysis Inj Daily Chart Analysis
Expecting a bullish rally up to 32.50 again we already broke upward at daily chart last time also we rally to 32.50 let hope for the successful trade here again if market keeps its momentum
stop loss below 23.50
TP : 27.50, 28.70, 30.50, 32.50
cheers follow like support

Inj/usdt Idea Inj/USDT is breaking out on the daily time-frame. I am expecting a strong bullish movement after a successful retest. Note: We anticipate a minor correction in BTC price, so wait for the retest. Do your own research (DYOR).
INJ long PlanINJ long Plan.
daily liquidity sweep. now just wait for the confirmation for OTE level and then can take long
Breakout Alert! Will INJUSDT Keep Climbing or Fall Back?Yello, Paradisers! Are we on the brink of a significant move for #INJUSDT?
💎#INJ has successfully broken out of a descending channel pattern, suggesting a high probability of continuing its upward movement. The price has already retested the support level, indicating a strong likelihood of moving toward the resistance zone at 28.5 - 30.8.
💎Historically, INJ faced rejection and a false breakout at this zone. For a sustained upward trend, it must break through this resistance, switching back to bullish momentum and potentially reaching our target resistance area.
💎However, if INJ fails to break through and falls back to the support area at 24, it might create new momentum. If it fails to rebound and breaks down the support directly, this could be a bad sign, with the price likely revisiting the strong demand area at 18.4.
💎Historically, INJ has shown strong rebounds from this demand zone, consistently moving upward afterward. Therefore, it’s crucial for the price to bounce when revisiting this area. If it fails to do so, the bullish invalidation will be confirmed, and the price may dip further.
Trade smart, Paradisers!
MyCryptoParadise
iFeel the success🌴

#INJ/USDT#INJ
The price is moving in a bearish channel on a 4-hour frame and is holding it strongly and is about to break it upward
We have a bounce from the green support area at 18.00
We have a tendency to stabilize above the Moving Average 100
We have a downtrend on the RSI indicator that is about to break higher and supports the rise
Entry price is 20.00
The first target is 23.60
The second goal is 25.50
The third goal is 28.00

Long INJ
INJ is currently at weekly support and is bouncing well.
I open a Long with setup as in chart.
Disclaimer:
This analysis is based on my personnal views and is not a financial advice. Risk is under your control.

INJUSDT Poised for a Major Move – Are You Ready?Yello Paradisers! Have you been tracking INJUSDT lately? If not, now's the time to focus. INJUSDT is currently in a critical demand zone and showing strong momentum above the EMA, suggesting a potential bullish breakout.
💎In our previous observations, #INJUSDT faced rejection at a higher supply zone $31.14, causing a significant decline. Now, it’s operating within the demand zone around $24.78, maintaining strong momentum above the EMA 100. If INJUSDT continues to sustain its momentum above this EMA, there's a high probability it will challenge the supply area again, potentially breaking above the resistance.
💎However, if INJUSDT fails to maintain its momentum above the EMA and drops below the lower demand zone, we could see a significant price drop and bullish invalidation.
Remember to employ prudent trading strategies and use proper stop-loss measures. Stay alert to market movements for timely updates.
This market requires patience and strategy. Only those who understand the market cycles will reap the benefits. Remember, timing at the right levels is crucial for consistent profitability. Be strategic, stay disciplined, and you’ll be in the winner’s circle.
MyCryptoParadise
iFeel the success🌴

SPOT INJIn the crypto market, after each liquidity and receiving it
Spot buying becomes very important. You can buy in two stages of the current price and in the specified prices

INJUSDT Next Target $100!INJUSDT technical analysis update
NJ price broke the falling wedge resistance line on the daily chart. After a small retest, we can expect a bullish continuation. now price training above 100 and 200 EMA,
INJ price could reach $100 in a few months.
Regards
hexa
#INJ $INJ #bullish #breakout #longStill within the channel but a breakout above $28 should see it test ATH
Rest a while, then head north depending on market sentiment
The bull market run will test this theory. There are opportunities for entries along the way.
I got in at $26
Target in the ST - $28 likely
Subsequent targets
$30
$32
$38

INJUSDT 1-Day Chart 2024 best tokenThe red highlighted area below the current price action marks a strong support zone around the 15.00 - 20.00 range.
This level has previously provided a strong base for price to move higher.
A significant resistance level is identified at 45.00, which is the projected target for the upward movement.
Intermediate resistance levels at 39.91 and 42.78 might also be observed, acting as potential take-profit points.
The price recently broke above a key level of 24.24, indicating bullish momentum.
The chart shows a significant upward movement with a projected path towards the 45.00 level.
Ensure proper position sizing to avoid overexposure to market volatility.

INJ breaking down , 10$ very soonINJ is touching support the fivth time, if it breaks down, we will see massive down movement ahead.
INJUSDT Bullish Flag PatternINJUSDT Technical analysis update
INJ has formed a bullish flag pattern on the weekly timeframe, with the price moving towards a breakout. In the next few weeks, we can expect a 100-200% move in INJ.
Regards
Hexa

Is #INJUSDT Poised for a Major Bullish Breakout? Don't Miss ThesYello, Paradisers!Have you been tracking #INJUSDT lately? There's a major bullish continuation from support that could be just around the corner. Let's dive into the details!
💎 After a careful analysis of #INJECTIVE price action, we've observed a promising pattern. For a long time, CRYPTOCAP:INJ has been adhering to a descending trendline. Recently, it successfully broke above this trendline and resistance at $21.41, turning this level into support. If #INJ sustains momentum at this support, there is a high probability it will first target resistance at $23.41.
💎 However, due to previous strong bearish pressure, there's an imbalance in the price. It's likely that the price might revisit this level to fill the imbalance. If CRYPTOCAP:INJ fails to initiate an upward movement from the retest level of support, we should look for a bullish rebound from the lower demand at $18.94. On the flip side, if the price breaks below the $18.94 demand, this could invalidate the bullish setup and lead to further declines.
Stay sharp and trade smart, Paradisers! Stay disciplined and focused on your trading strategy.
MyCryptoParadise
iFeel the success🌴

INJ 400% move by November 2024Quite easy to get confluence on this chart
Some basic ideas in trends and channel expectations meet with fib extensions and trend based fib.
Targets depicted on chart at the 1.618 and 1:1 and channel line (measured from wave 2 and 4 and transposed to W3)
100-130 should be easily met in the coming months