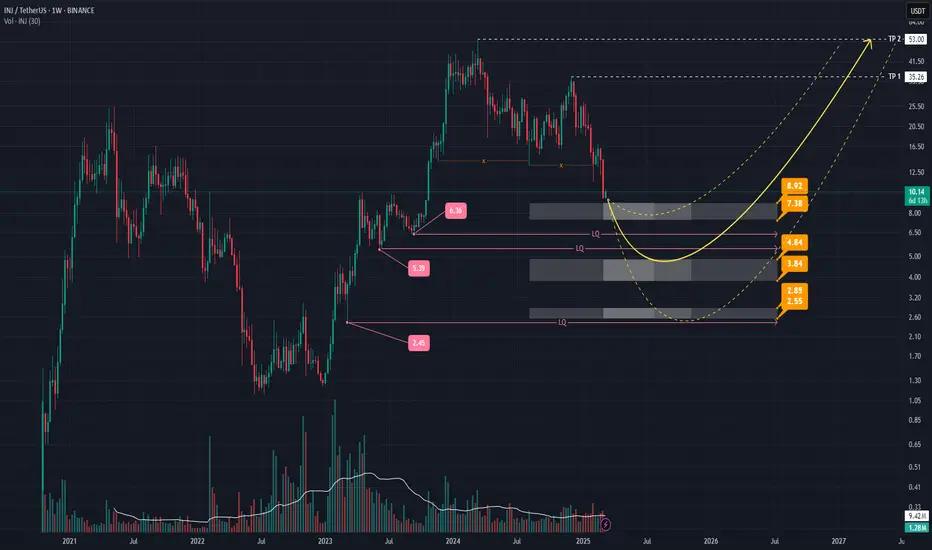
INJ Price Analysis: Key Zones & Reversal ScenariosHey everyone! 👋
Let's dive into this price chart and see what’s going on with INJ.
Overview:
We’re looking at INJ on a weekly timeframe , and there are some interesting levels to watch. The chart shows **three key zones** where price reactions might happen, marked with price levels. There are also areas of liquidity (LQ) , where the market might make a move before reversing direction.
Potential Reversal Scenarios:
Three possible price movements are shown with yellow arrows , each representing a different way the price might reverse. The second arrow is the primary scenario, suggesting that after sweeping at least one liquidity level, the price could bounce back up—especially if there’s solid volume and a strong candlestick pattern.
- Main Support Zone (3.84 - 4.84): This area is the most important. If the price reaches this zone and shows good volume and a strong candlestick pattern, it could signal a trend change.
- Other Support Zones (2.55 - 2.85 and 7.38 - 8.92): These are additional key levels. A drop below these could change the outlook.
Take Profit (TP) Targets:
TP levels are marked on the chart. If the price reverses as expected, these targets may be reached.
Final Thoughts:
Nothing in crypto is guaranteed! Always look for confirmations like volume and candlestick patterns before making decisions. Stay informed, trade smart, and always do your own research! 📊💡
INJUSDT.P trade ideas

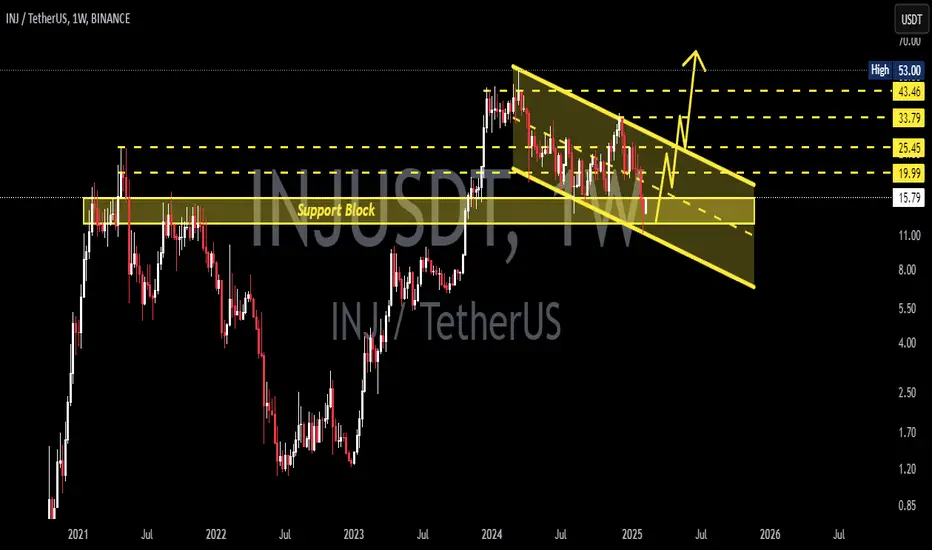
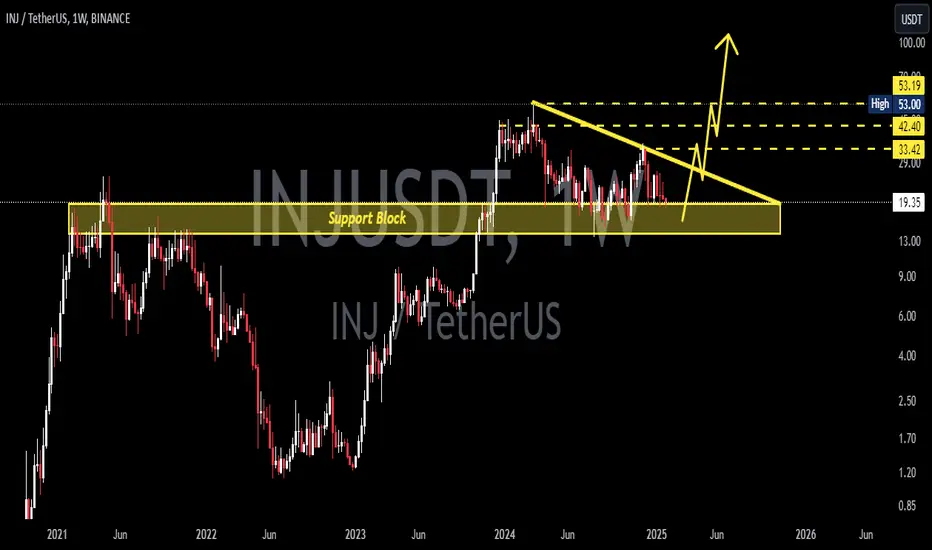
INJUSDT 1WThe price is currently in an uptrend and, after breaching the $25 threshold, it has entered a corrective phase. It is presently consolidating within the support zone delineated by the channel’s lower boundary and the ascending trendline. It appears that approximately one month will be required to complete the bottoming process for this asset. Following this consolidation, I anticipate a bullish move towards historical highs, with an initial target of $25.

INJ PUMP LOADINGINJ is at key level which was acting as resistance and after breakout now it has become support level. It is also in weekly FVG. Expecting reversal from here, upside key level marked if we close above that level then we will see huge pump in INJ as we witnessed in early 2024.

INJ Long OpportunityMarket Context:
INJ has retraced into a strong support zone, presenting a high-probability long trade for a potential rebound.
Primary Trade Setup:
Entry: $13.00 - $12.00
Take Profit Targets:
$16.00
$18.00
Stop Loss: Below $11.30
Secondary Trade Setup (Deeper Support):
Entry: $10.00 - $9.50
Take Profit: Adjust based on price action
Stop Loss: Below $9.00
This setup targets a bounce from major support, with the potential for a stronger rally if bullish momentum returns. 🚀

INJ 100$INJ is aiming for $100! The project has completed unlocking tokens, 80% of the entire issue is in the hands of the project team and their investors. We also formed a bullish flag and pushed from its lower boundary. Pay attention to this project!
Horban Brothers.

Injective Long Idea Injective Long Idea
Injective on higher time frames looks like bottomed. Volume profile looks good. Taking long.
Bybit
INJUSDT
E: 14 or Market Entry
TP1: 17.881
TP2: 19.962
TP3: 27.581
TP4: 34.064
TP5: 39.695
TP6: 48.690
SL: 13.581

inj short midterm"🌟 Welcome to Golden Candle! 🌟
We're a team of 📈 passionate traders 📉 who love sharing our 🔍 technical analysis insights 🔎 with the TradingView community. 🌎
Our goal is to provide 💡 valuable perspectives 💡 on market trends and patterns, but 🚫 please note that our analyses are not intended as buy or sell recommendations. 🚫
Instead, they reflect our own 💭 personal attitudes and thoughts. 💭
Follow along and 📚 learn 📚 from our analyses! 📊💡"

INJ buying areaINJ is getting close to the bottom, maximum to 10USDT, once we reach that we will be in a bullish trend
INJUSDT 1WINJ ~ 1W Analysis
#INJ Form a bullish flag pattern. Buy gradually from here with a minimum target of 20%+.
INJUSDT 3D#INJ is moving inside a descending channel on the 3-day chart and has bounced back from the channel support. Currently, it is heading toward testing the middle line of the channel. There is very heavy resistance around the $22.00 level. Anyway, our targets for the mid-term are:
🎯 $22.07
🎯 $28.76
🎯 $34.16
🎯 $39.57
🎯 $47.26
🎯 $57.07

inj sell limit"🌟 Welcome to Golden Candle! 🌟
We're a team of 📈 passionate traders 📉 who love sharing our 🔍 technical analysis insights 🔎 with the TradingView community. 🌎
Our goal is to provide 💡 valuable perspectives 💡 on market trends and patterns, but 🚫 please note that our analyses are not intended as buy or sell recommendations. 🚫
Instead, they reflect our own 💭 personal attitudes and thoughts. 💭
Follow along and 📚 learn 📚 from our analyses! 📊💡"

Injective Protocol (INJ): Possible 30% Movement To Catch Injective Protocol has a nice possibility of 30% movement to happen, but there is a high likelihood of seeing a re-test of recent EMAs (which left behind itself a bigger CME gap).
More in-depth info is in the video—enjoy!
Swallow Team

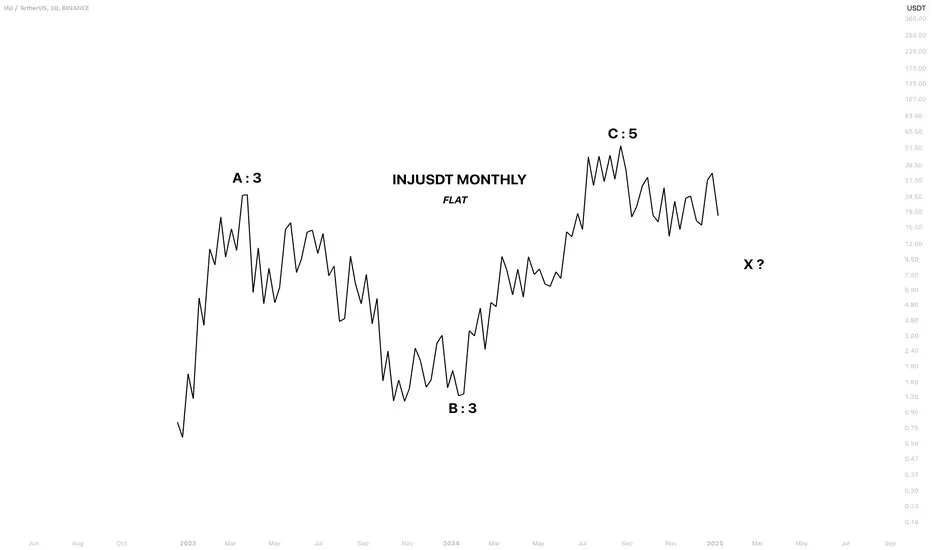
INJUSDT NEOWAVE ANALYSISWave A is the fastest and strongest wave on the chart, indicating that the long-term trend is up, and any downward wave is counter-trend.
The pattern is a flat correction, confirmed complete in April 2024 with the drop from $52 to $18.
Currently, we appear to be in an X wave.
The X wave can be labeled as small or large based on its retracement of the entire pattern. Since it is not yet complete, I cannot provide further details based on the monthly chart.
However, the price is likely to fully retrace the $13 low, and it should head lower.
SHORT Bearish Hammer on liquidity place gathering
and a lot of tails
down common trend
probably go to 13,5
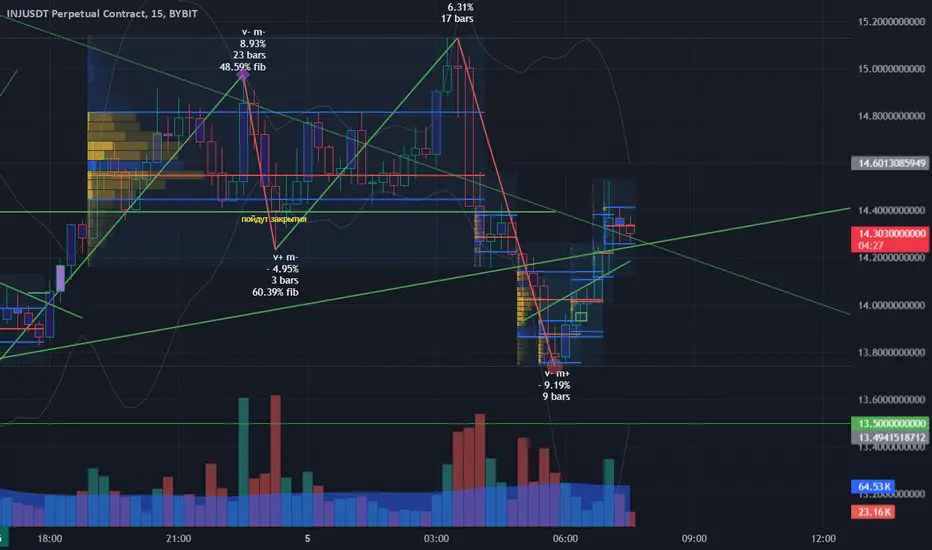
LONG INJ 1H absorbtion
false falling from triangle mean we got back with cup to 14,54 and high probability move further
#INJ/USDT#INJ
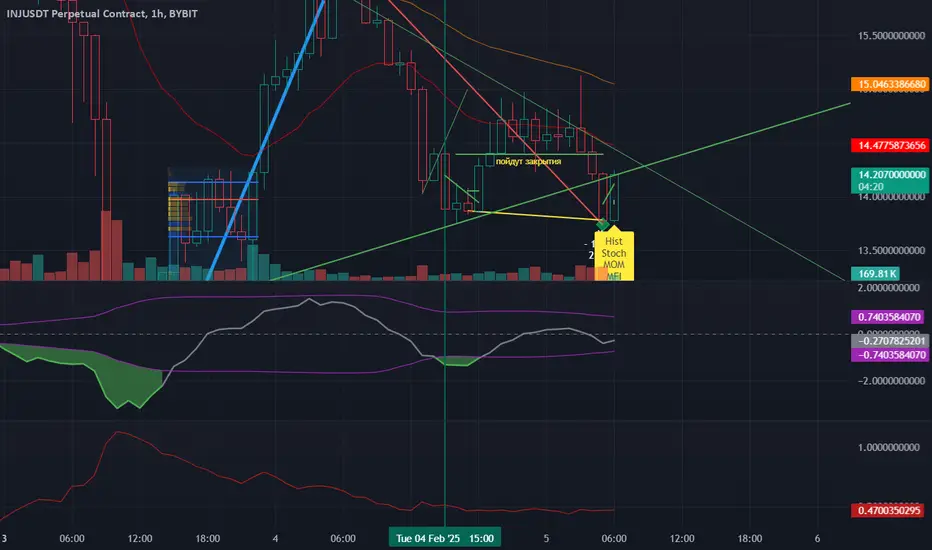
The price is moving in a descending channel on the 1-hour frame and is adhering to it well and is heading to break it upwards strongly, and retest it
We have a rebound from the lower limit of the descending channel, this support is at a price of 12.
We have a downtrend on the RSI indicator that is about to break and retest, which supports the rise
We have a trend to stabilize above the moving average 100
Entry price 14.60
First target 15.57
Second target 16.77
Third target 18.22

INJ Short Position: High-Risk, High-Reward Setup with Tight StopTaking a short on CRYPTOCAP:INJ with super tight stops cause shorting crypto rn is risky with this bull market. But this setup is too good to ignore - TP levels on chart.
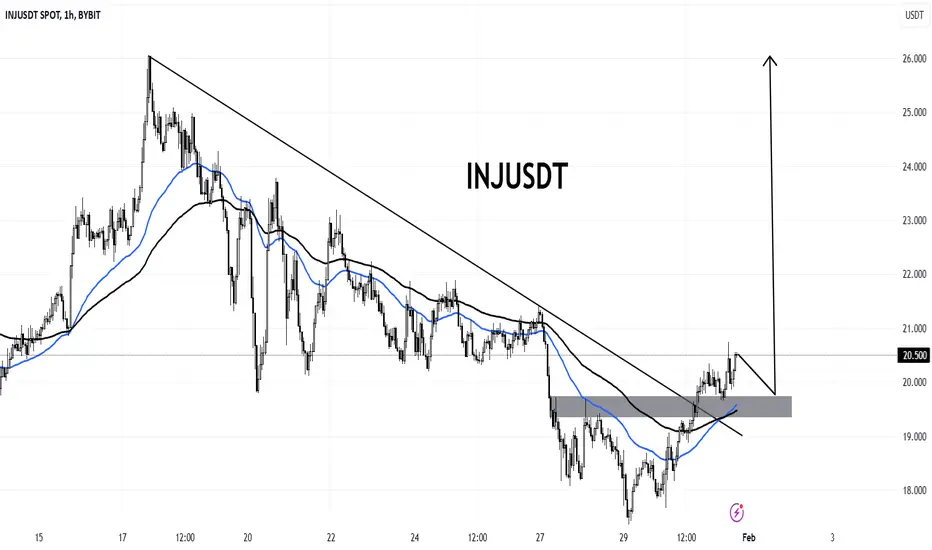
INJUSDTINJUSDT is showing good structural shift.
As the market is broke through the minor bearish structure and also break the descending trendline.
A moving average cross over also showing the good movement to the upside. If it sustains the local support of 19 then the upside target could be 26.
INJUSDT 1WINJ ~ 1W Analysis
#INJ In this time frame 1W the main support that previously held the price, Buy from here if you still have a Conviction on this coin with a minimum target of 20%+
inj/usdt spot trade inj/usdt spot trade longterm.
buy inj from entry 01 and 02 and hold for 5 months to gain 2x to 3x

INJ 1H Updatemy favo INJECTIVE It seems to be in a good condition, and we should be waiting for a breakout and a move out of this consolidation 🫡🚀
