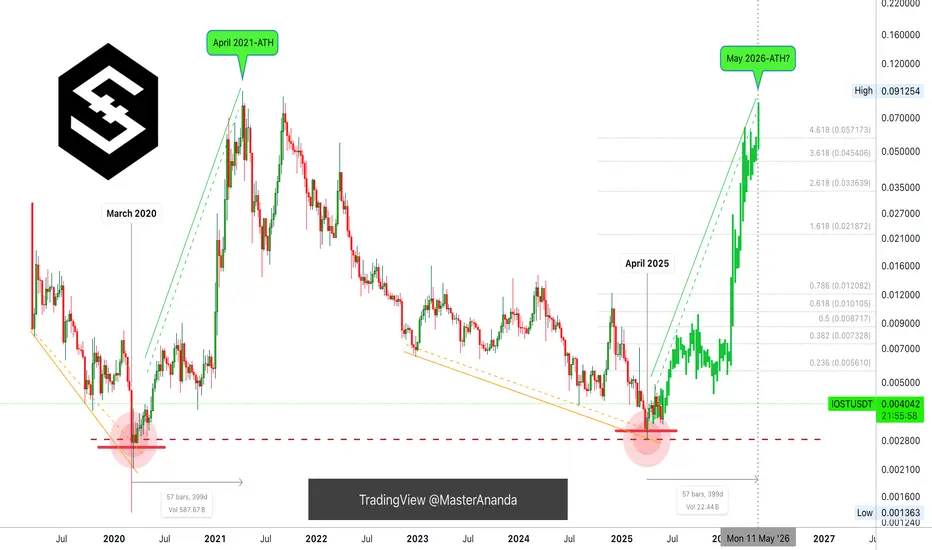
IOST: New All-Time High May 2026? Interesting... Must Read!The lowest price ever for IOST happened March 2020. The second lowest happened April 2025. We shouldn't expect for IOSTUSDT to go as low as March 2020, we can easily say/predict/assume that the bottom is already in.
Let me show you something really interesting.
IOST entered a bull market after the
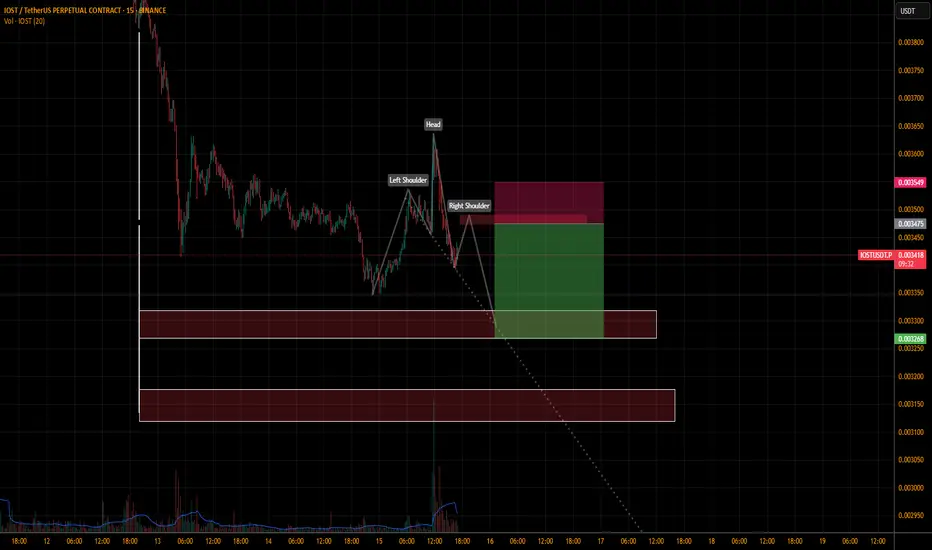
IOSTUSDT.P SHORTAs we can see iost is forming a kind of head and shoulder pattern we enter short once we see the bearish momentum at right shoulder box or near the area it might spike with longer wick so wait for the confirmation before entering the trade
DYOR
IOSTUSDTIOST
Float
its just an idea please don't take it serious.
if u cant have an entry , go with flow

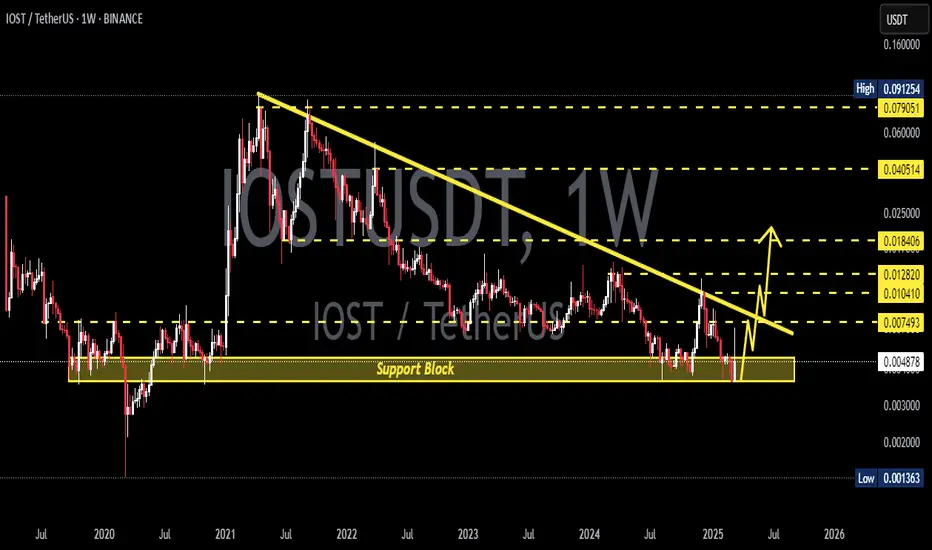
IOSTUSDT 1WIOST ~ 1W Analysis
#IOST Buy gradually from here with a short -term target of at least 20%+. This is a very good support for now.

IOST in the low risk areahi traders
IOST is inside the downsloping channel.
It doesn't look bad where it's now.
It's close to the bottom of the channel so it's in a low-risk area.
Many will sell when it's time to buy.
The macro down-trend is still intact and the top of the formation shown on the chart is the target for lon

IOSTUSDT 1WIOST ~ 1W Analysis
#IOST Buy back from here with a short -term target of at least 20%+ from here.
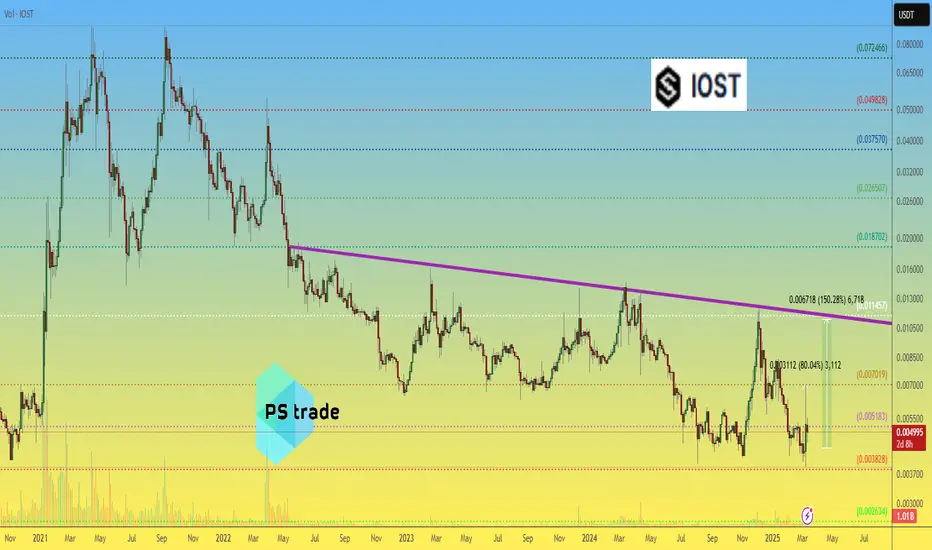
IOST price analysis⁉️ Who knows why the price of $IOST shot up so much yesterday?
🟢 The project is old - from 2018.
🟡 Capitalization is only $100 million.
🔴 It has been in the downtrend for more than 3 years and the price of OKX:IOSTUSDT has not really grown.
What do you think, is it worth buying? 150-160% of the
IOSTUSDT CHART ANALYSİS - EDUCATIONAL POSTConclusion
The NFT market is developing extremely fast, and the blockchain infrastructure has undergone significant changes over the past few years. However, today, there are still many questions about how the NFT market can function and in which areas non-fungible tokens can be used.
For example

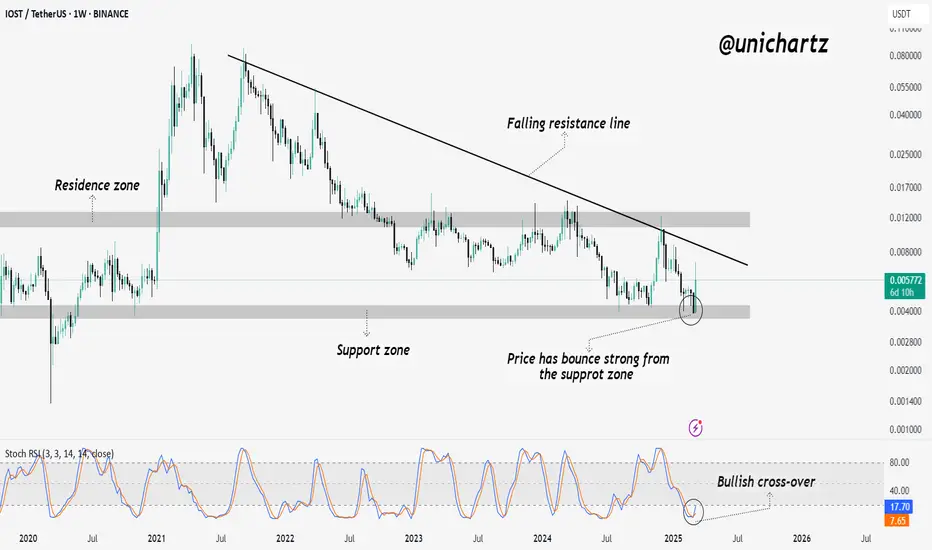
IOST Breakout Coming? Avoid FOMO & Trade Smart!IOST/USDT 1W chart shows a strong bounce from the support zone, indicating potential bullish momentum. The price is currently approaching the falling resistance trendline, which has acted as a major barrier in previous attempts to rally. The Stoch RSI has formed a bullish crossover, signaling a poss
IOSTUSDT 1WIOST ~ 1W Analysis
#IOST So far it still maintains this block of support. Buy from here with a minimum target of 20%++.

See all ideas
Summarizing what the indicators are suggesting.
Oscillators
Neutral
SellBuy
Strong sellStrong buy
Strong sellSellNeutralBuyStrong buy
Oscillators
Neutral
SellBuy
Strong sellStrong buy
Strong sellSellNeutralBuyStrong buy
Summary
Neutral
SellBuy
Strong sellStrong buy
Strong sellSellNeutralBuyStrong buy
Summary
Neutral
SellBuy
Strong sellStrong buy
Strong sellSellNeutralBuyStrong buy
Summary
Neutral
SellBuy
Strong sellStrong buy
Strong sellSellNeutralBuyStrong buy
Moving Averages
Neutral
SellBuy
Strong sellStrong buy
Strong sellSellNeutralBuyStrong buy
Moving Averages
Neutral
SellBuy
Strong sellStrong buy
Strong sellSellNeutralBuyStrong buy
Displays a symbol's price movements over previous years to identify recurring trends.