IOST/USDTLong way to go but has some major upgrades Dec through to March/April 2021. One to keep an eye out for.
coinscalendar.com
IOSTUSDT.P trade ideas

IOSTUSDT - Weekly analysis IOSTUSDT is printing the inverse head and shoulders trend reversal pattern on the weekly timeframe.
Buy entry ⬆️ - breakout above the inverse head and shoulders neckline resistance.
Target 🎯 - Resistance level.
Setup invalidation ❌ - breakdown below the inverse shoulder support.

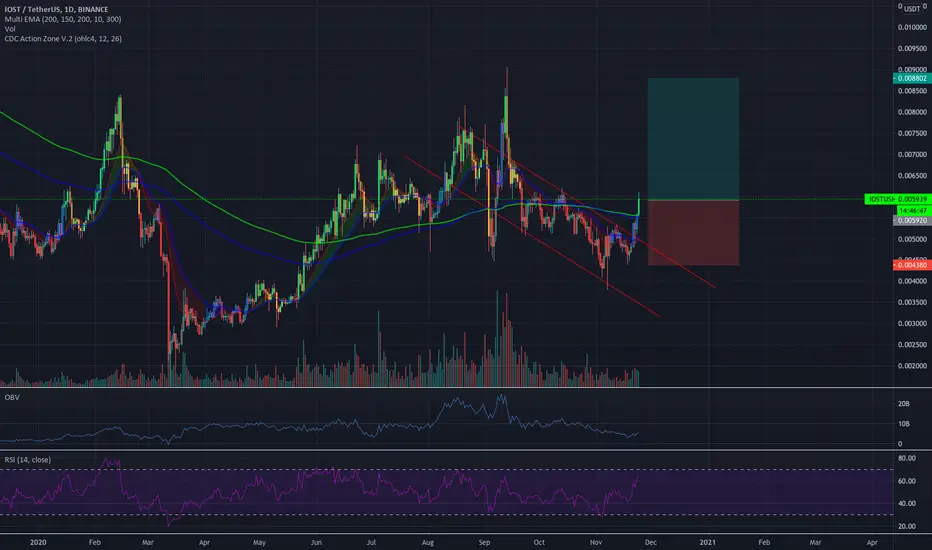
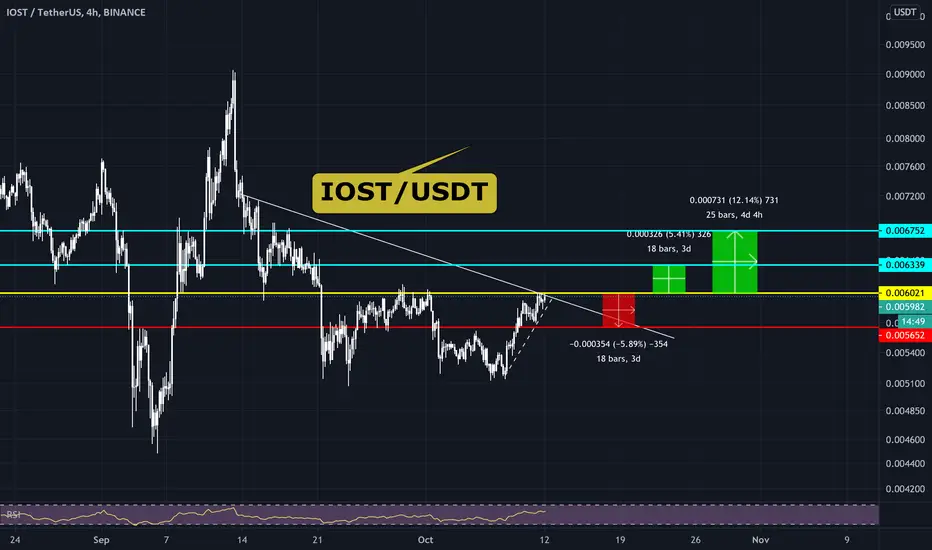
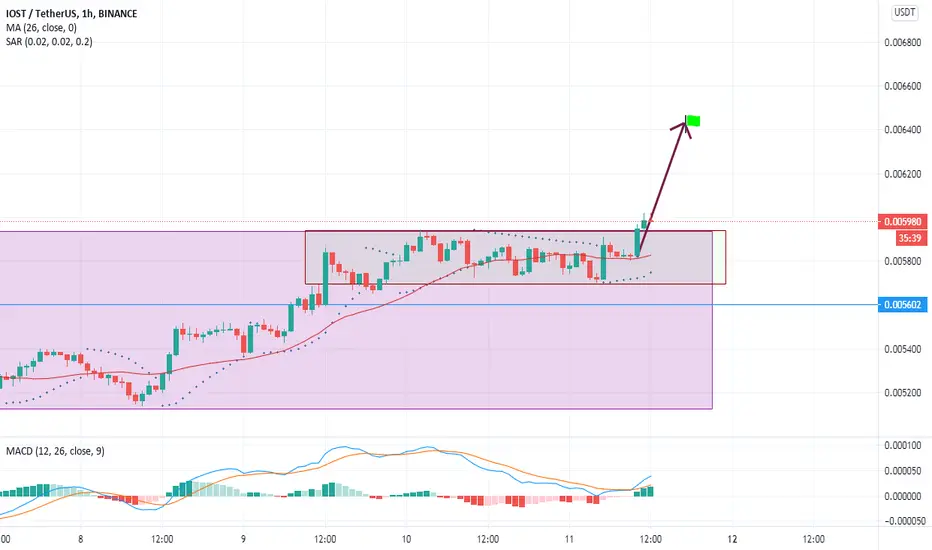
IOST/USDT - potentail setup (+35%)Hello, Traders!
IOST is in the main trading range of $0.005150-0.006126.
Dynamic support for the price is provided by MA100 on the daily timeframe.
The local buying liquidity buffer is in the range of $0.005550 - $0.006126 where you can accumulate the first part for the long position.
To reduce the risk in case of a sharp dump, the second part of the long position can be gained:
1) between 0.005150-0.005500 $ in case of the retest of the lower limit of the main trading range - the level of 0.005150 $.
2) between $0.006126 - $0.006424 $ in case of price reaching the upper border of the trading range - the level of $0.006126.
The targets will be the price levels of $0.007355 - $0.008340. For a mid-term trade, we can add a target of $0.010382
The SL can be set under $0,004890
Good luck and please leave your feedback below.
P.S. This is not financial advice, but only trade I would be following myself

Falling WedgeAfter breaking out of the falling Wedge, price has found a strong support and it's ready to moon.

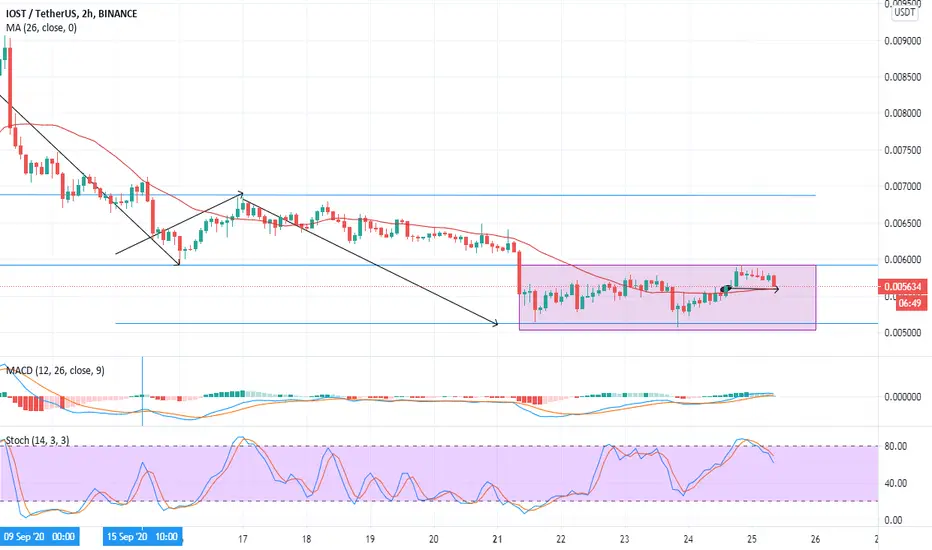
IOSTUSDT breakout from descending channel 🦐IOSTUSDT had a breakout from the descending channel, and now the price is creating an ascending triangle.
IF the price will break the triangle and retest it as support, According to Plancton's strategy, we can set a nice order
–––––
Follow the Shrimp 🦐
Keep in mind.
🟣 Purple structure -> Monthly structure.
🔴 Red structure -> Weekly structure.
🔵 Blue structure -> Daily structure.
🟡 Yellow structure -> 4h structure.
⚫️ Black structure -> <4h structure.
Here is the Plancton0618 technical analysis, please comment below if you have any question.
The ENTRY in the market will be taken only if the condition of the Plancton0618 strategy will trigger.

IOST | 30% Profit Potential #PositionalTradeHello Dear Traders,
IOST is showing great potential in spot buy
Stoploss will be Updated later
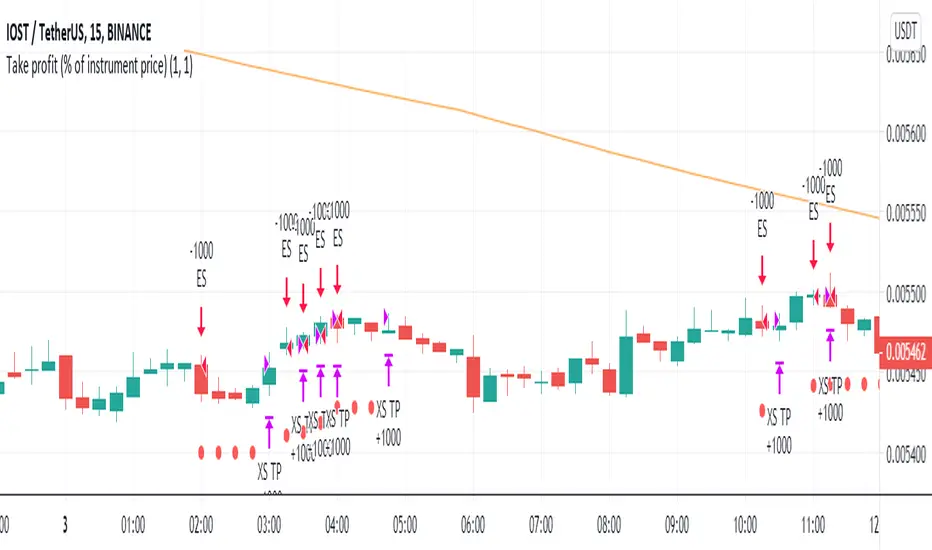
IOST Short Scalp Trade #BiananceFuturesHello Dear Traders,
IOST Short Setup
Entry : 0.004900
Stoploss : 0.004990
Target: 0.0004760

IOST/USDT IOST looks on fire from this level. I will open 50% of full trade long now If btc stays here. (0.005161 - 0.0052)
In case of dump im adding the rest 50 % at the price of 00.4520
In case of breakout im adding the rest 50% at the price of 00.5743

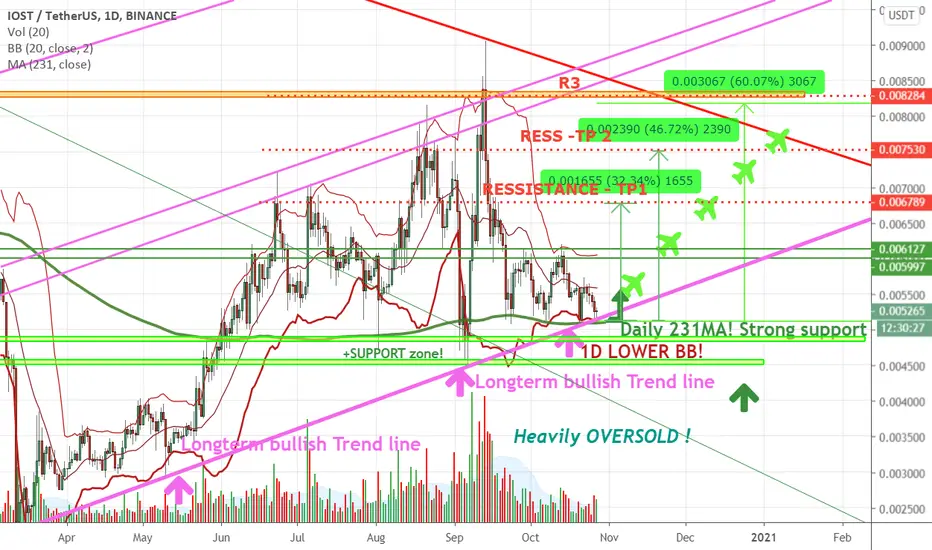
IOST oversold! BULLish potencial min. +32-60% !!!2CHEAP 2IGNORE
IOST fundamentally very strong coin, moreover, technically now very Oversold, excellent oportunity to BUY --- MOON SOON!
iost.io
twitter.com
research.binance.com
last NEWS!
btcmanager.com
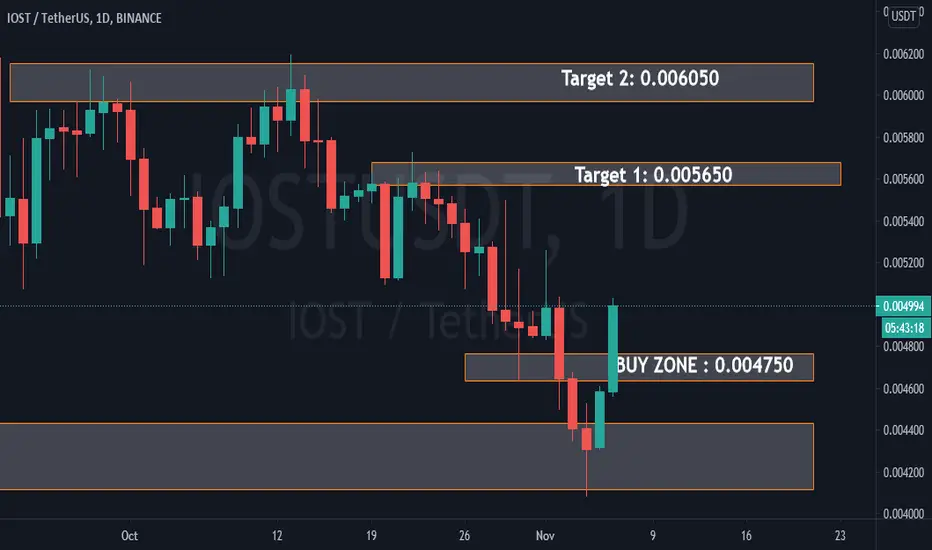
IOST | Approaching for More than 22% Upside Move Hello Dear Trader,
As u can see in Chart how beautifully IOST bounced frm lower levels Demand zone
as btc is rising continuously alongside all alts are also showing significant move upside
only daily time frame IOST has made Triple bottom chart pattern and soon it will break chart patterns neckline.
Please share your opinion and leave a comment and / or give it a like.
This trading idea has been presented to you by ROHITWORKSS


IOSTUSDT AnalysisI am currently bullish about IOST at the moment while EngineeringRobo remains neutral.
Now would be a good time to buy as the candles are open close above the resistance line and support level.
You can sell at the 0.007 or 0.010 resistance level or wait for the Hell signal.
After you buy, watch closely for EngineeringRobo sell signals! If you want to use EngineeringRobo, DM me!
