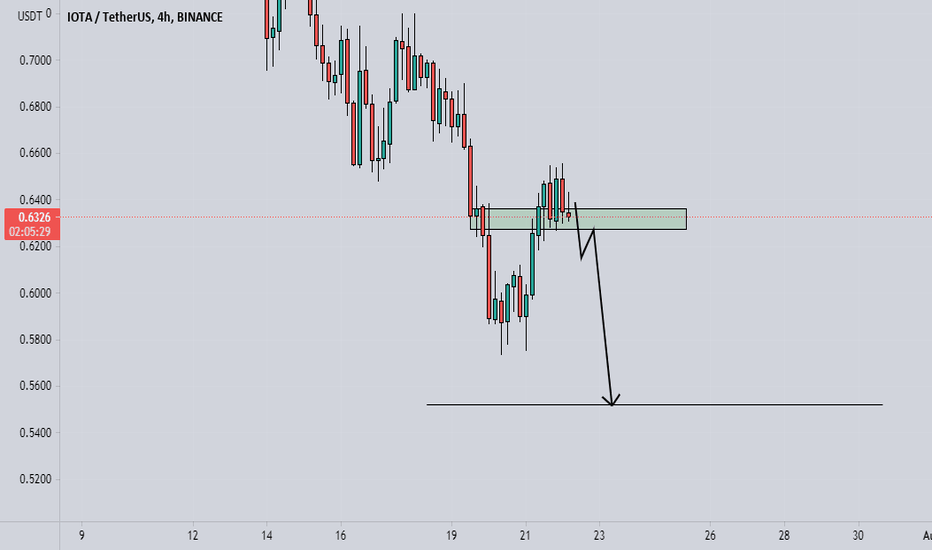
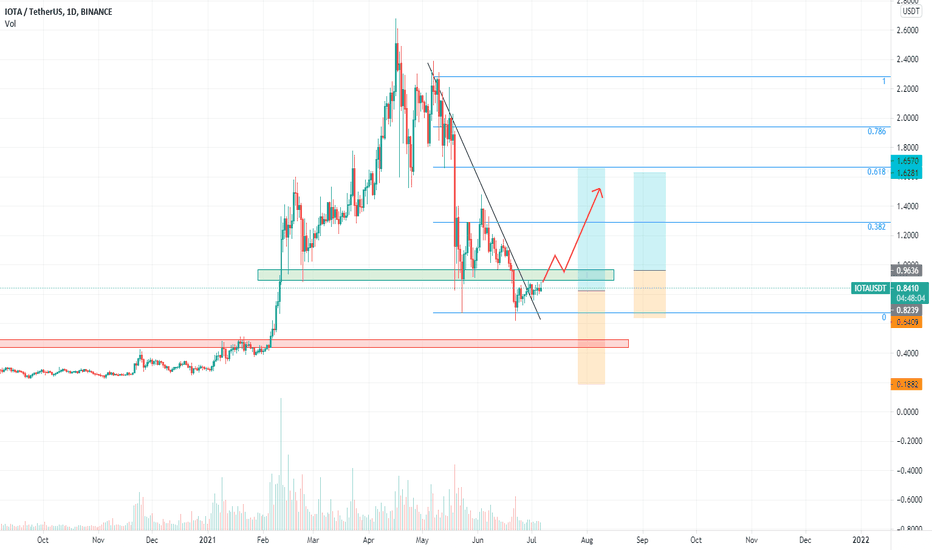
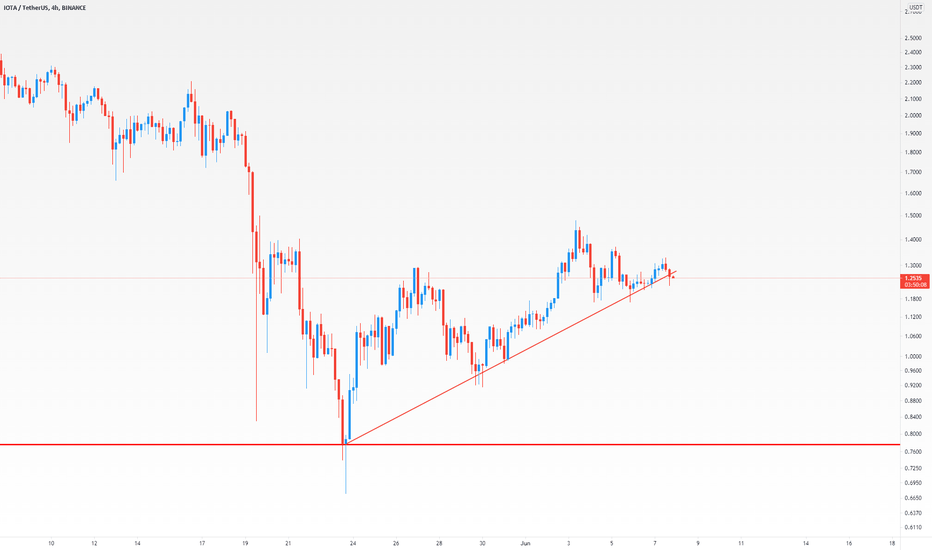
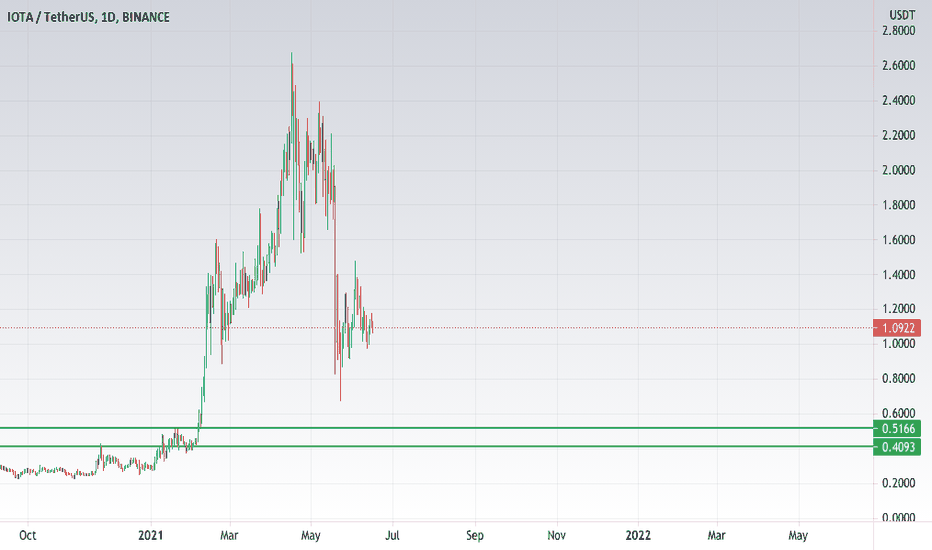
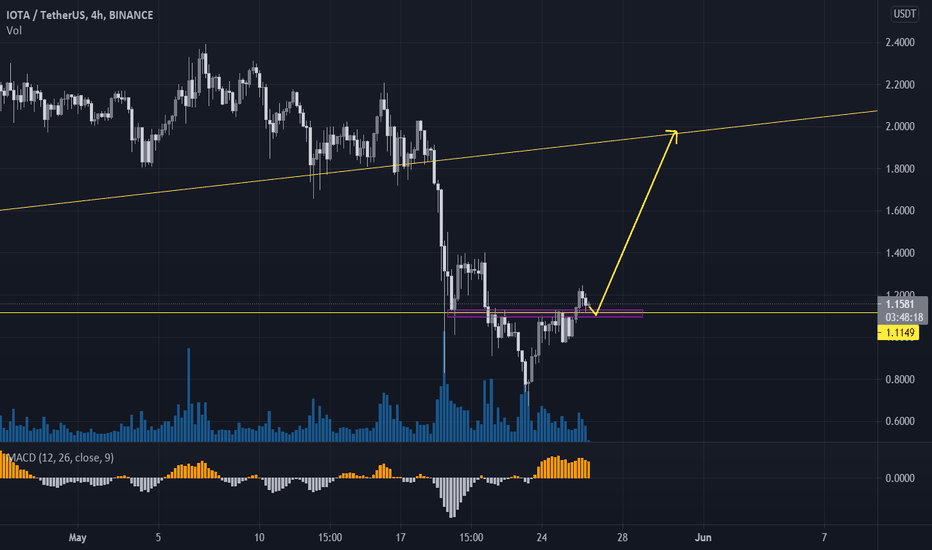
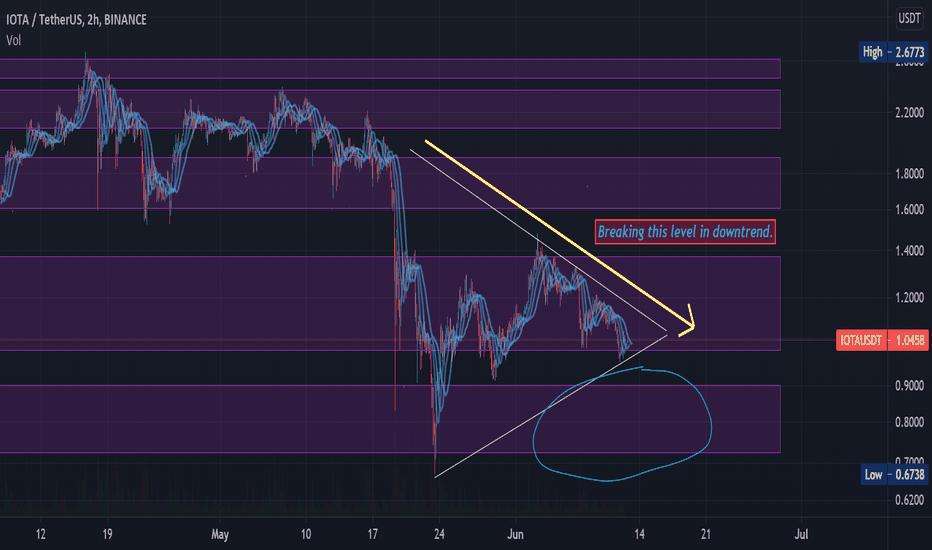
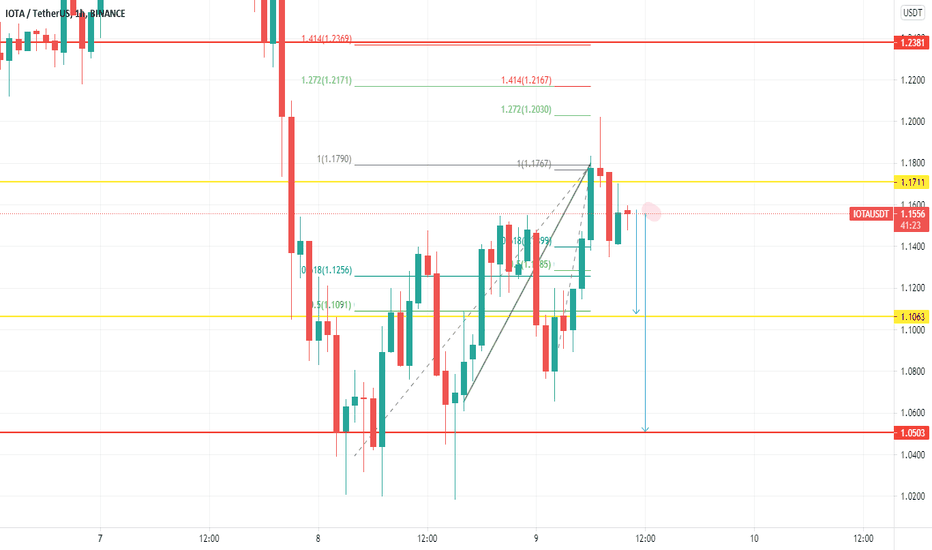
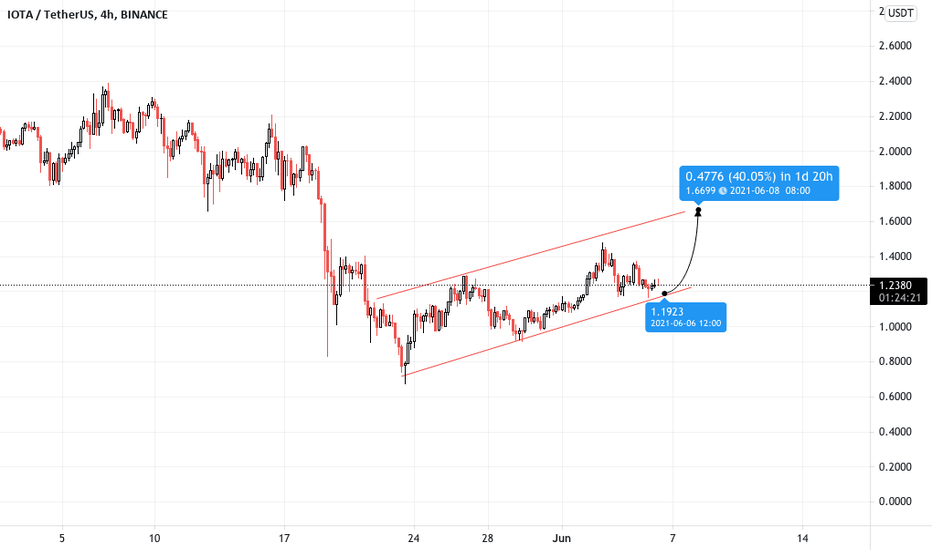
IOTAUSDT UPDATEIOTA is still looking bearish, on the daily timeframe since markets recent bearish impulse the market has made a correction to retest previous support as new resistance in confluence with the 0.618 fib. On the 4hr timeframe however at the moment everything is currently bullish the market is forming higher highs and higher lows during this corrective move to the upside. What we will be waiting for is a new 4hr lower low to close below this area of support then on the retest we can possibly look at capitalising on this continuation to the downside. SETUP remains invalid until we see a 4hr lower low.
IOTAUSDT.P trade ideas
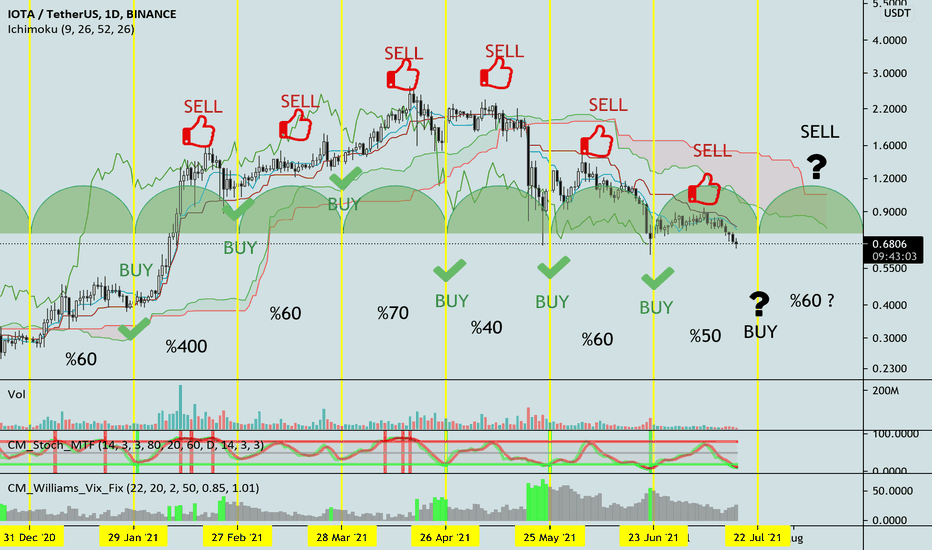
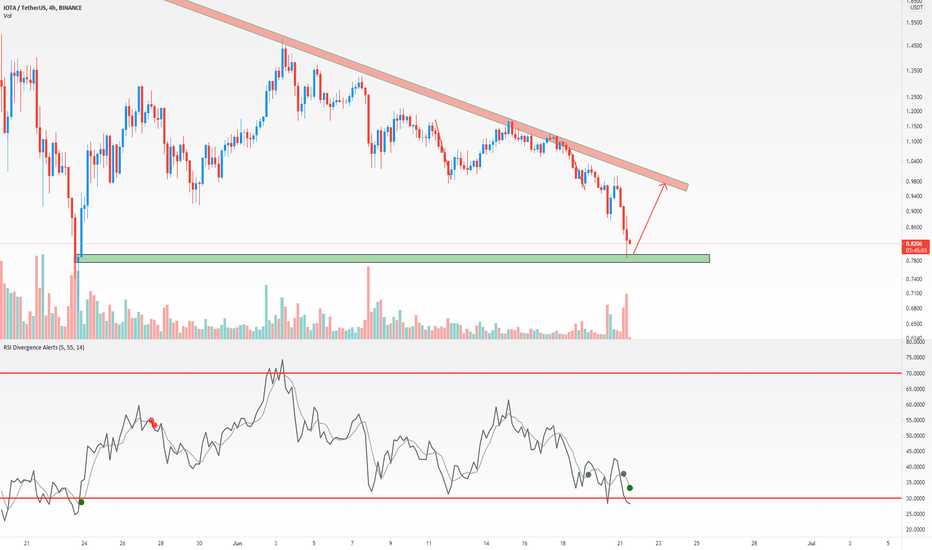
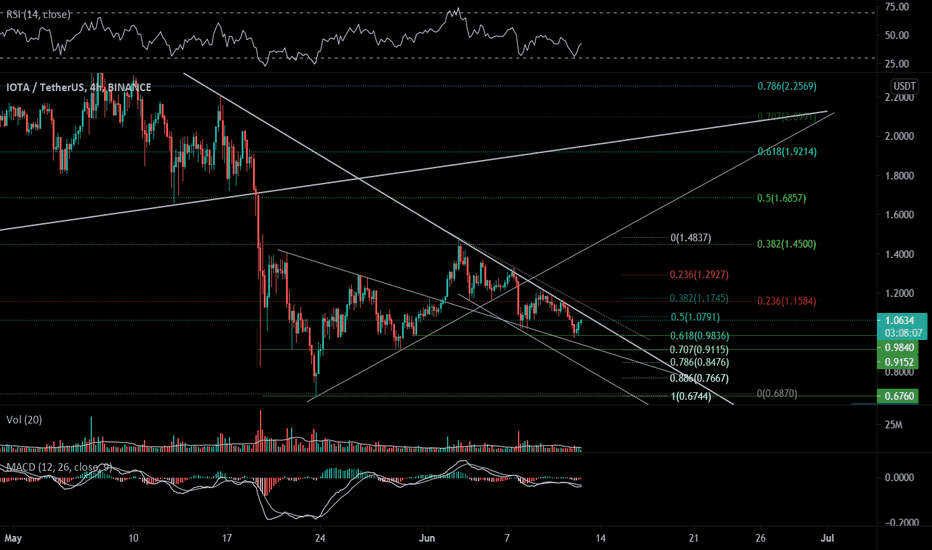
IOTA/USDTWe have 2hr bullish divergences on RSI + OBV - good opportunity the trend will reverse.
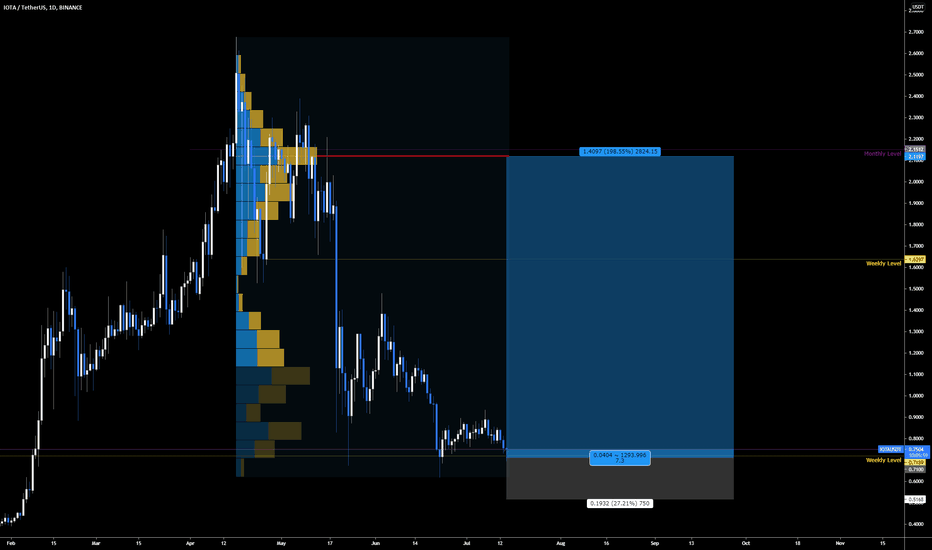
Every marked level (daily, weekly, monthly) = set take profit limit. POC (red line), place with the most of volume is TP1 for me.
BTC will affect the progress of this setup so I will be careful in case of dump.
!!! This is just paper trade, please dont follow my setups blindly without your own analyse !!!
IOTA formed another big setupThe previous harmonic butterfly:
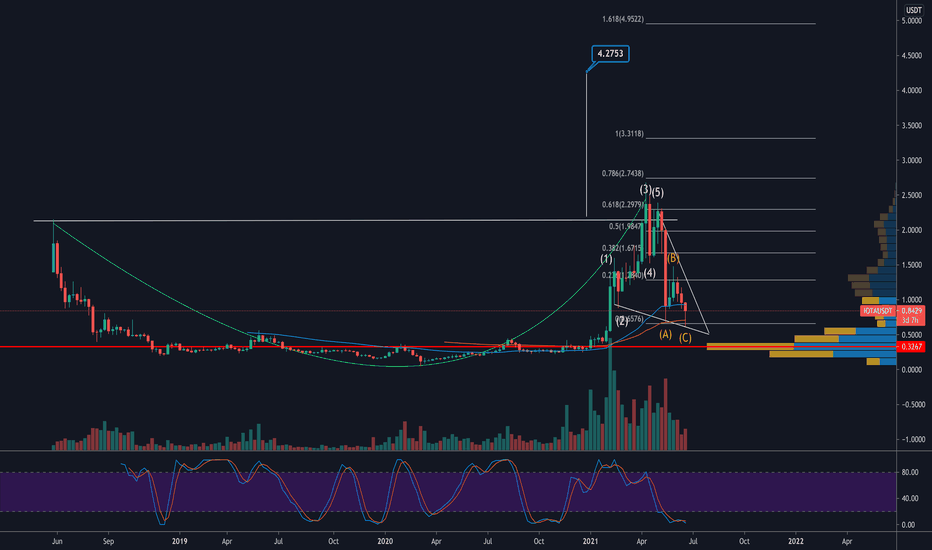
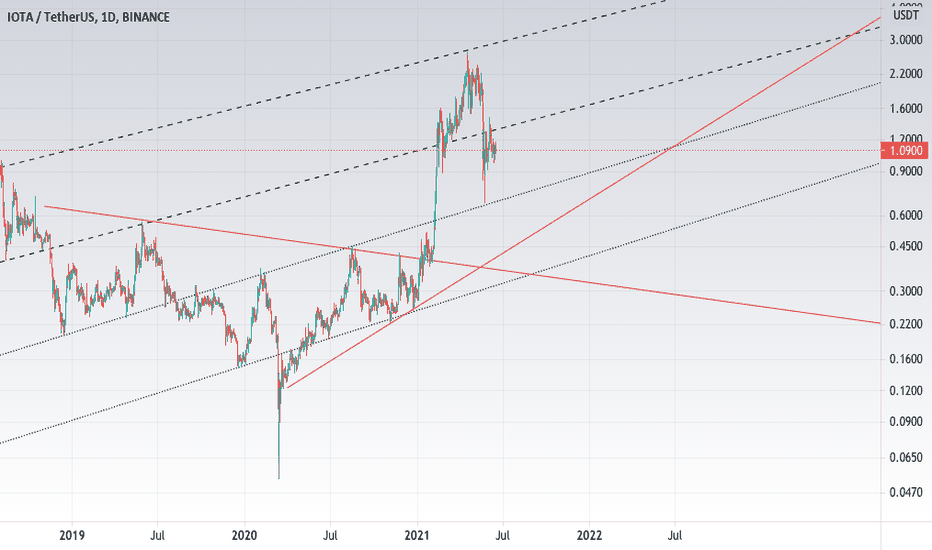
In this article I'll share with you how the price line of the IOTA coin has formed a very big harmonic pattern. Before this, I've already shared another major idea and that was a very big bullish butterfly which was formed on the weekly time frame chart. After taking bullish divergence from the potential reversal zone of this big bullish butterfly pattern, the Priceline surged to more than 1100%.
support resistance levels and SMAs:
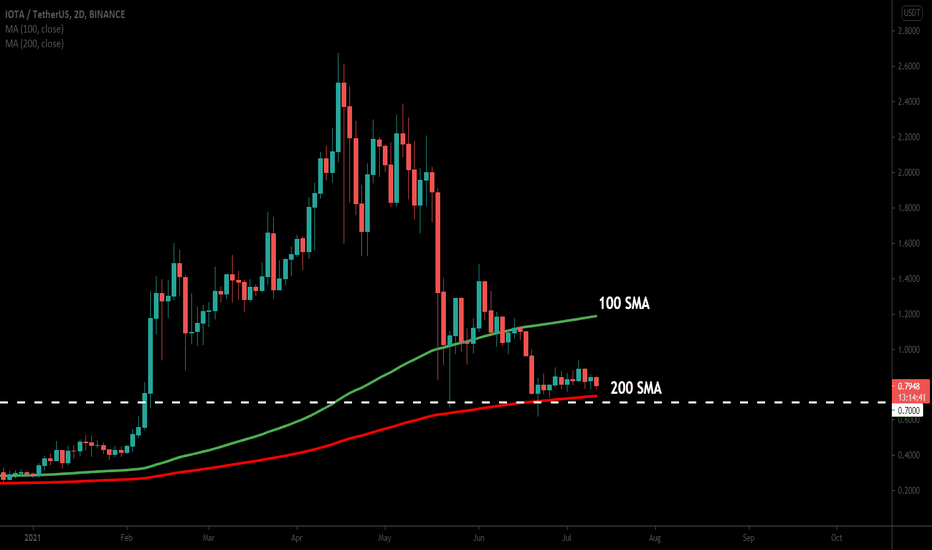
After a very big rally, IOTA found strong resistance at $2.50 and after being rejected by this resistance level the price action moved down at the very strong support at $0.70. Now the price is moving at the $0.70 support level for the past several days. We also have very strong support of 200 simple moving average on the 2-day chart, which is exactly at the $0.70 support level. The next price level resistance is at $1.50 and then at $2.50. There is also a 100 simple moving average working as strong resistance before the $1.50 resistance level.
Big Cypher pattern:
Now this time on the weekly time frame chart, the price action of IOTA has formed another bullish Cypher pattern. After entering the buying zone the priceline has moved above the potential reversal zone and now agai re-entered the buying zone. The buy and sell targets according to Cypher can be as below:
Buy between: $0.8888 to $0.5214
Sell between: $1.17 to $1.87
The maximum extent of potential reversal zone $0.5214 can be used as stop loss. As per the above targets, this trade has a big profit possibility of 250%, and the big loss possibility is 41%.
MIOTA CALLINGIn our opinion, BTC has yet to lose a few percent against alts.
MIOTA seems to have developed a good setup for our new entry, we take advantage of this opportunity to return with a size always in view of our long-term targets but at the same time we will leave the ship in partly upon reaching the targets marked in red.
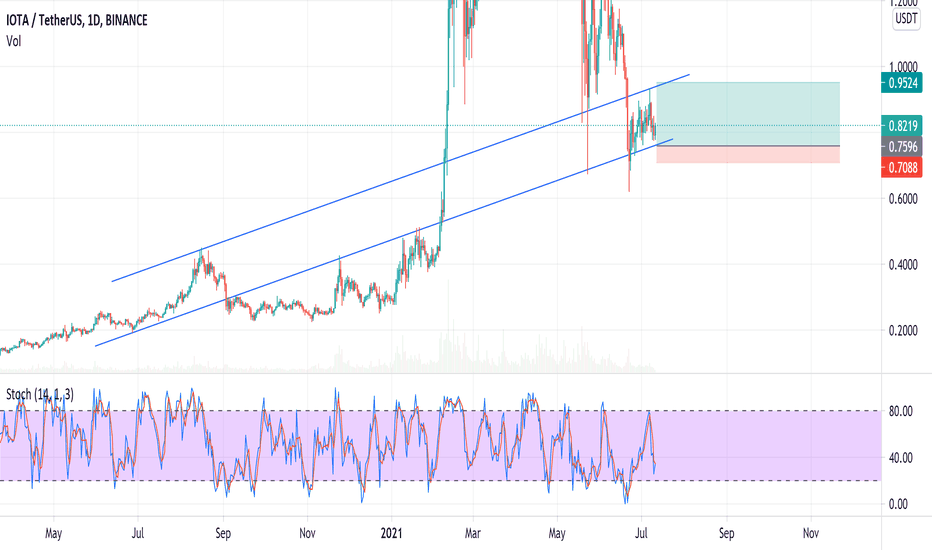
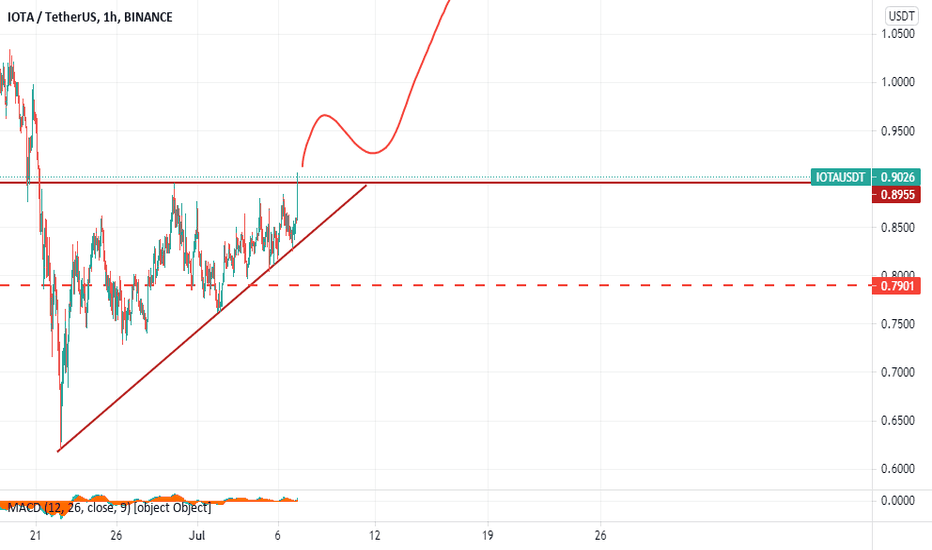
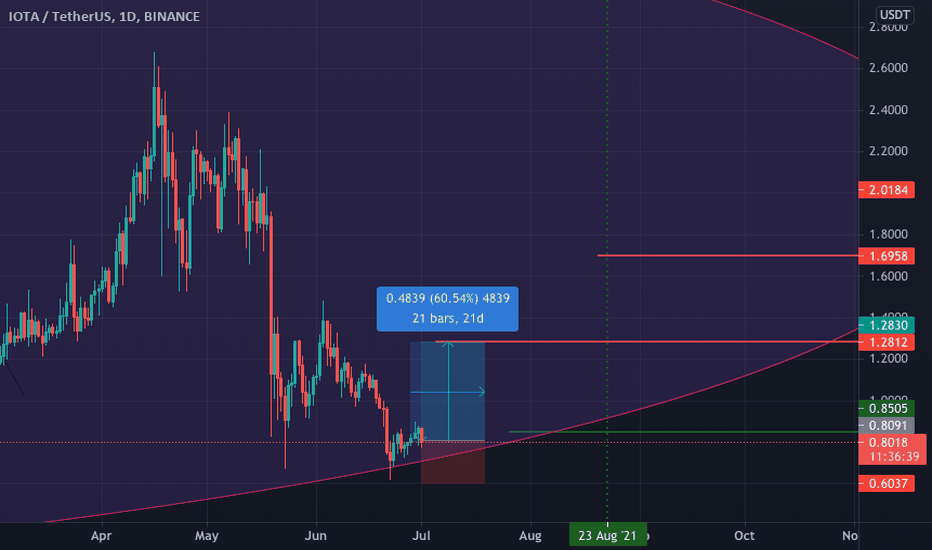
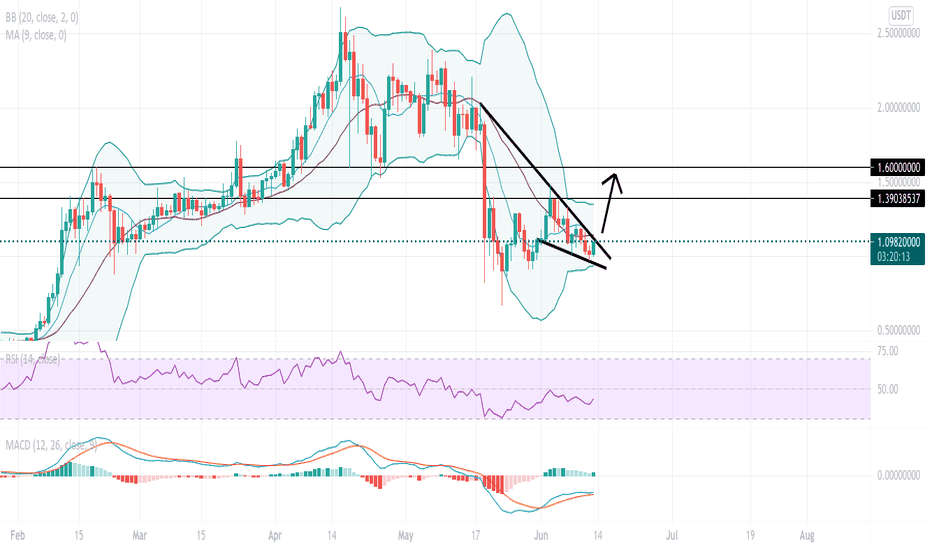
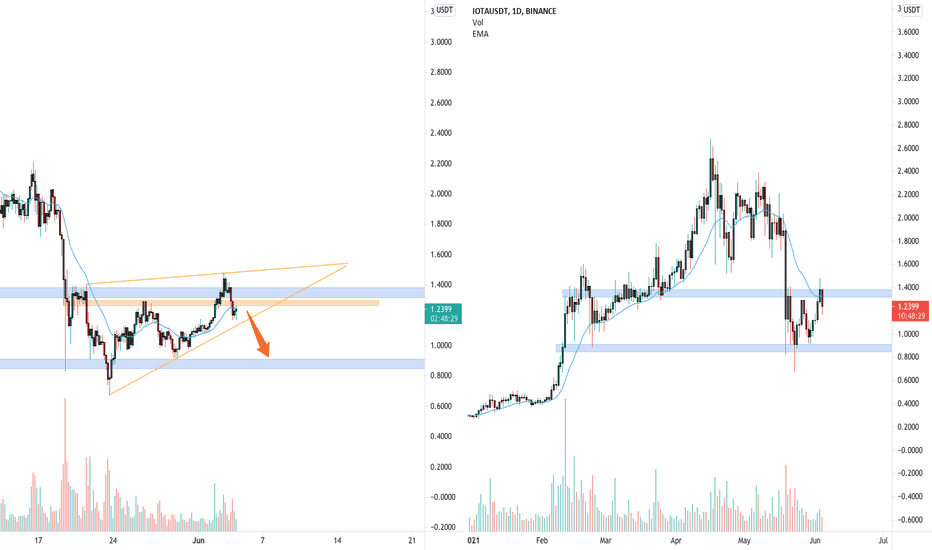
IOTAUSDT wants to retest 1$IOTAUSDT wants to retest 1$ after the price got a rejection from daily resistance. IF the price will have a breakout from the rising wedge, According to Plancton's strategy (check our Academy), we can set a nice order
–––––
Follow the Shrimp 🦐
Keep in mind.
🟣 Purple structure -> Monthly structure.
🔴 Red structure -> Weekly structure.
🔵 Blue structure -> Daily structure.
🟡 Yellow structure -> 4h structure.
⚫️ Black structure -> <4h structure.
Here is the Plancton0618 technical analysis, please comment below if you have any question.
The ENTRY in the market will be taken only if the condition of the Plancton0618 strategy will trigger.
