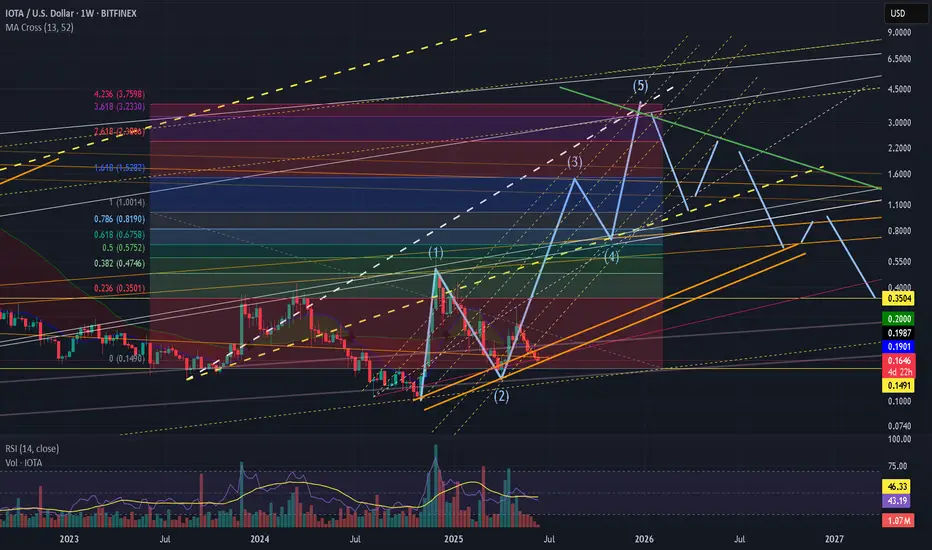
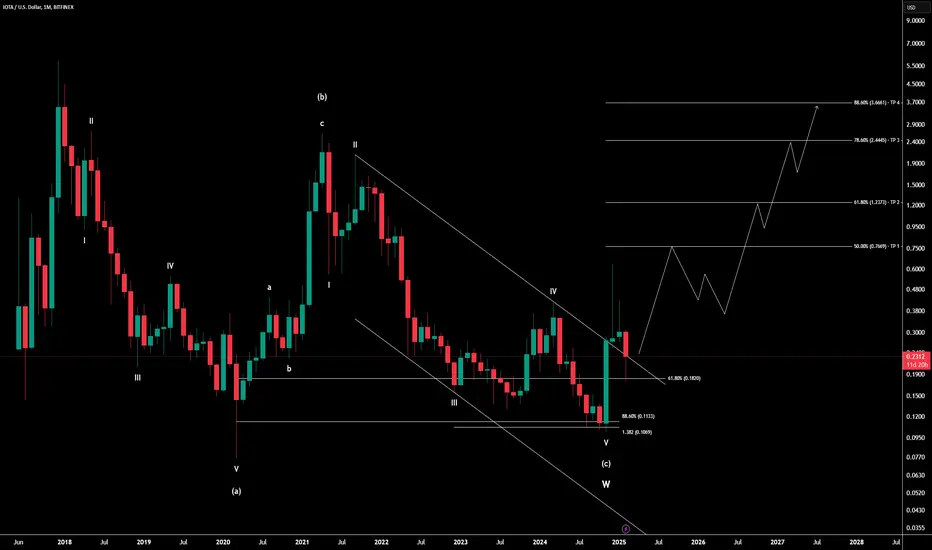
IotaIota's bottoming structure looks better this cycle than last. Accumulation phase almost over and soon we start Wave 3 of 3. Expecting a rapid price increase to $.80 area and a top for wave 5 of 3 at around $1.5. After reaching this target we should see a longer correction, around 2 months for
Key stats
Related pairs
IOTA/USDIOTA has recently experienced a downward trend, with its price facing consistent resistance and struggling to maintain previous support levels. Market sentiment around IOTA weakened as broader crypto uncertainty and reduced activity in the ecosystem contributed to the drop. The decline was also acco
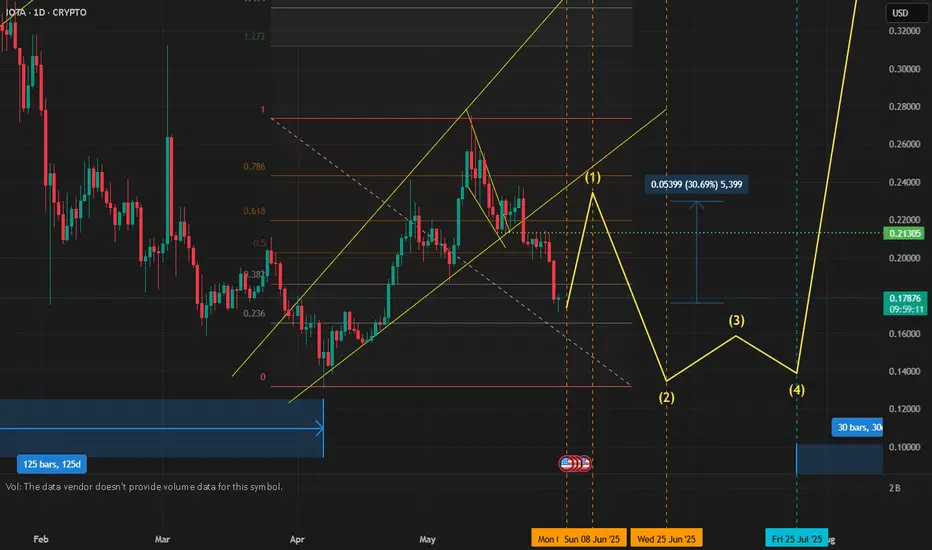
IOTAUSD Channel Up eyes +45% bullish leg.IOTAUSD is trading inside a Channel Up, which is the bullish pattern that took it above its 5 month Falling Resistance, essentially the trade war correction.
The 1day MA50 is providing support and the 1day MA200 is already broken, which signals bullish extension.
The Channel's previous bullish leg

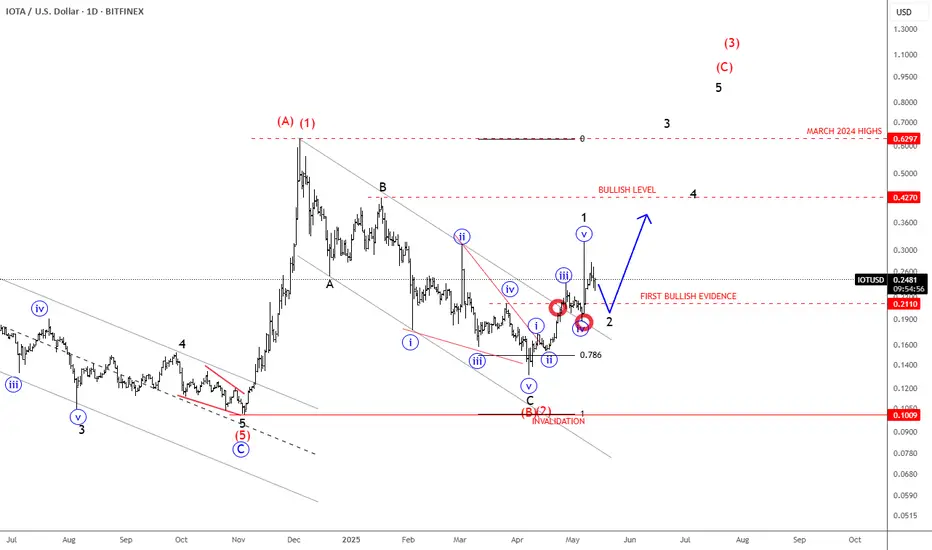
IOTA Could Be On The Way Back To December 2024 HighsIOTA with ticker IOTUSD made sharp and impulsive rally at the end of 2024, which we see it as a first leg (A)(1) of a bigger recovery in minimum three waves (A)(1)-(B)(2)-(C)(3). Since the beginning of 2025, Crypto market slowed down and IOTA made a deep retracement, but in three legs ABC with an en
otausa sell orderItaúsa has a strong focus on investing in brands that contribute to Brazil's economic growth. If you have any specific questions about its trading strategies, investment philosophy, or anything else, feel free to ask! 😊
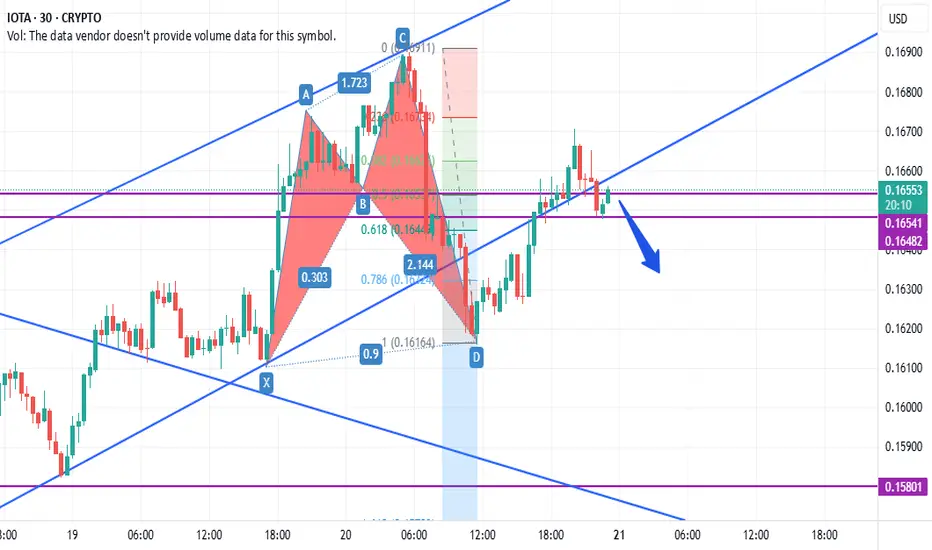
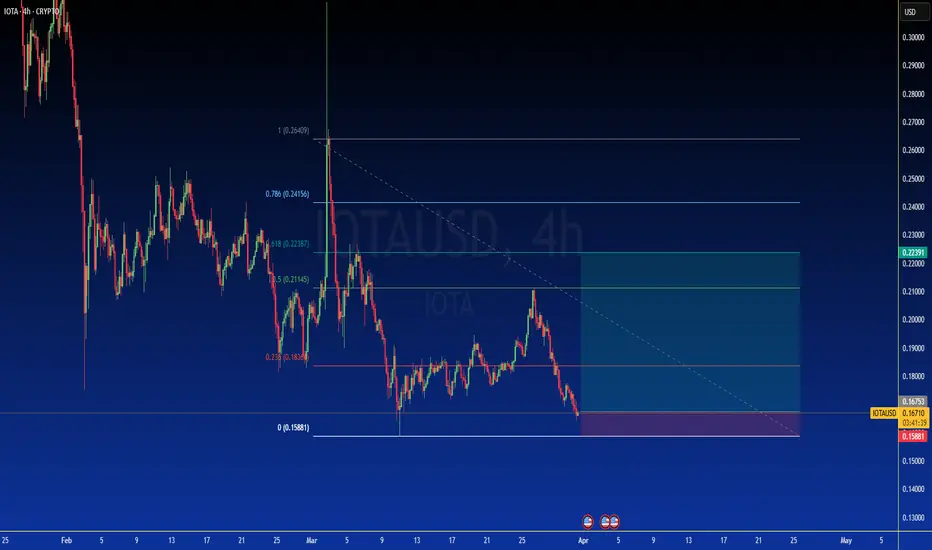
IOTAUSD - 4H Timeframe: Long Position OpportunityKey Observations:
Price at a Strong Support Zone:
The current price is at 0.16754, which is within a well-defined support zone between 0.15881 and 0.1850 (blue shaded area). This zone has acted as a significant support in the past, particularly in early March, where the price bounced multiple times.
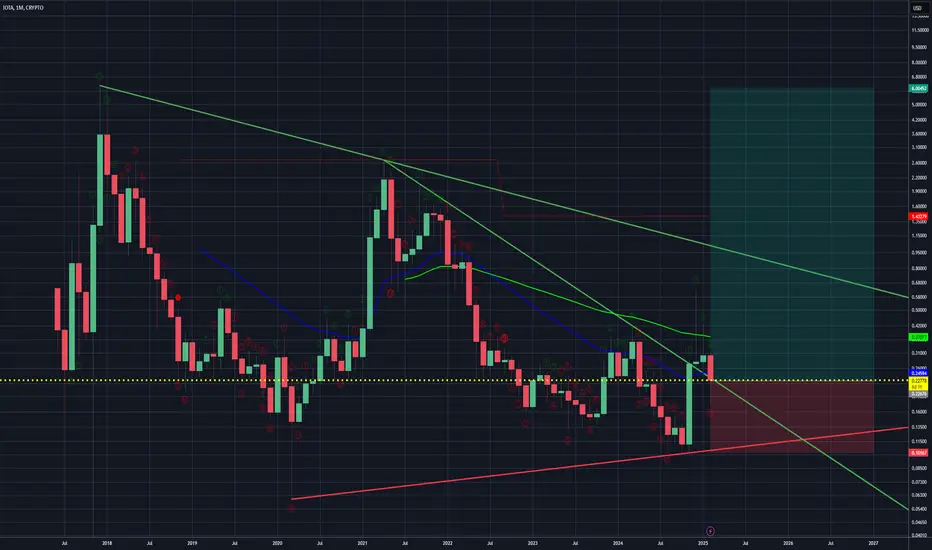
Something big about to happen with IOTAWe have a got a very long accumulation zone, patterns seem to be repeating within a bigger structure (everytime rejecting the downtrending restistance).
It's poised.. If it breaks the pattern we will see a HUGE swing upwards.. projecting 7 - 11 dollar or beyond.
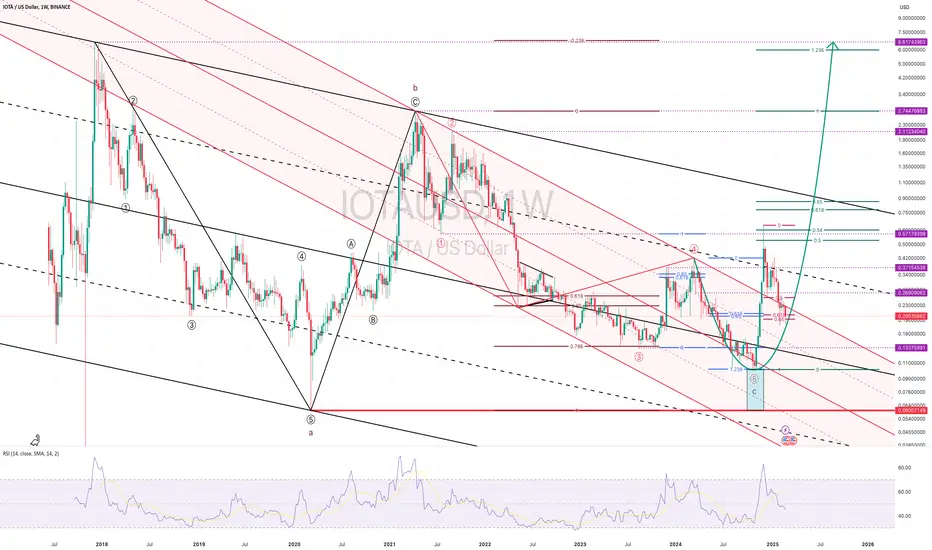
Miota ($IOTA)Weekly TF Elliott Wave Crypto Analysis FIB TCAnalysis of the IOTA/USDT Weekly Chart Using Elliott Wave Principle
Overview & Key Elements
The chart represents the IOTA/USD pair on a weekly timeframe with Elliott Wave structures, Fibonacci retracements, and channel trends.
Key observations:
• completed five-swing downtrend.
• corrective wa
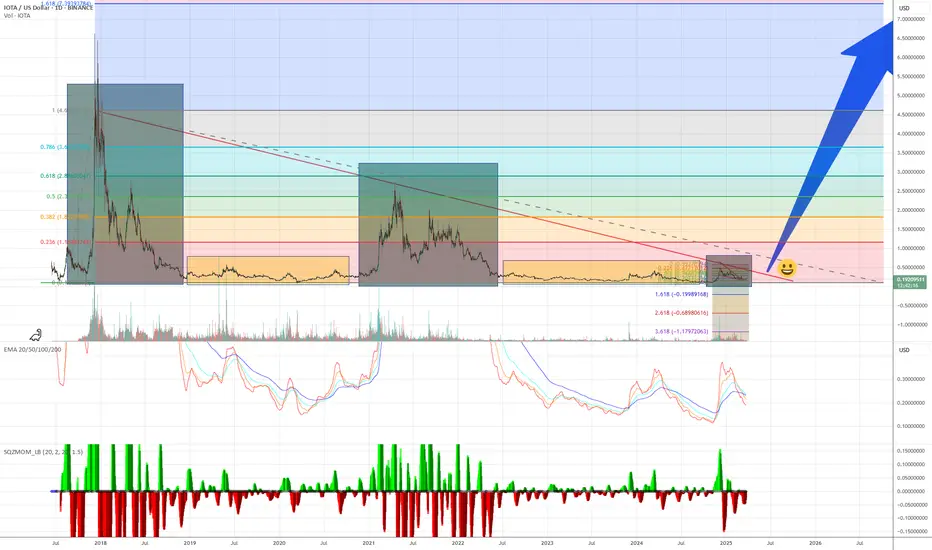
IOTA’s 3-Year Downtrend Nearing Exhaustion – 20x+ Incoming?IOTA has been in a brutal downtrend since January 2022, but the TD Sequential is about to print a Red 13 on the monthly chart, suggesting this 3-year cycle is nearing exhaustion.
Price action has already broken above the long-term trendline (since April 2021), retraced, and now looks to be bouncing
IOT/USD (Iota): Massive Pump Coming +1400% PotentialThis Elliott Wave count is clear and simple, it's a large corrective Zigzag pattern (5-3-5) which is likely that it's already complete due to the large monthly candle of Nov 2024 and the break of previous market structure highs and channel.
This setup also lines up with my other idea that we're no
See all ideas
Displays a symbol's price movements over previous years to identify recurring trends.
Frequently Asked Questions
IOTA (IOT) reached its highest price on Mar 31, 2022 — it amounted to 0.9474 USD. Find more insights on the IOT price chart.
See the list of crypto gainers and choose what best fits your strategy.
See the list of crypto gainers and choose what best fits your strategy.
IOTA (IOT) reached the lowest price of 0.0129 USD on Sep 9, 2023. View more IOTA dynamics on the price chart.
See the list of crypto losers to find unexpected opportunities.
See the list of crypto losers to find unexpected opportunities.
The safest choice when buying IOT is to go to a well-known crypto exchange. Some of the popular names are Binance, Coinbase, Kraken. But you'll have to find a reliable broker and create an account first. You can trade IOT right from TradingView charts — just choose a broker and connect to your account.
You can discuss IOTA (IOT) with other users in our public chats, Minds or in the comments to Ideas.