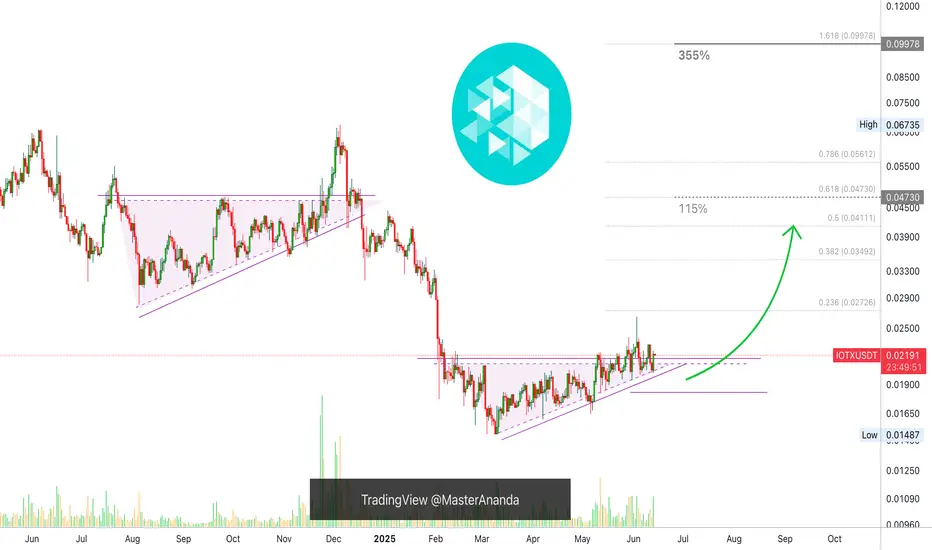
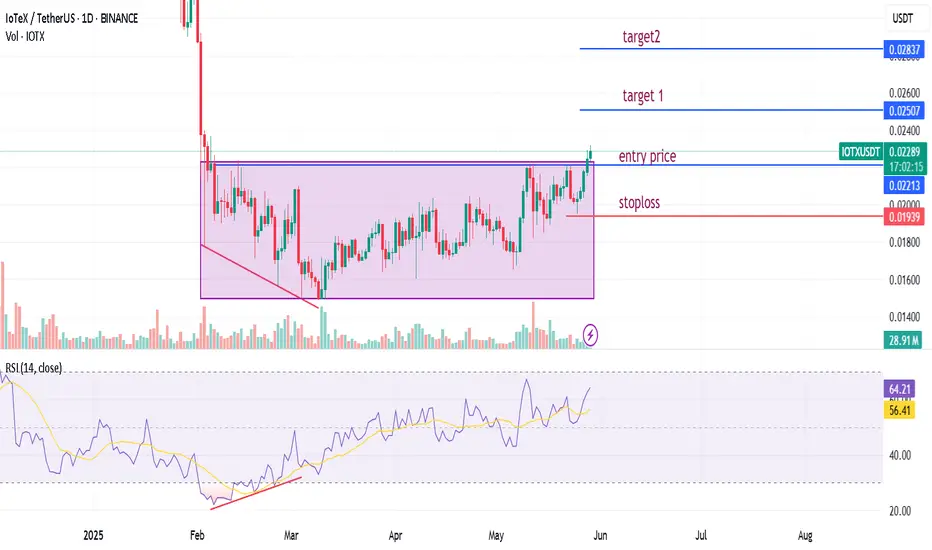
IoTeX 4 Months Bottom Consolidation, Time To GrowThis is one of the best types of chart setups, very low risk and a high potential for reward. Let me explain.
IOTXUSDT hit bottom mid-March, after this bottom, it has been consolidating bullish for more than three months. If we take the drop produced in early February as the start of the consolidat
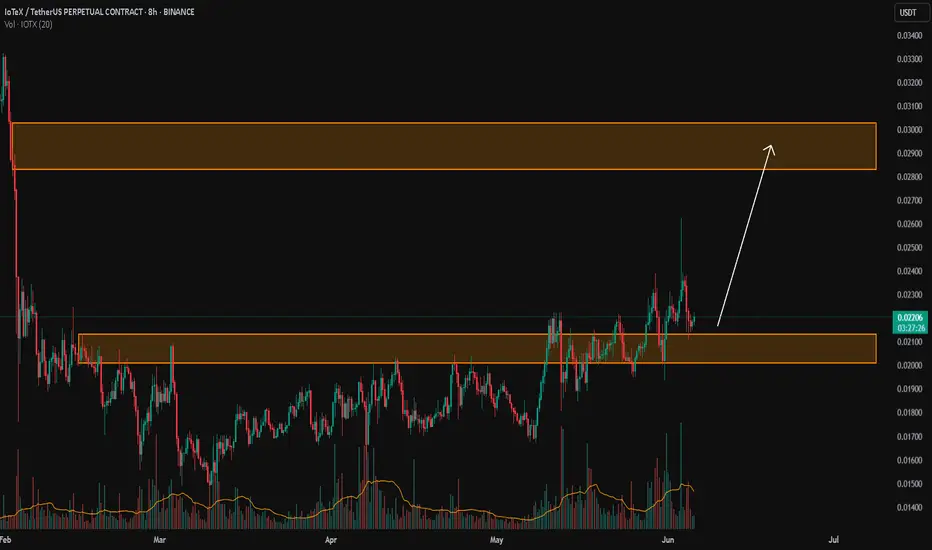
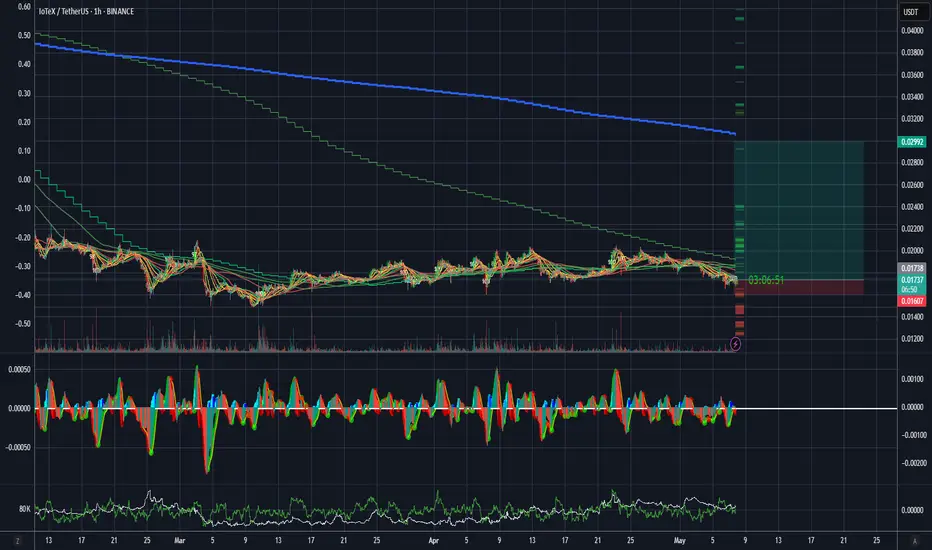
IOTX/USDTKey Level Zone: 0.02010 - 0.02130
HMT v8.1 detected. The setup looks promising, supported by a previous upward/downward trend with increasing volume and momentum, presenting an excellent reward-to-risk opportunity.
HMT (High Momentum Trending):
HMT is based on trend, momentum, volume, and market s
IOTXUSDT🚀 IoTeX (IOTX): A Hidden Gem for Short-Term Gains & Long-Term Growth?
Looking for a crypto project with real-world utility and strong upside potential? IoTeX (IOTX)—a decentralized platform powering the Internet of Things (IoT)—might be worth your attention.
Why IoTeX?
✔ Innovation Meets IoT: Comb
IOTEXUSDT is bullish in 1d as it broken rectangular boxIOTEXUSDT is bullish in 1d as it broken rectangular box and also printed bullish divergence
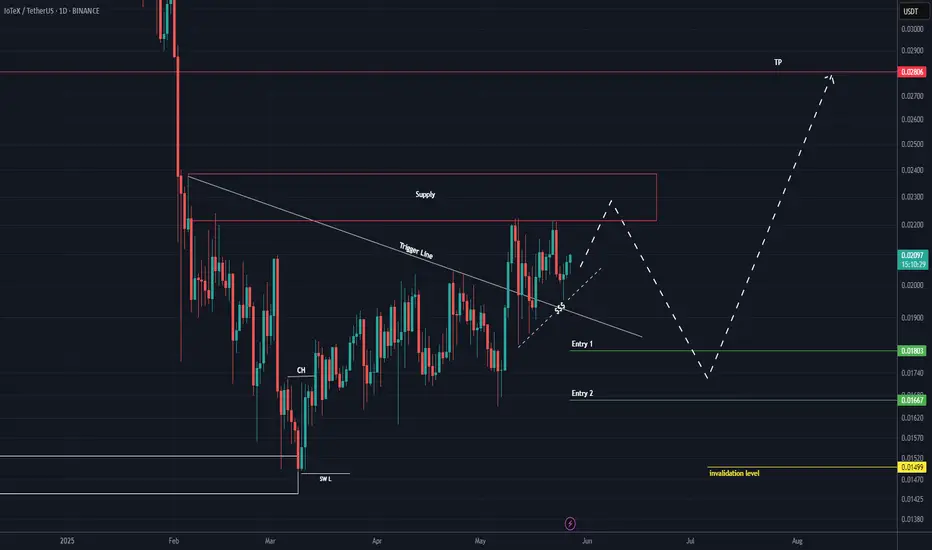
IOTX buy/long setup (1D)An important trigger line has been broken, and the price has been moving sideways for a while.
There is also a bullish CH on the chart.
It is expected that the price will make a pullback to the support zone and then move toward the supply zones higher on the chart. We are looking for buy positions
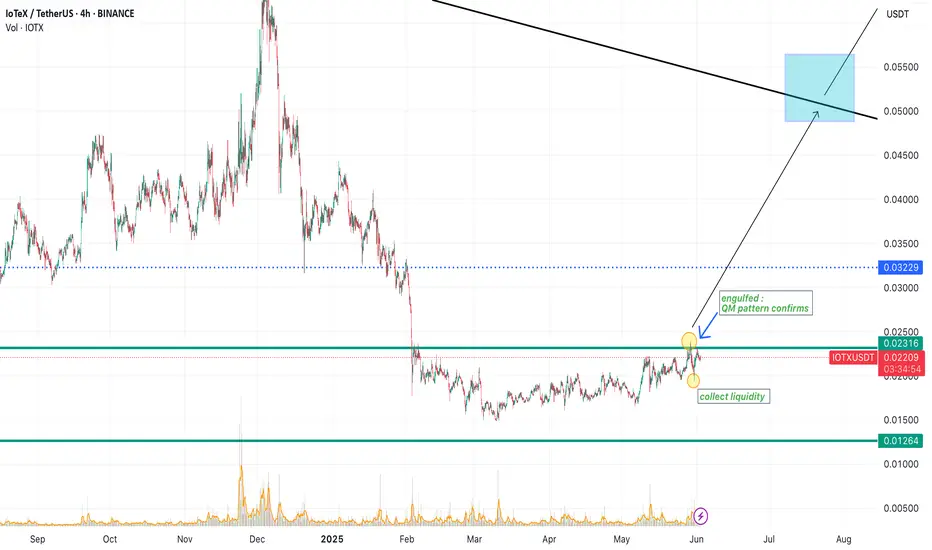
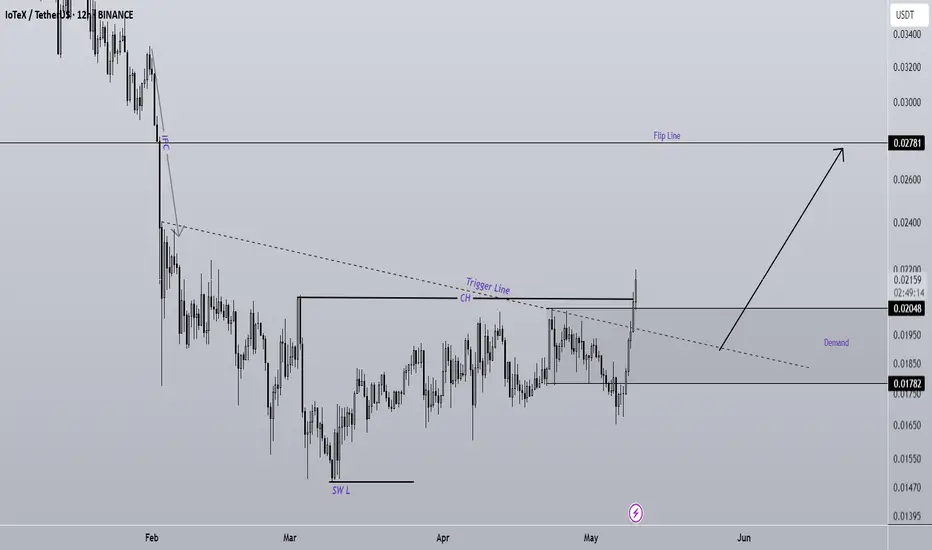
IOTX Is Still Bullish (12H)The important trigger line has been broken, and the price has recently formed the main bullish CH (Change of Character).
If the demand zone holds, the price may move toward the flip line.
A daily candle closing below the invalidation level would invalidate this analysis.
Do not enter the position
Is it going to happen? IOTX/USDT Potential upword movment ?While IOTX is currently exhibiting bearish indicators, such as trading below significant moving averages and a bearish MACD crossover, the RSI suggests it is not yet in oversold territory. The increased volume during price dips may indicate accumulating interest at lower levels, potentially providin
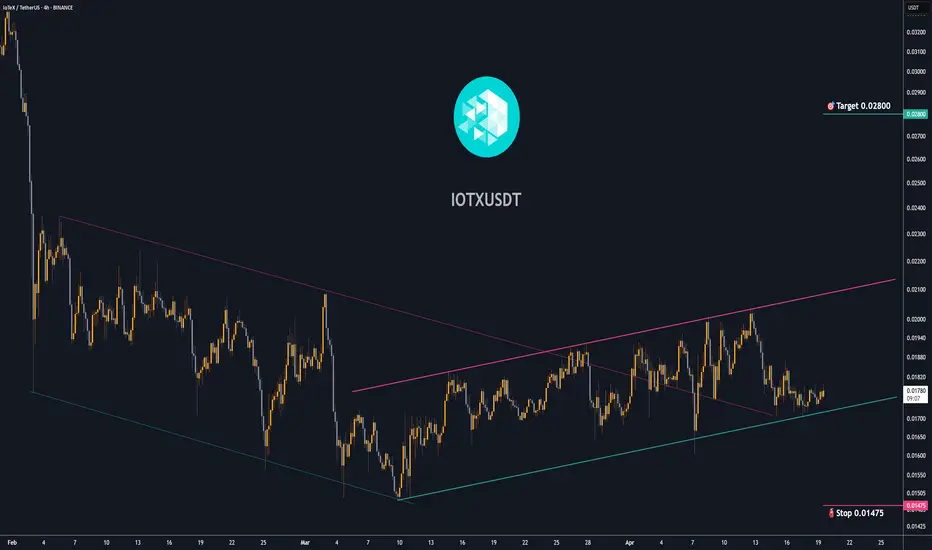
Trading opportunity for IOTXUSDTBased on technical factors there is a Buy position in :
📊 IOTXUSDT
🔵 Buy Now
🪫Stop loss 0.01475
🔋Target 0.02800
📏 R/R 3,3
💸RISK : 1%
We hope it is profitable for you ❤️
Please support our activity with your likes👍 and comments📝
See all ideas
Summarizing what the indicators are suggesting.
Oscillators
Neutral
SellBuy
Strong sellStrong buy
Strong sellSellNeutralBuyStrong buy
Oscillators
Neutral
SellBuy
Strong sellStrong buy
Strong sellSellNeutralBuyStrong buy
Summary
Neutral
SellBuy
Strong sellStrong buy
Strong sellSellNeutralBuyStrong buy
Summary
Neutral
SellBuy
Strong sellStrong buy
Strong sellSellNeutralBuyStrong buy
Summary
Neutral
SellBuy
Strong sellStrong buy
Strong sellSellNeutralBuyStrong buy
Moving Averages
Neutral
SellBuy
Strong sellStrong buy
Strong sellSellNeutralBuyStrong buy
Moving Averages
Neutral
SellBuy
Strong sellStrong buy
Strong sellSellNeutralBuyStrong buy
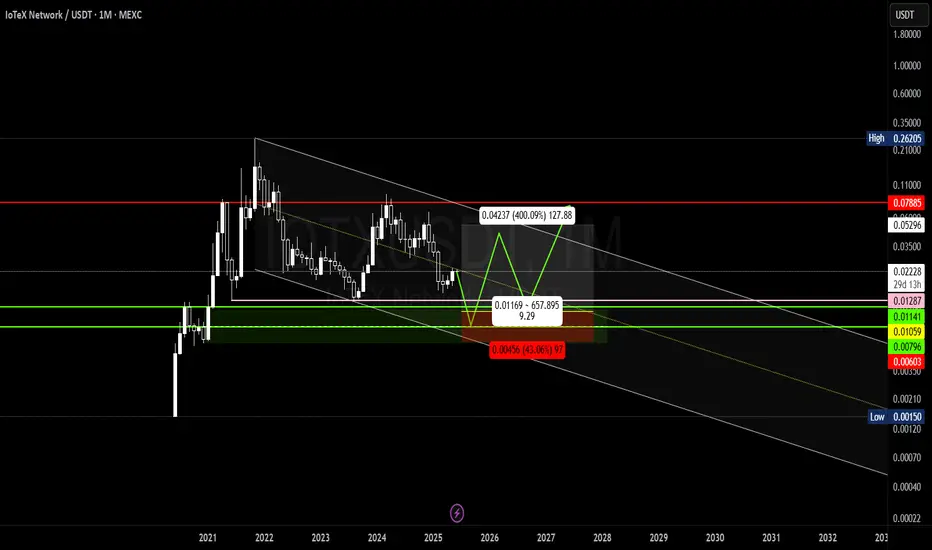
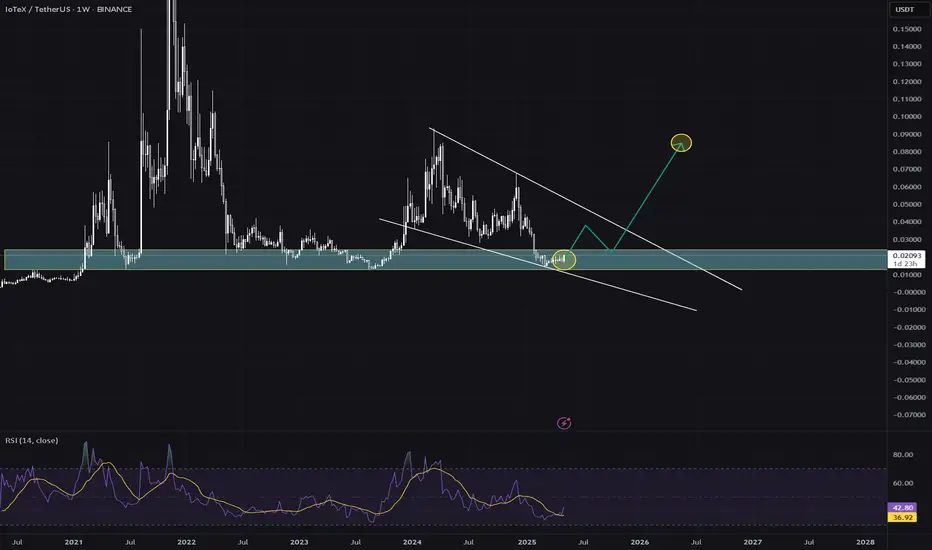
Displays a symbol's price movements over previous years to identify recurring trends.