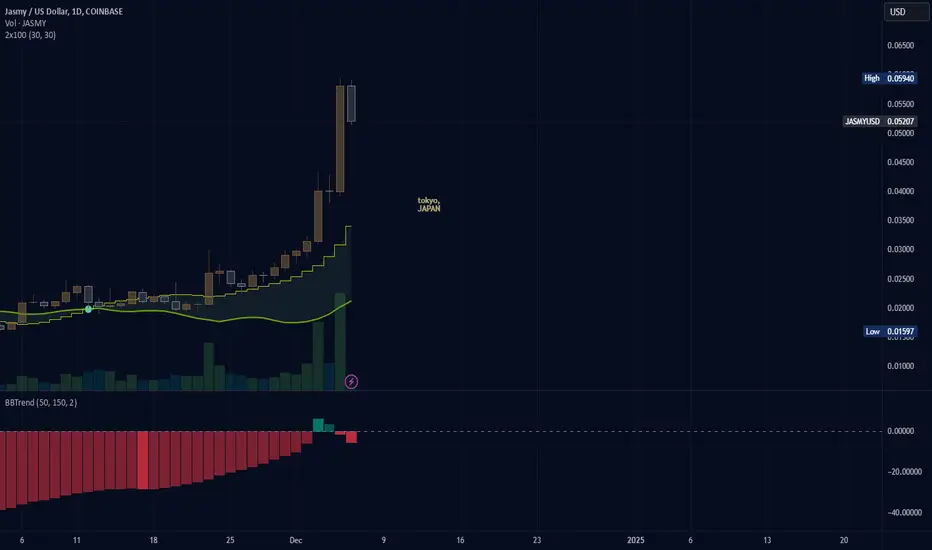
jasmy (JASMY) "INDICATIONS"The BBTrend indicator reveals whether the price is overbought or oversold. Red is too low "oversold" and green is too high "overbought." In this case Jasmy is quite neutral on that fact.
The Yellow stepped line is the 100 Moving Average. When the 100 MA is smoothing out and rounding over this is a sign of the price reversing. As you can see the steps are large and there is no smoothing happening. Also with my 2x100 indicator the waves run between the two lines like a MACD with the 100MA line on top for positive growth and when the smooth green line crosses over the stepped line this is a sign of a reversal as well. As you can see the recent price increase is therefore sturdy based on these two indications.
JASMYUSD trade ideas
Any Jasmy fans in the house?Been a long time since I did any sort of analysis on Jasmy. But the devs did their jobs. Bled their wallets right into a long accumulation period and now that most of retail is gone after losing it all, here comes big money to buy it all right back. Classic!
Target on this C&H is 8.4-8.6 cents.
✌️ Stew
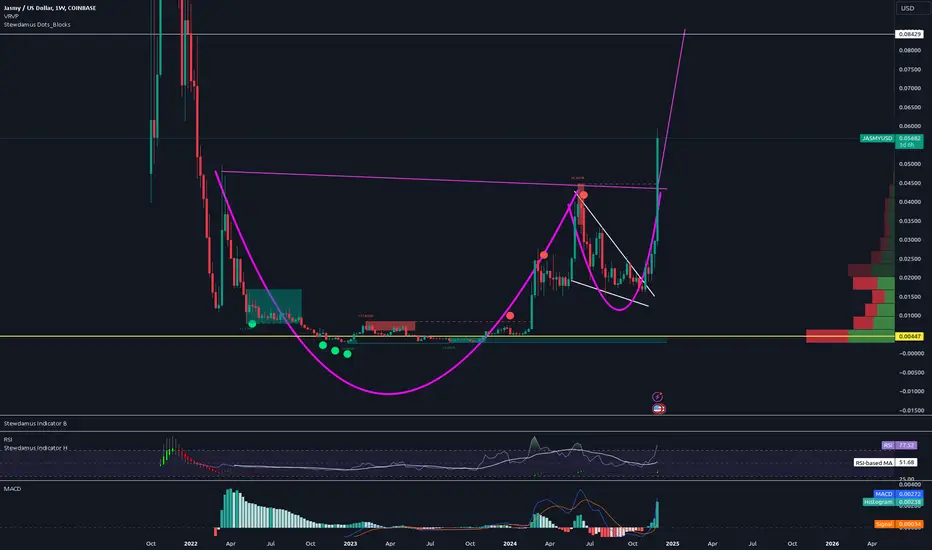
JASMY (JASMY) "True Path"Since creating my indicator months ago I have never seen any crypto project pass direcrtly through the two dotted blue lines until now with Jasmy today. I referred to the center of the two lines as the black hole of which has too much energy for any crxyptocurrency including Bitcoin and Ethereum to ever cross directly through the center. Quite interesting.
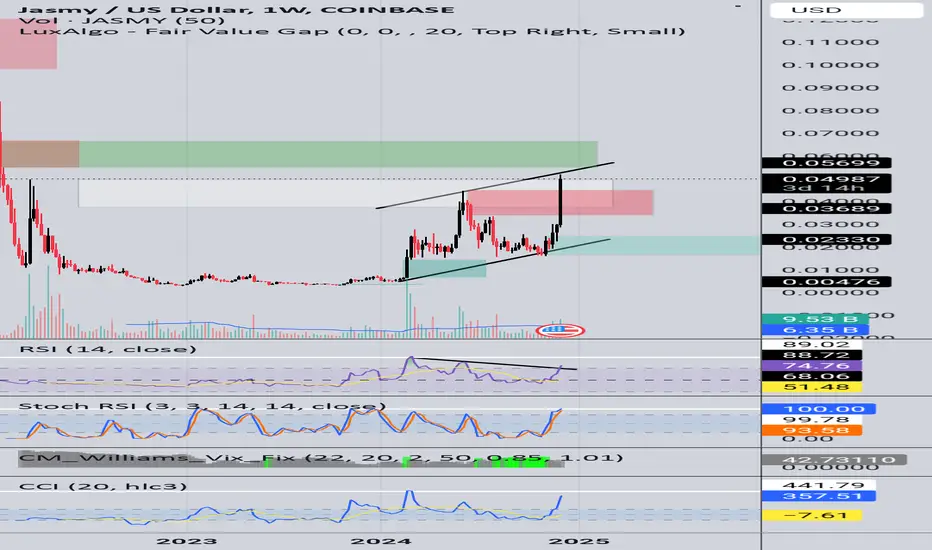
Parallel StructureWow, what a week for the Jasmy Holders. A week of miracles. Crypto is a strange place. Let us turn to the charts. What we know is that Jasmy is in an uptrend. What we know recently is an old wick got filled, and there is a similar area above which could possibly get filled and even though the week candle did not close yet, there seems to be a bearish divergence forming on the RSI.
Also, the weekly candle did not close yet and it is still close to a supply zone.
RSI is 74 but in an uptrend so keep your eyes on the 80 levels and be wary of price reversals.
CCI is in the 300s very overbought but can go up to the 400s before price reversals for this asset
SRSI is in the overbought zone but could stay up there for a few candles for this asset.
Keep your eyes on those indicators and the overbought levels and past reversals. Observe for any break outs in the parallel structure or any price reversal.
Let's hope we get no 'Wicky' candles or overly bearish candles, you Jasmy holders work hard all the best stay safe and encouraged, let's hope for another miracle.
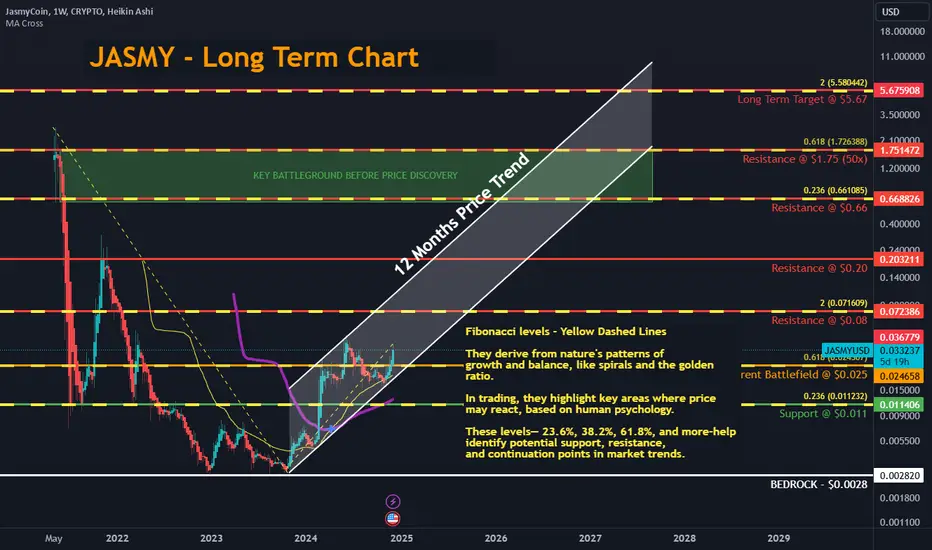
JASMY Levels of Support and ResistanceJASMY has had a solid 12 months of growth, being up over 1200% from the bedrock price of $0.0028.
Key levels below the ATH are
$0.025 which is the current battleground, it is currently using it as support, but no reason it won't drop below that level until it consolidates above $0.08.
$0.08 will likely be the next pump target which is a nice 1x return
$0.20 represents the next key level of resistance as the price 3 years ago (NOV 2021).
$0.66 is a key Fibonacci level (0.236) on the way to the $1.75 resistance.
Anything above that is price discovery.
LONG TERM - Before 2030
The only target that makes sense on the weekly above that is the 5.58 Fibonacci level, but that $5.67 target would be next cycle.
Hope?Jasmy over the past few months have been making HHs and HLs, Jasmy holders nearly had a scare because on the monthly chart there nearly was a head and shoulders forming but hopefully November's 2024 Candle will stop that pattern. Tomorrow we will confirm if Novembers candle will be bullish, if it is we will have a break of the short term trendline which will show positive price action for Jasmy. Also the CCI indicator is at a positive level. The SRSI looks like it may repeat the prior months pattern with it's bullish crossover. Let us hope Jasmy forms a long-term upward trendline. But we must be careful November's Candle did not print yet and this is crypto.
Thank you for your time.

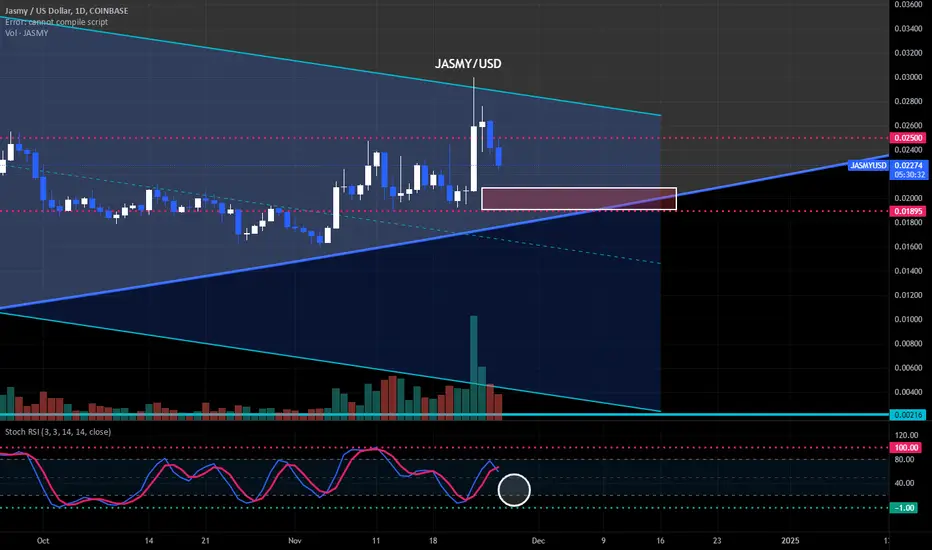
Jasmy Pulling Back SEED_DONKEYDAN_MARKET_CAP:JASMY clearly showing a healthy pullback after that bullish pennant it broke out of a few days back. Jasmy should pullback to an initial target of $0.021 - 0.01895 and it should hold there to form new support. We should expect some slight consolidation before the next leg up. Bitcoin also taking a breather before the powerful break and move thru $100k. I will update as needed, stay strong and hold, JASMY will melt faces in the upcoming weeks and months.
Short Term Target = $0.02100 - 0.01895 :)
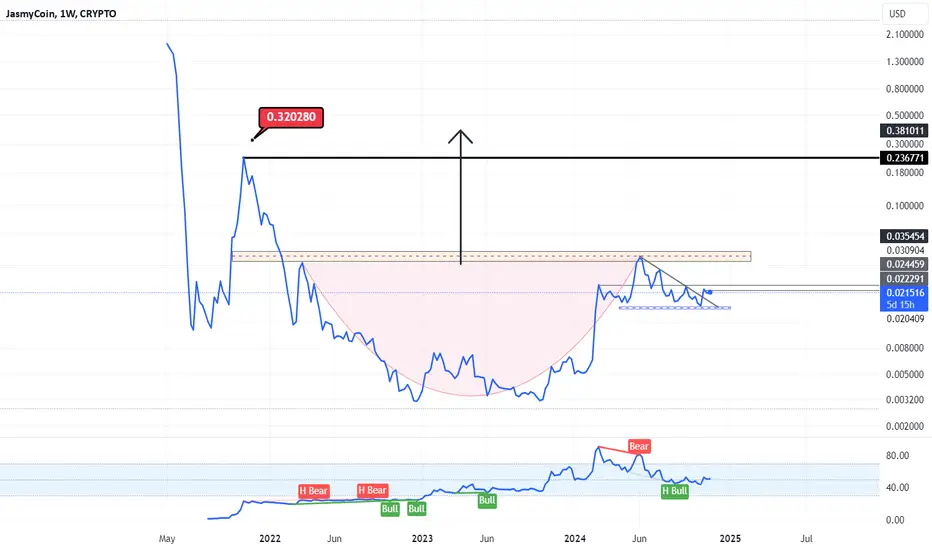
$JASMY Heating Up for TakeoffWe are looking at a beautiful Cup & Handle formation within the SEED_DONKEYDAN_MARKET_CAP:JASMY price action. This project will be melting faces, Jazzy ( SEED_DONKEYDAN_MARKET_CAP:JASMY ) is currently working in a paralell channel/flag trying to break out of that channel breaking 0.02780 and heading towards the next resistance of $0.04 - 45. Once Jazzy breaks 0.04 and closes the body of a weekly candle above 0.04 we should see no resistance to $0.10
1st Target = $0.04 - 45
2nd Target = $0.08 - .10
Will update as needed 📝🤓
I'm holding a large bag of SEED_DONKEYDAN_MARKET_CAP:JASMY and do NOT plan to sell until 2025 💥🔥🔥🚀🌙💪🏼

Jasmy, aiming for that cup and handleHello, ive got no idea where Jasmy is going but im going to put a alarm on the 0.5 fib. From there i buy in and got a amazing target at 0.73. Trade save and let me know what you think

$JASMY Bullish PennantLooks like light at the end of the tunnel, SEED_DONKEYDAN_MARKET_CAP:JASMY currently forming a Bullish pennant with intentions of breaking the $0.0250 resistance. Once Jassy breaks 0.025 it will head to 0.04 some short consolidation and blast right to $0.08 which shpuld hold more resistance. Jasmy is a sleeping giant with excellent tokenomics, im holding 1million strong, back up the truck and load up! 💪🏼💥💥🔥🔥🚀🌒📈

cup and handle in jadmy coinas shown in the chart its clearly the cup and handle pattern
the handle descending trend line is broken
please notice that you can open your position with maximum leverage 3x!!!! (do not greed)
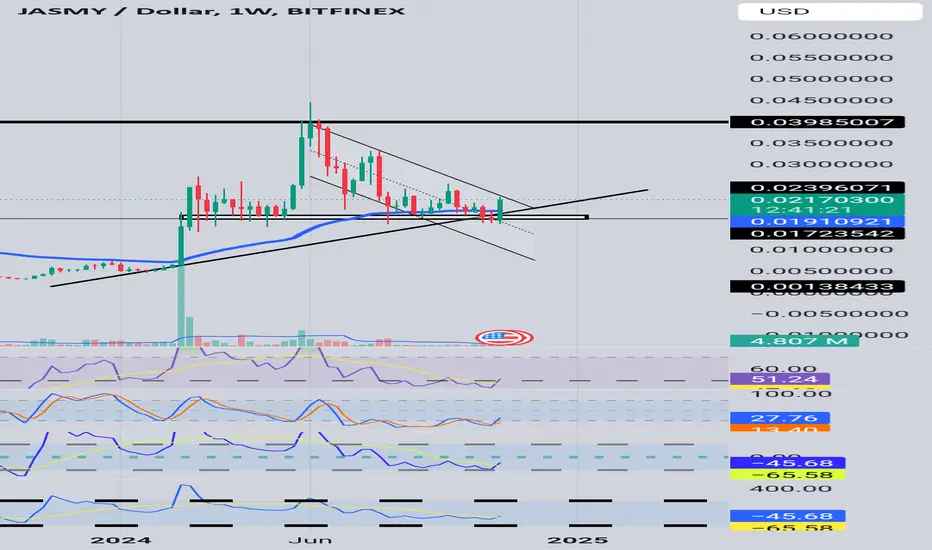
Triangle WeeklyPlease be careful on the weekly, Jasmy has appeared to form a descending triangle, please watch out for direction of break out. Even though in trading literature, descending triangles tend to have bearish break outs, please look at the chart and see the bullish breakout of the last descending triangle.

Jasmy 12 TFJasmy on the 12 HR TF, survived a red candle and still in the upward parallel channel, it would be very nice if we can get strong price action away from the 21 EMA. Let us wait for the candle to print.

Upward Channel or Head and Shoulders?Jasmy on the day chart has formed two long wick candles above the 50 EMA and on the 50 % Fib level. It would be nice if Jasmy makes and upward channel and cycles up but that is subjective at this time and one could say Jasmy is going to form a head and shoulders and fall out the channel. It would be nice for price movement to make an upward channel movement, and move up from the 50 EMA and 50% Fib level with a bullish cross over on the SRSI. We must see what today candle prints and be very alert and careful.
Correction how long?Jasmy has a bullish set up forming on the 12 hour TF, RSI levels are healthy. After a long wick candle (it is not printed yet)but a bullish engulfing candle may be forming on a key level near the bottom of an upward channel. Bottom indicator stop flashing hinting possible reversal in price. Be very careful.

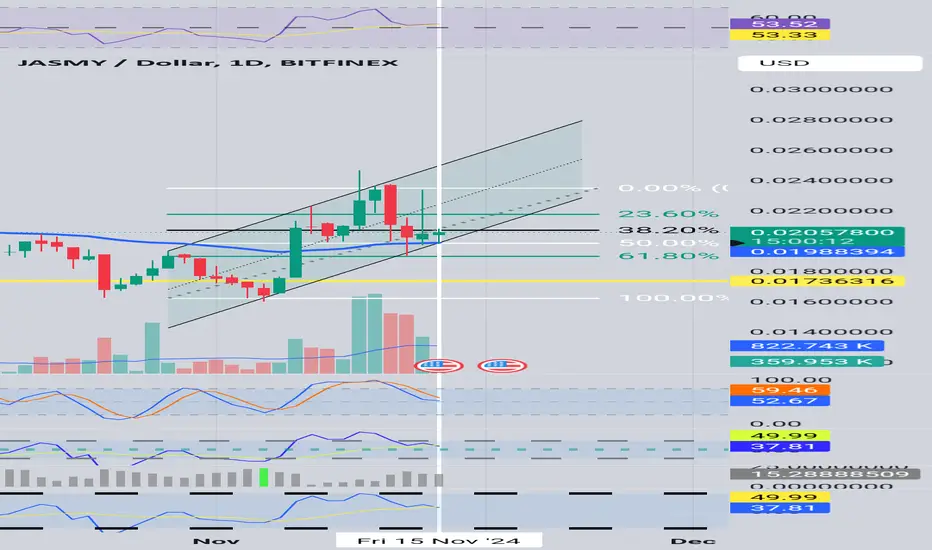
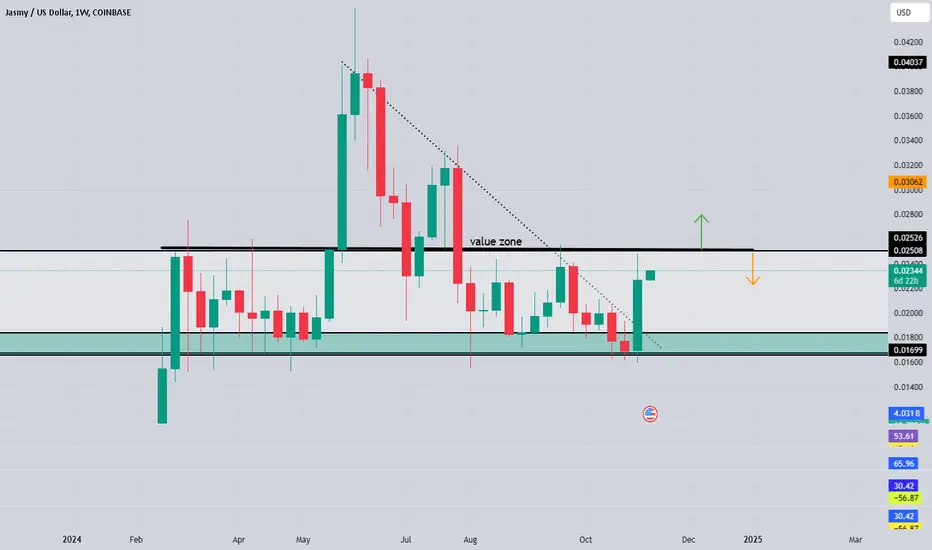
Another hurdle With all the Euphoria can Jasmy break out the Value Zone, the good news is that with the most recent candle it broke out of a downtrend with a bullish engulfing candle, but it is less than 10 percent away from clearance from breaking out the Value Zone. Another exciting week for Crypto!
Jasmy possibly may glowCan Jasmy break out of the downward parallel channel, or is this an euphoria run.
Positives- Good SRSI and RSI readings
Green bullish candle forming on 50EMA and on key level
Negative- needs to break out of downward parallel channel. Global and local and geopolitical affairs, how long will this euphoria last in the market?

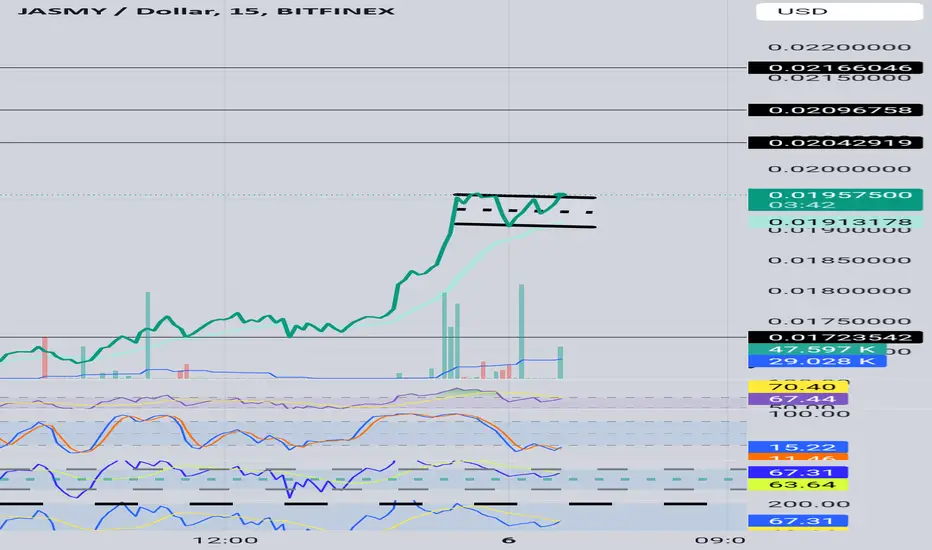
Possible break out?Nice parallel structure forming, and accumulation happening around 21 EMA on 15 Min Chart. Double bottom possible. Let's hope for a nice bullish price movement. Observe that Jasmy temporarily is in an uptrend and SRSI is in the oversold zone. Let's hope for a break out.
Markets volatile and election week please be careful.

JASMY room for possible growthRisky play here
It seems like Jasmy may break out it's downward triangular structure which would be good news for Jasmy Holders.
SRSI and RSI levels look decent.
Chance of a bullish MACD crossover.
Paper Trade if you must very safely.

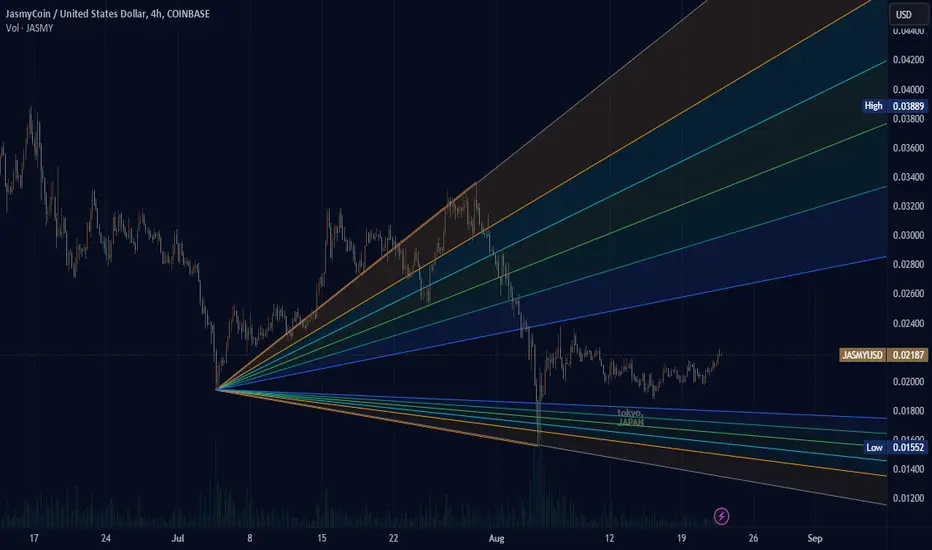
JASMY jasmy "wedge view"This is the wedge view for Jasmy based on 100 day and 50 day past moving averages trajectory leading up to Nov 1st 2024. The range anyway. This does not mean the price is subject to necessary stay within the boundaries of the purple lines drawn as much as the projected outcome for the price in a variable sense according to today from the indicator I use. Obviously, BTC movement seems to always impact the rest of exchange traded cryptocurrency tokens or coins so when the price of BTC fell so did everything else. Seems like a cop out for the price of cryptocurrency trends to always fallowe BTC necessarily considering how indicators should in some ways tell a different story for different cryptocurrency.

(JASMY) jasmyCurrent trajectory for Jasmy using a previous shape to plot to fan assist tools, one on top and one on bottom, from the two fans creates a gap in the middle where the trend of Jasmy appears to visually chart its price.