(JASMY) jasmySome sort of anomalous glitch is happening with my indicator. I am seeing doubled lines. I have never seen this on any cryptocurrency, ever.
JASMYUSD trade ideas
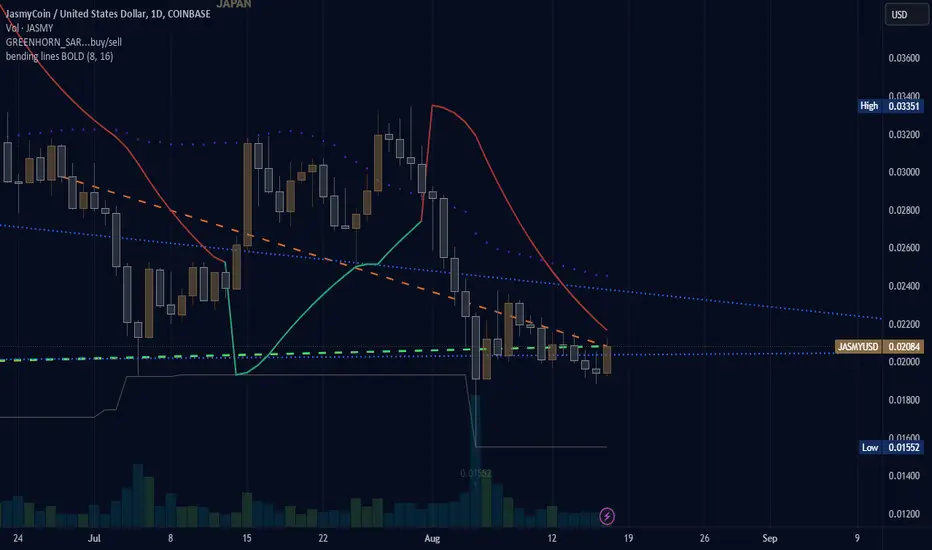
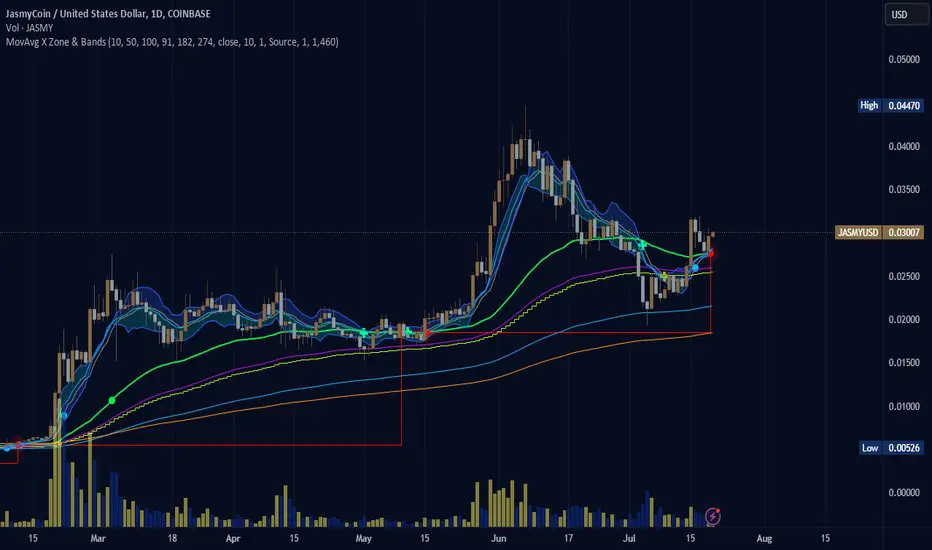
(JASMY) jasmy Is now a good time to buy? The price is awfully close to turning over to the green side. If the line goes green the price could have a small surge increasing the price of Jasmy. I remain along the sentiment that Jasmy is gaining in price, not losing.
Jasmy Weekly Hidden Bullish DivergenceSEED_DONKEYDAN_MARKET_CAP:JASMY has a confirmed hidden bullish divergence on the weekly chart. There is a also a case to be made for a double hidden bullish divergence, although the previous one may have already played out.
Hidden bullish divergences are more effective than regular divergences because they are a trend continuation signal. The hidden bullish divergence shows us that even though RSI made lower lows, the price held the gains made in previous sessions (higher lows). In other words: RSI has reset to lower levels, while price is higher, which means the RSI has more room to run up from a higher starting price point.
Looking at the broader market, we can say that crypto is still in a bullish uptrend, which only adds to this signal's strength.
As a general rule of thumb; the longer the timeframe, the more significant the signal. The weekly timeframe is a LONG timeframe, so this confirmed hidden bullish divergence for #JASMYUSD can be considered as a very strong signal to go long or to add to your long-term spot positions.
Furthermore, there is a case to be made for a clear corrective A-B-C structure since the recent highs around $0.044. If this is the case, than expect #JASMY to run hard and fast once the market regains strength.

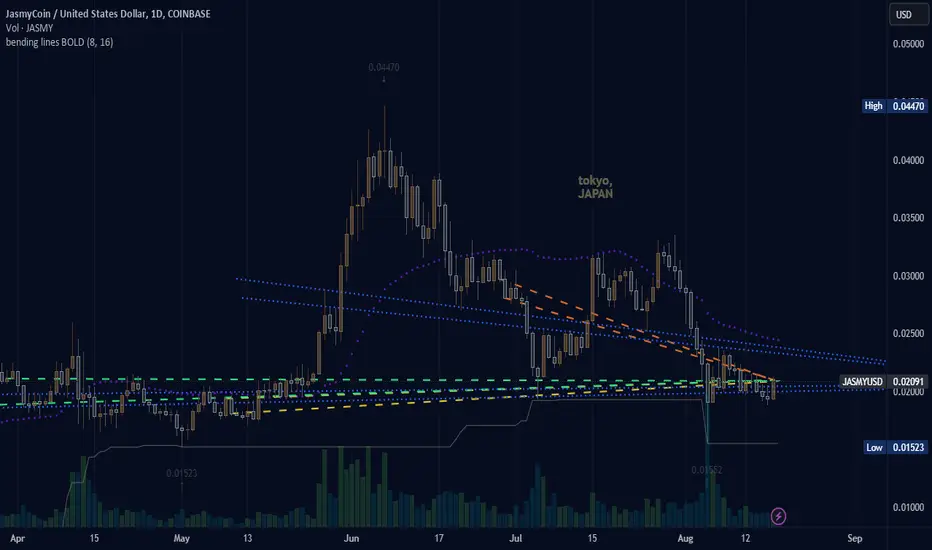
Is JASMY done? Taking a look at the daily chart, we see JASMY has been in a down trend (lower highs and lower lows) since the beginning of June falling back into this consolidation range where it was bound for 3 months during February - May. The fact that price has made a complete retracement of the breakout and back into the old consolidation channel, testing its low, is not a good sign to me.
The yellow lines on the chart represent the consolidation's boundaries with the top acting as strong resistance and the bottom now acting as strong support again. There's an intermediate level that acts as support/resistance around the .021 area.
The selloff on Monday, August 5th had substantial volume (last time we had that high of a volume was in February) which indicates to me that a large amount of coins were sold that day and people were taking their profits or getting out of their positions.
Moving forward, I would expect price to be bound within the range of this consolidation channel and if it breaks below it, the next support zone I see is around .012 - .013.
If price makes its way down to .015 - .016 again and consolidates there, it could be a great opportunity for a long position as that level is extremely strong. But, I need more data supporting that thesis before considering an actual entry.
Good luck to you all.
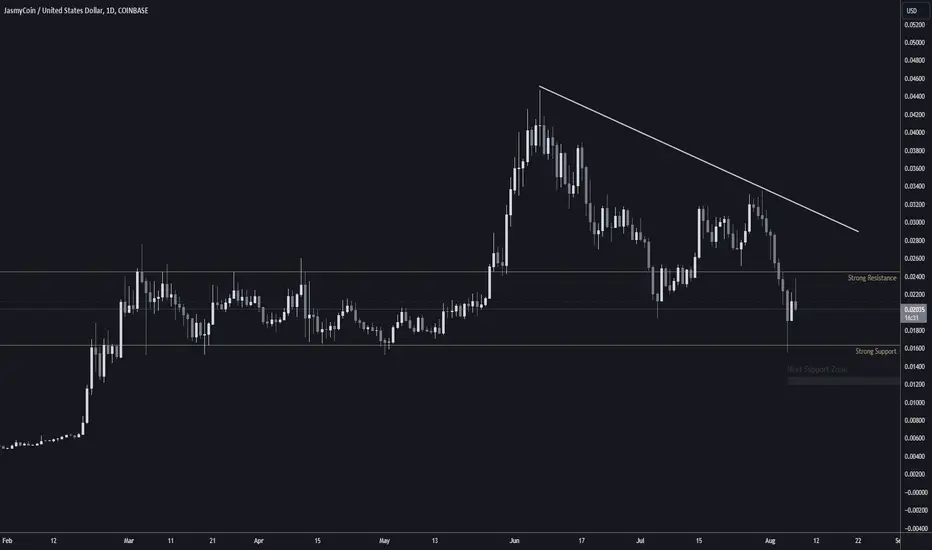
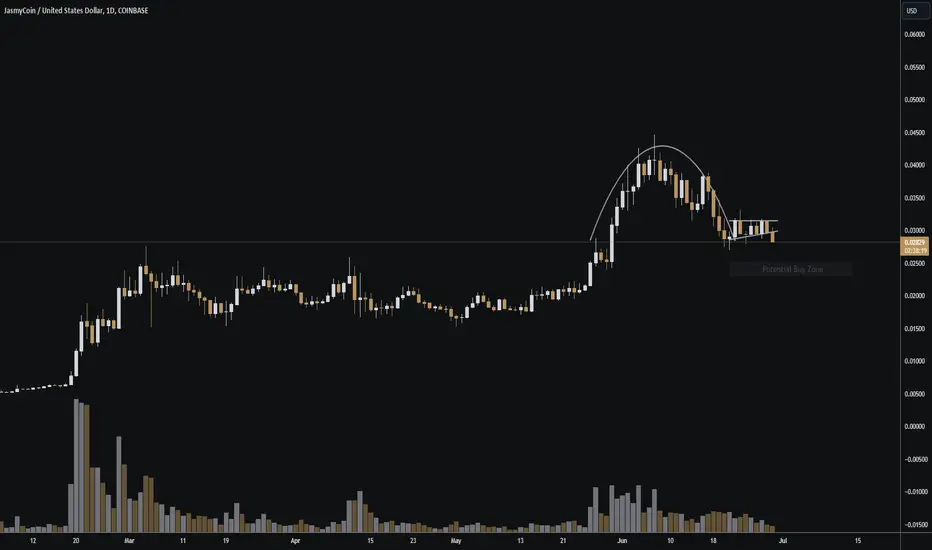
JASMY breaking down? Where to buy?As you can see on the daily chart, JASMY is continuing its way down. It looks like an inverted cup and handle with current price breaking below the handle and retesting it.
If further downside occurs, I will expect price to trade within the marked Potential Buy Zone which happens to be around the top of the previous consolidation's range.
I will continue to monitor price and look for opportunities in the PBZ if price makes its way there.
What do you think? Do you agree or disagree? Are you bullish or bearish? Why?

(JASMY) JASMYI think there is some hope that the price remains inside the triangle. No surprise the price fell along with other cryptocurrencae. The changing trending lines show the price remains in a strong pattern with potential to recover in price (50 day, 100 day sentiment)

(JASMY) Jasmy Check it out, I figured it out. I changed the color on the top, but not on the bottom. Two color one indicator parabolic with james bond 007 settings. #UkraineN64
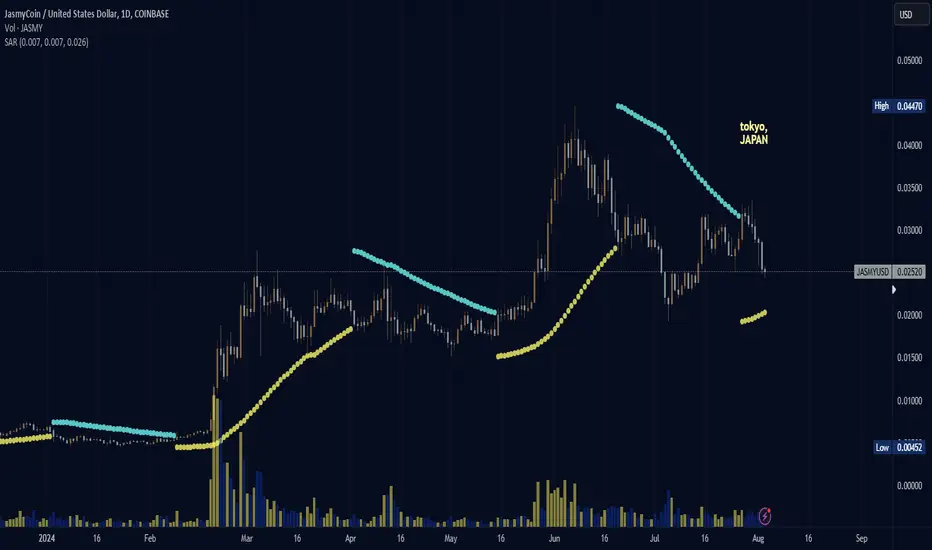
jasmy (JASMY)CLASSIC PARABOLIC "BOND" VISION. Price is up. Tweak to the parabolic indicator while trying to find a way to do a custom concept. Getting closer.

Why Jasmy Faces A Bearish Outlook & How It Can Flip Bullish!JASMY Update — Why Jasmy Faces A Bearish Outlook, 0.027 Must Hold, And How It Can Flip Bullish!
In this post, we examine JASMY using the Ichimoku system. We discuss crucial areas, the challenges JASMY faces, and what needs to happen for it to continue being bullish. Let's get into it!
1️⃣ Just recently, JASMY flashed a bearish Tenkan/Kijun crossover (1). Such a crossover usually indicates the beginning of a bearish trend. However, it is worth mentioning that a bearish crossover above the cloud is considered a weak signal.
2️⃣ In addition to the above, the future cloud (2) has turned red. This is an additional signal that JASMY faces a bearish momentum.
3️⃣ Currently, JASMY is trying to stay above Span B (bottom line of the cloud, 3). This line often acts as strong support.
Possible Scenarios 👇
The most important level to watch is whether the price bounces off the support line or breaks out of the cloud to the bottom.
🔻A breakout to the bottom would flash a third bearish signal and massively increase the likeliness of further downward potential. In this case, the next support lies at 0.021.
🟢 A bounce of the current support must be followed by a cloud breakout to the top. A close above the cloud, followed by a reverse crossover of the Tenkan/Kijun above the cloud, would indicate strong bullish momentum, and JASMY should catapult to a level >0.03 quickly.

JASMY: HIDDEN BULLISH DIVERGENCE (6 CENTS)JASMY reads hidden bullish divergence. Both move-ups took place in 24 days. The third move-up is about to occur because my hidden bull has appeared.
Each move up per 24 days has a higher value.
FORECAST for 8/11 sounds about right.
Why: I'm about to unveil the next 3D TF BITCOIN BULL RUN which takes place before, yet I won't release the date yet. This will surge JASMY.
You must see the hidden bull signals. History shows the BULL is near.
Beware of some delays. Never forget, Whales control the trend.

JASMY (JASMY) Redline appears, red dot formation solidified. When this dot and red line shows up the price most often increases dramatically for one large candle in the following days of the formation of the redline dot.
JASMY (JASMY)Threading the needle. Topside, Bottomside, somewhere inbetween. The line appears to make sense. My screen shifts due to TradingView not recognizing the resolution of my screen while creating the lines on the graph. The line should touch both crossing points and draw a straight line in the direction of those points.

jasmycoin (JASMY)working on a new basic script. found a correlation between these lines and the price. or so it seems. the past information always seems to correlate to something. seeing the proof in the present is so much harder than looking at the past.

JASMY (jasmy) Jasmy keeps getting stuck above an unending short squeeze linear pattern. The Pattern keeps shifting as the longer Jasmy is not carrying on through the lines and pass the arms folded pattern the worse the short squeezes become.

JASMY Inverted Cup & Handle?Taking a look at JASMY on the daily chart we see an inverted cup & handle pattern forming. As of right now price is starting to break below the handle.
Be cautious as price can move further downward to the potential buy zone.
What are your thoughts about JASMY?
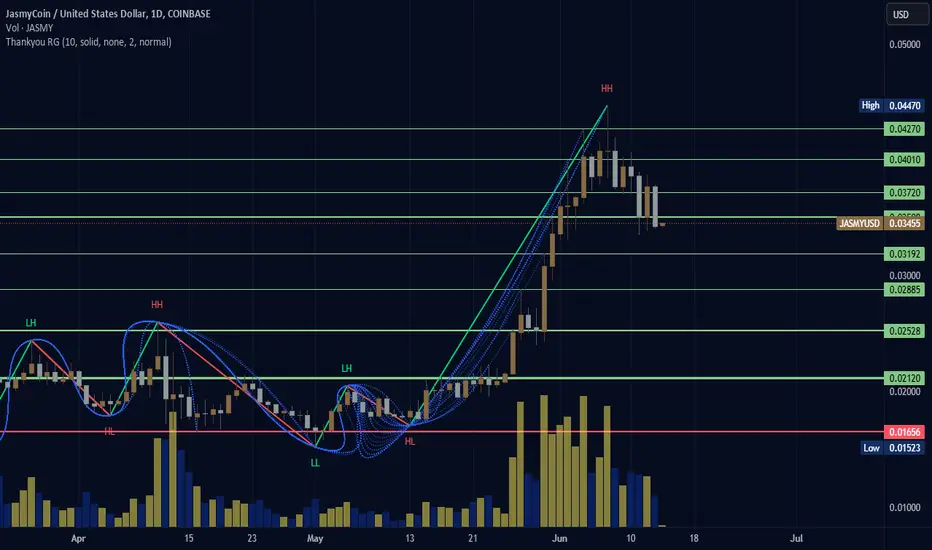
jasmy (JASMY)There are signs of the leading 50 day and 100 day lines are shifting behind the recent highs along a channel with the price in trend. The indicator is variable and does realign based on other charts I look at but so far it seems this one is sticking firmer than before.

Jasmycoin (JASMY)There is a green long arrow on Jasmy appeared today using DGT Elliott Wave indicator. The price has finally crossed over the pit of despair. The lines kept pushing back and pushing back but now it appears as though Jasmy is rising.

$JASMY Bleeding ((Heading Lower))SEED_DONKEYDAN_MARKET_CAP:JASMY still bleeding and the wound wont close until $0.02400 - 0.02255
With $BITCOIN experiencing more Sell pressure from low liquidity in the market and Greed still elevated @ 64, we will continue seeing more pain the markets. This will be a short term.Bearish Trend, will update as needed. 🧐 📉
Targets:
SEED_DONKEYDAN_MARKET_CAP:JASMY = $0.02400 - 0.02255
CRYPTOCAP:BTC = $61,500 (@21 Weekly Moving Average)

I dont use head n shouldersDo you? Anyways, potential -18% drop incoming for JASMY. HUGE DISCOUNT! iykyk, this is in the 12hr. -30% in the last 7 days. Candles are starting to dip under our BBs. RSI shooting to our upper levels, Is JASMY READY TO TAKE OFF? What do you see?

JASMY (JASMY)In trying to understand how to use this indicator, I think the unconnected lines going down show where there are support lines, and the disconnected lines going up represent support lines for support and resistance type observations. I placed the lines on the graph according to the indicator with green being resistance lines and the red line being support.
(JASMY) jasmycoina custom indicator to analyze measurements of all time high, all time low, lowest (50), and highest(50) settings. it appears from the information that jasmy is in a positive frequency of volume.

(JASMY) jasmyThe volume value of Jasmy right now is actually not so high that it is worrying. Surely there will be days when the price of crypto is like a weekend from work or even times when people get speculative. The three larger values of volume in comparison to the price lines on the graph itself. Where will the price go from here?
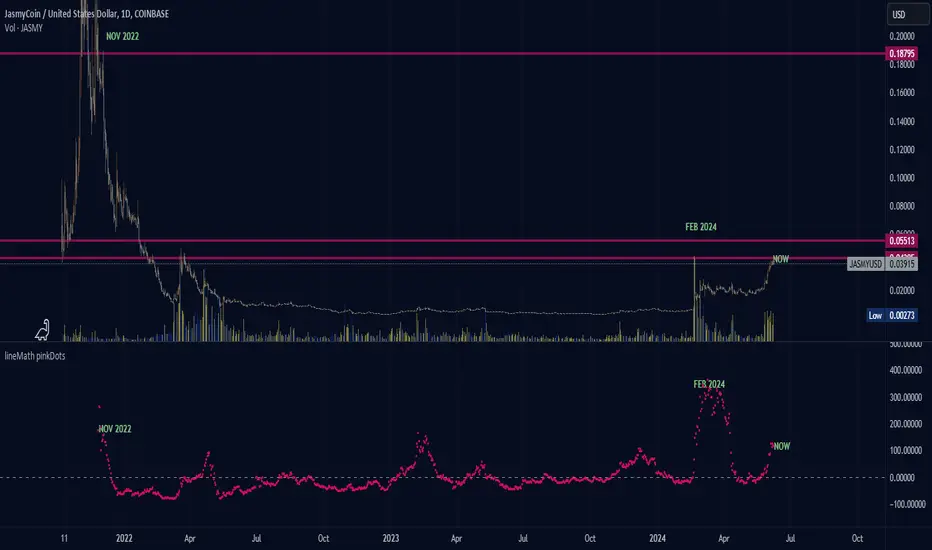
JASMY (JASMY) dots on the rank, median, percentage of rank of the chart. the dots show more activity than the chart in the past. full length view of jasmy since being listed to coinbase. on-going process of finding the right indicator to explain the story. . . . .
