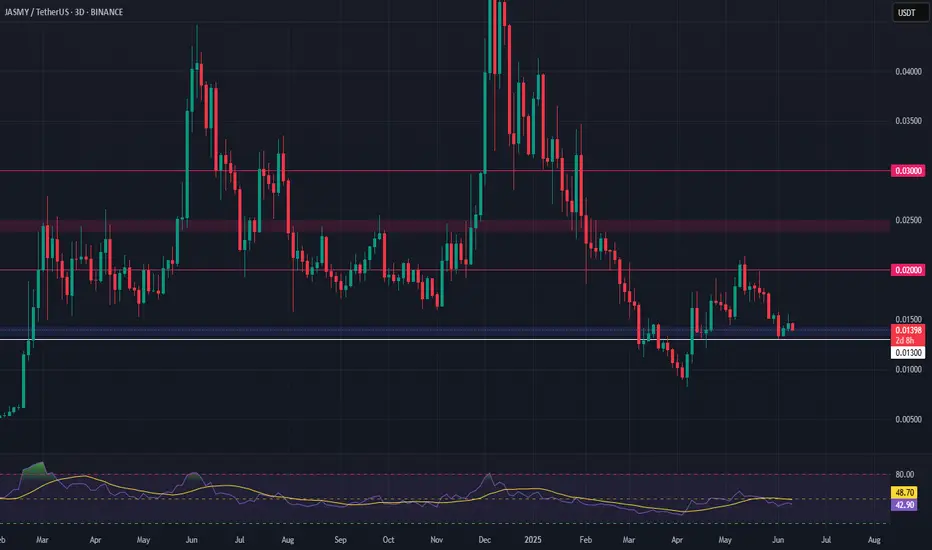
JASMY Long Swing Setup – Oversold Bounce from Major SupportJASMY has seen a sharp decline in recent weeks, but price has now landed in a key support zone. With a potential bounce on the table, we’re eyeing the $0.015–$0.01355 range for a possible long entry toward resistance tests.
📌 Trade Setup:
• Entry Zone: $0.015 – $0.01355
• Take Profit Targets:
o 🥇
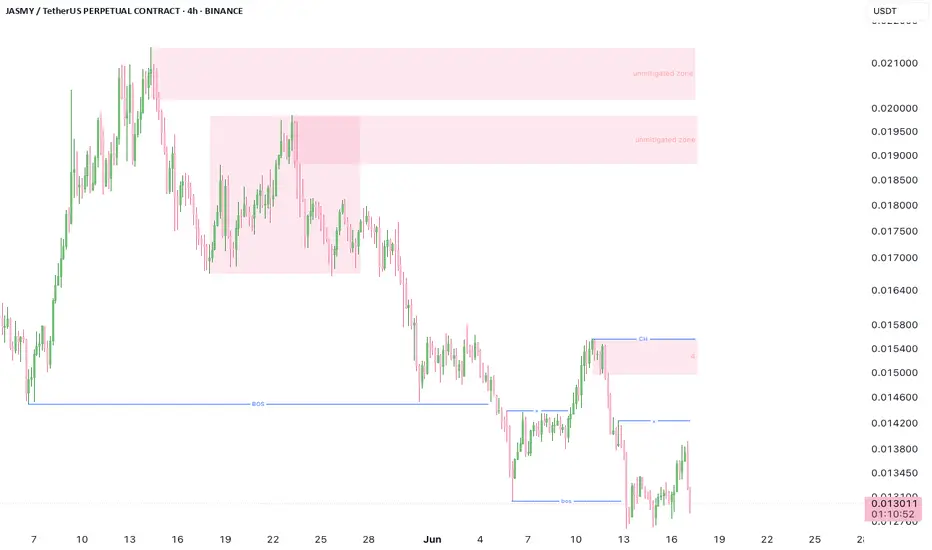
JASMY 4H 17.06.2025Price BOS Low = more opportunities to sell > buy
2 high-probability demand zones
1. demand in 4H =0.0094-0.0115
2. demand in Week =0.0045-0.0074
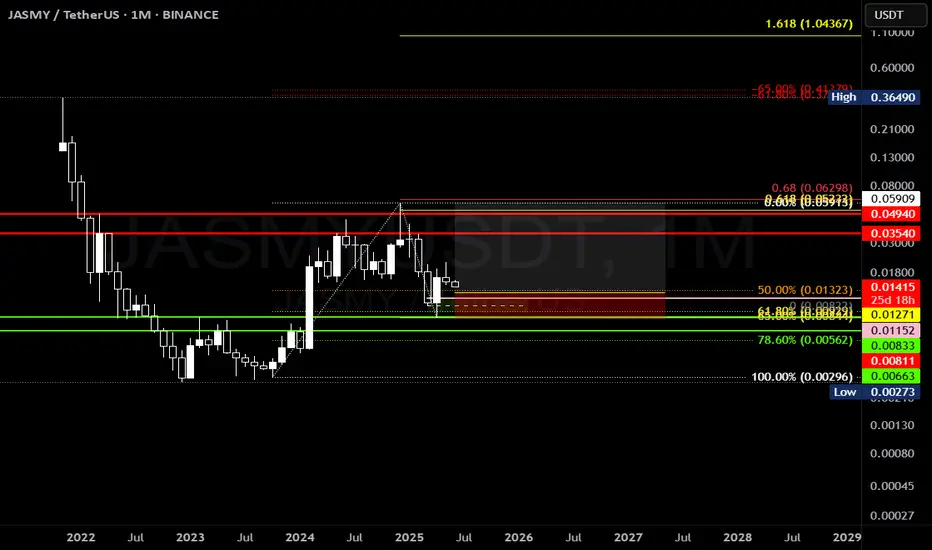
#JASMY on monthly TF jasmy have to be one of best looking coin i have seen, range looks damn interesting, possible cup & handle also forming but for now if dip holds, the way i am expecting with ETH will ape with targeting range highs
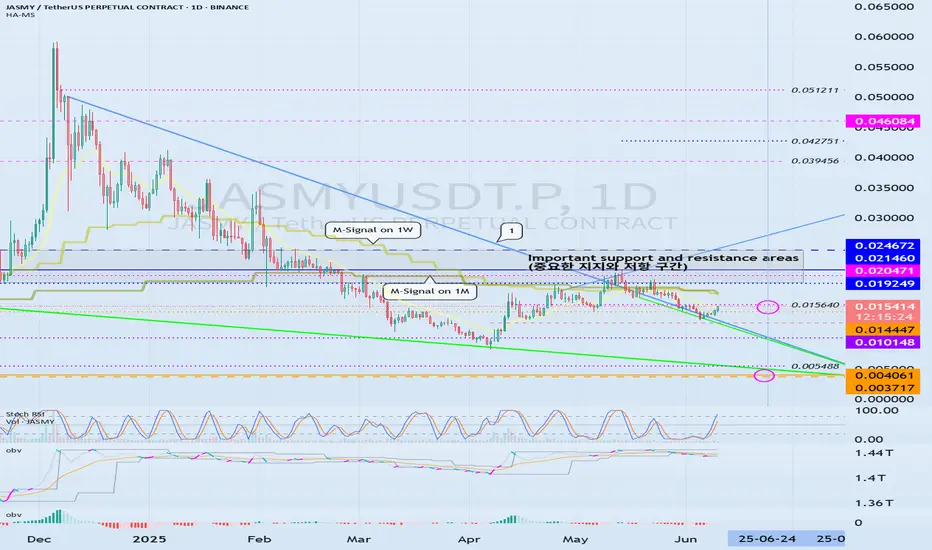
Important support and resistance levels: 0.019249-0.024672
Hello, traders.
If you "Follow", you can always get the latest information quickly.
Have a nice day today.
-------------------------------------
(JASMYUSDT.P 1D chart)
It is showing signs of breaking away from the medium- to long-term downtrend line (1).
However, since it is located below the
JASMYUSDT 4D AnalysisJASMY ~ 4D Analysis
#JASMY Buy gradually after retesting this support block with a short term target of at least 15%+ from here.

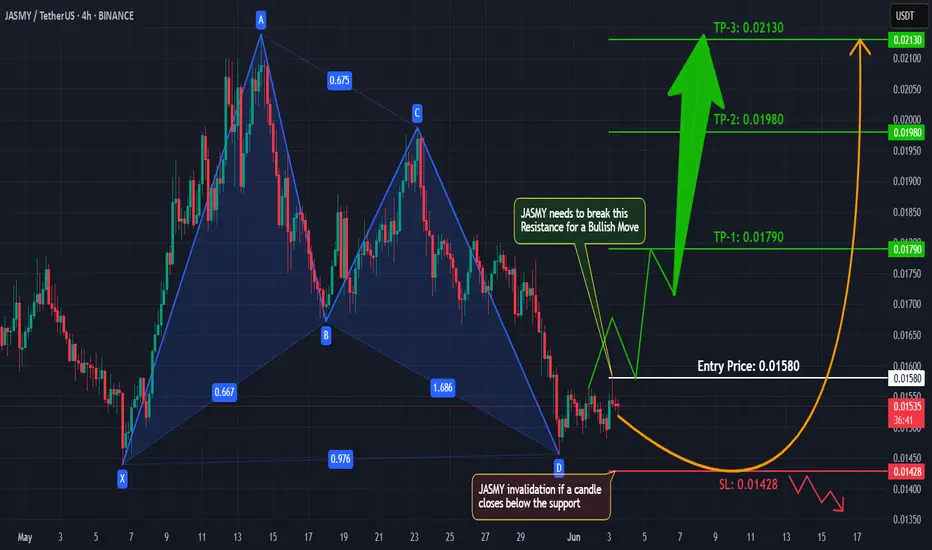
JASMY/USDT – Potential Bullish Breakout Ahead?Hey traders! 👋
#JASMY is currently consolidating sideways on the 4H timeframe, right after completing a harmonic pattern – a strong technical signal often followed by a trend reversal or continuation.
🔍 What I’m Watching:
✅ Harmonic Pattern Completed: The recent price structure aligns well with a
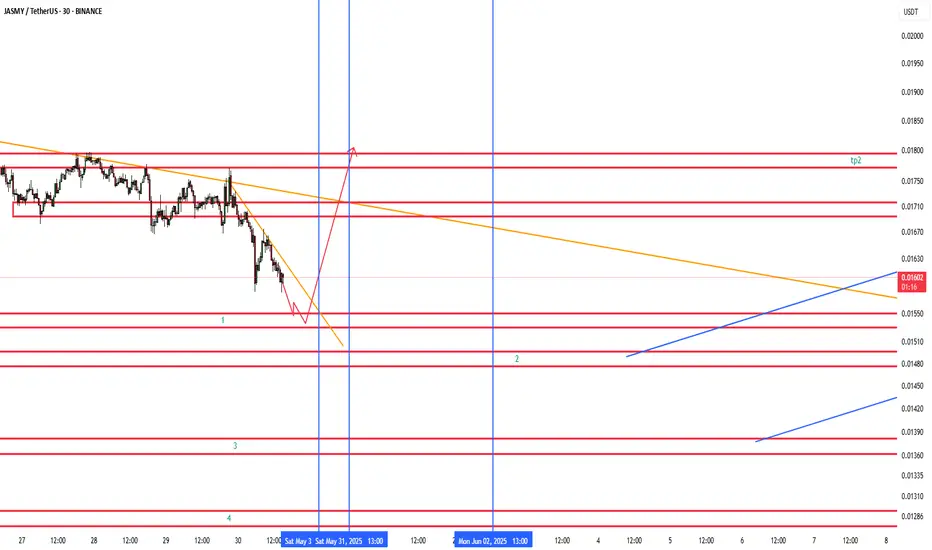
#JASMY/USDT#JASMY
The price is moving within a descending channel on the 1-hour frame, adhering well to it, and is heading towards a strong breakout and retest.
We are experiencing a rebound from the lower boundary of the descending channel. This support is at 0.01480.
We are experiencing a downtrend on the

jasmy/usdtWe're looking to go long on JASMY/USDT as it's approaching the 0.1550 Fibonacci level, which aligns with key dates identified through Gann analysis. This level is likely to act as a magnet for price action or serve as a potential reversal point.
In addition to the Fibonacci confluence, we’re watchi
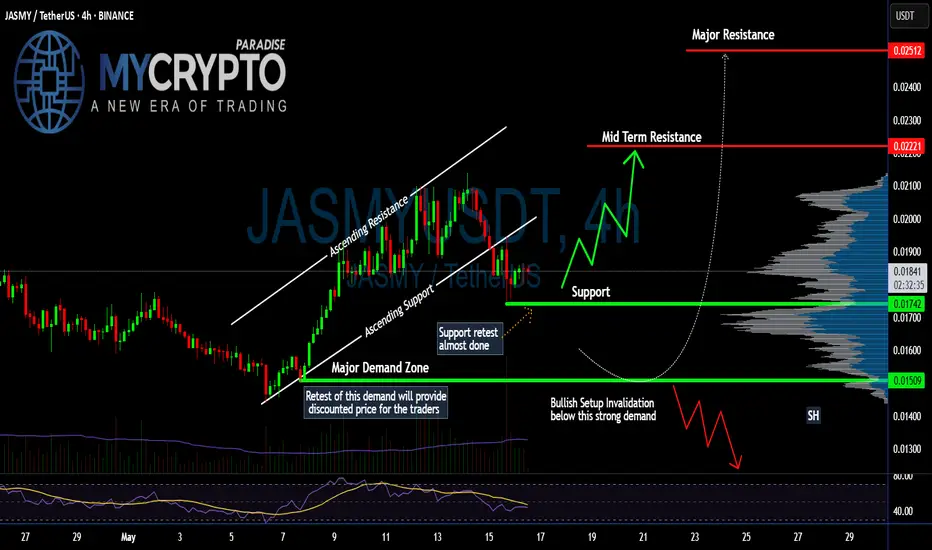
Will #JASMY Retest Trigger a Rebound or a Breakdown? Key LevelsYello Paradisers! Have you prepared yourself for what’s about to unfold with #JASMYUSDT? The #JasmyCoin setup is showing signs of a major move:
💎#JASMYUSD has just completed an impulsive move from the Major Demand Zone around 0.01509 and is currently retesting the ascending support after breaking d
GOOD TIME TO BUY JASMY I MARK THE TARGETSHello, the best opportunities are coming, don't forget it's not investment advice, but do your search for your best answer, greetings RAP

See all ideas
Summarizing what the indicators are suggesting.
Oscillators
Neutral
SellBuy
Strong sellStrong buy
Strong sellSellNeutralBuyStrong buy
Oscillators
Neutral
SellBuy
Strong sellStrong buy
Strong sellSellNeutralBuyStrong buy
Summary
Neutral
SellBuy
Strong sellStrong buy
Strong sellSellNeutralBuyStrong buy
Summary
Neutral
SellBuy
Strong sellStrong buy
Strong sellSellNeutralBuyStrong buy
Summary
Neutral
SellBuy
Strong sellStrong buy
Strong sellSellNeutralBuyStrong buy
Moving Averages
Neutral
SellBuy
Strong sellStrong buy
Strong sellSellNeutralBuyStrong buy
Moving Averages
Neutral
SellBuy
Strong sellStrong buy
Strong sellSellNeutralBuyStrong buy
Displays a symbol's price movements over previous years to identify recurring trends.