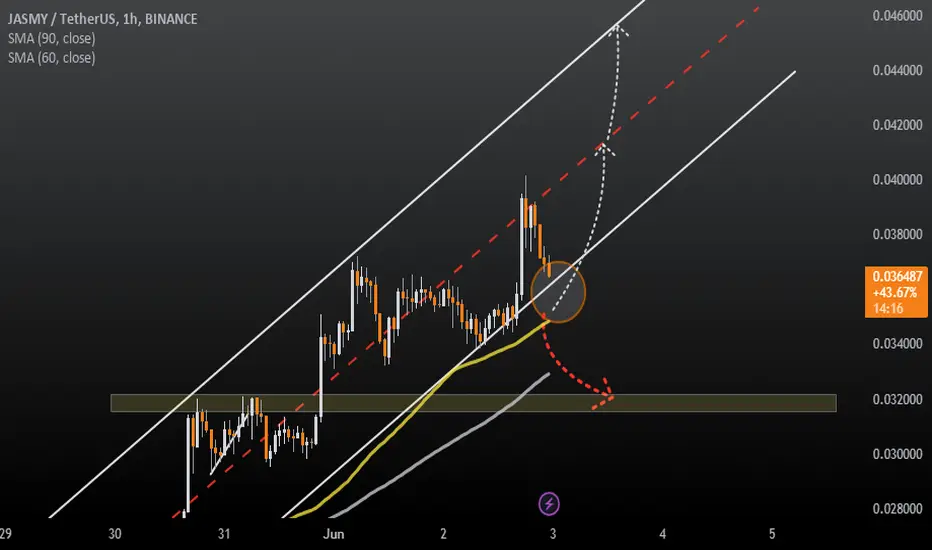
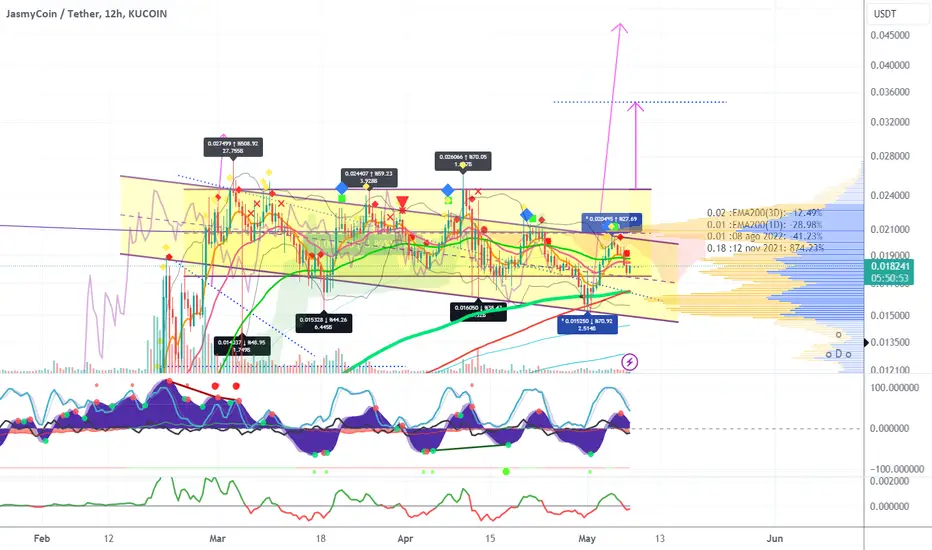
JASMY IdeaIf the price does not breaking the bottom of the channel, (due to the end of the fifth wave in the 4-hour chart), then after hitting the bottom of the channel as well as hitting the 30-MA. there is possibility to return to top of the channel.
Pay attention: that the closing of the ascending candlestick inside the chanel, and then, passaging the next ascending candle above the highest price of the closed candle, is a buy signal.
JASMYUSDT.P trade ideas
JASMY PriceThe Jasmycoin (JASMY) continued to uplift gains and rallied over 120% this month. Amidst the market uncertainty, JASMY price persisted to emerge and reached the blue sky zone.
JASMY/USDT
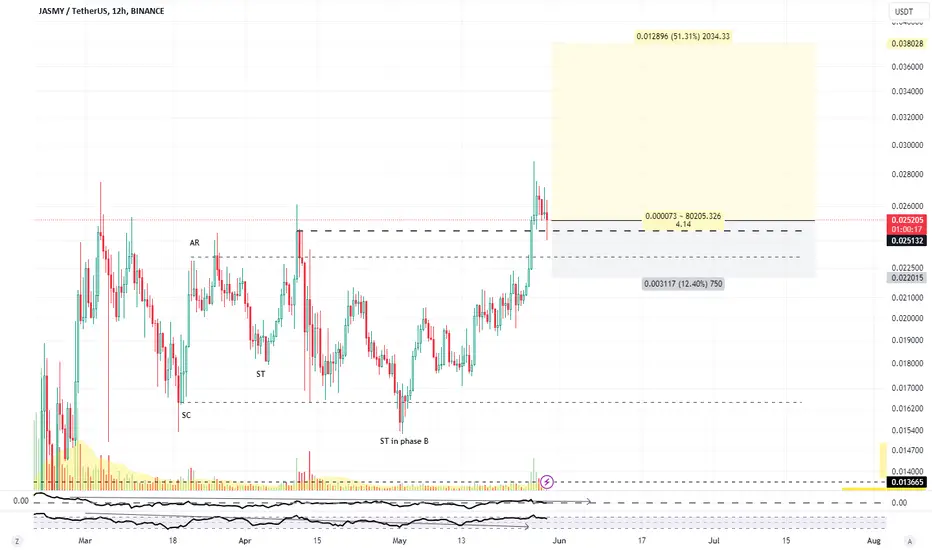
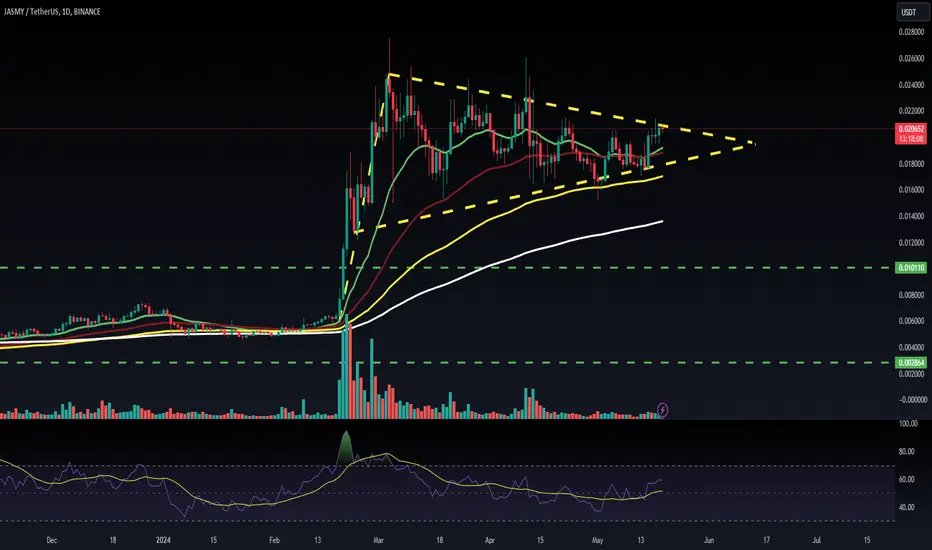
INTERESTING VOLUME WITH RESISTANCE BREAKS
Price: selling of a buildup of more than 2 years, breakout of the symmetrical triangle at the top. looking for key points of the Fibonacci retracement 0.38 - 0.61; clearly the initial market price.
RSI: leaving the oversold zone growing positively

Alikze »» JASMY | Ascending channel🔍 Technical analysis: Ascending channel
In daily time, 1D is moving in an ascending channel.
💎 According to the pullback to the broken structure and the major roof, this upward movement can continue until the next area and the roof of the channel.
Considering that it is currently in the middle of the channel, the candlestick above the area reinforces the bullish structure.
💎 Alternative scenario: In addition, according to the trading node in the range of 0.024414, which is also around the bottom of the channel, in case of a break, the correction zone can continue until the liquidity zone.
»»»«««»»»«««»»»«««
Please support this idea with a LIKE and COMMENT if you find it useful and Click "Follow" on our profile if you'd like these trade ideas delivered straight to your email in the future.
Thanks for your continued support.
Best Regards,❤️
Alikze.
»»»«««»»»«««»»»«««

Partnership with AAPL?At this point they are just rumors as far as I'm concerned....
HOWEVER,
This coin has been on a tear and resistant to all down moves in the general market. I'm in long and continuing to buy on dips..

Long JASMY
JASMY consolidating above the current range. If this level holds, JASMY will have a small rally to reach $0.38.
This price is also the target of the proposed set-up.
Invalidation is when price falls back in the range (below $0.244)
Disclaimer:
This analysis is based on my personnal views and is not a financial advice. Risk is under your control.
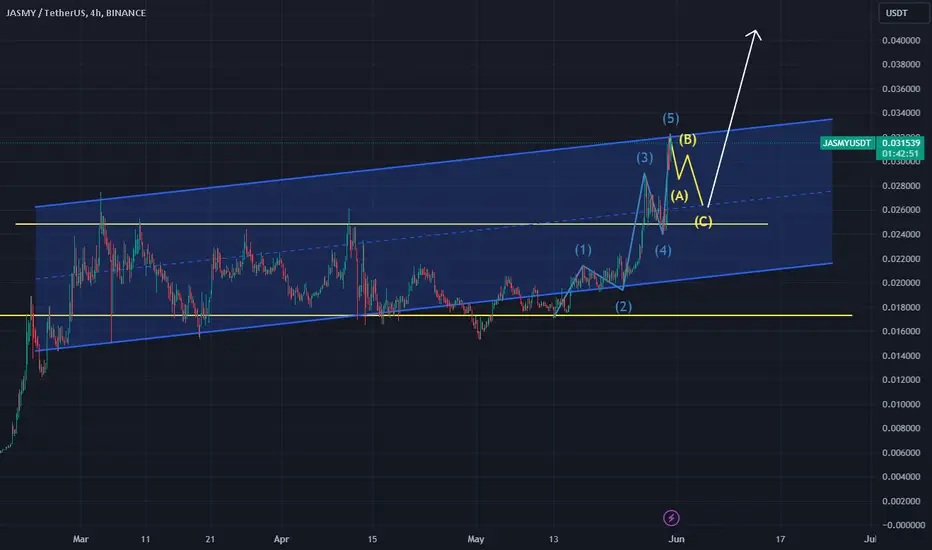
Jasmy OutlookJasmy has broken out and reached the top of the channel.
I can see a 5 wave structure to the upside and expecting an A,B,C correction before we rally higher.
JASMY: Potential Bullish Pennant Breakout!Hey everyone! If you enjoy this content, please consider giving it a thumbs up and following for more analysis.
JASMY is currently testing the top of a potential bull pennant pattern on the daily timeframe. A confirmed breakout could signal further bullish momentum. Buy some now and add more in the dip.
What to Watch For:
Confirmation of Breakout: A daily close above the resistance level of the pennant strengthens the bullish case.
Volume: Higher trading volume on the breakout can increase confidence in the signal.
Possible Entry & Targets (for educational purposes only):
Entry: $0.021-$0.024
Potential Targets: 300-400%
Stop-Loss: $0.018 (Consider setting a stop-loss based on your risk tolerance strategy)
Let's Discuss!
What are your thoughts on JASMY's current price action? Do you see a bullish pattern? Share your analysis in the comments below!

JASMYUSDT Bull Flag Breakout Targeting 1.618 Fibonacci ExtensionJASMY is currently breaking free from what appears to be a tight Bull Flag that it's formed at the locals highs. A move above the consolidation zone could take JASMY to extremely higher highs as beyond 4.9 cents lies no resistance at all and only a history of moving straight up and down which can be seen on the older spot chart of this coin. With that in mind, one would think it could trade as high as 2 dollars if the resistance were to break.
he bullish Pennant ( flag)the possibility of the bullish Pennant ( flag) as a classic bullish pattern - ...normally we need to see high volume after breaking up the flag ( pennant) which we see now ... if the recent decrease a pullback and we resume upward , then Target can be around $0.1 ( size of the flagpole) ( IMHO)

JASMYUSDTIn exactly 20 days, SEED_DONKEYDAN_MARKET_CAP:JASMY reached the target I had anticipated, resulting in a 50% gain. Congratulations to everyone who benefited! If it maintains stability above the Fib1 resistance, the upward trend is expected to continue. The next target is Fib1.618.

JASMYUSDT Idea- PullbackHey traders!
JASMY has been on a strong run lately, reaching highs of $0.2890 on the daily and 4-hour charts. However, it's natural for any asset to experience pullbacks after a significant climb. In this case, JASMY found support around the 50% Fibonacci retracement level, which often acts as a historical buying zone. This area also coincides with daily resistance, indicating a potential turning point.
The good news? The bulls (investors hoping for price increases) seem to be back in charge! After the price correction, JASMY has shown renewed momentum and could be headed towards the $0.35600 price range.

JASMY BULLISH SETUPJASMY is consolidating for more than 100 days and is now ready explode hardly. A bullish momentum can lead 70 - 80% growth. Low leverage long position or spot call is recommended.
Jasmy new ATH👀Jasmy currently in consolidation period,there is very low volume in daily time frame,
As you can see if breakout comes with good volume then we can see new ATH

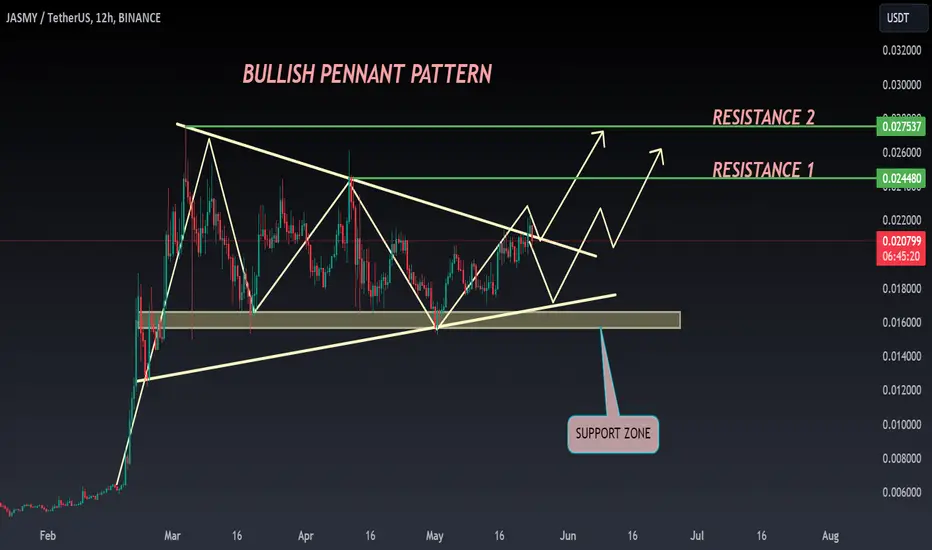
JASMY ANALYSIS🔴 #JASMY Analysis : ❓❓
🔮There is a formation of "Bullish Pennant Pattern" in #JASMY in daily time frame. We can expect around $0.02750 bullish move if the price perfectly retests the level📈📈
🔰 Current Price: $0.02081
🎯 Target Price: $0.02750
⚡️What to do ?
👀Keep an eye on #JASMY price action. We can trade according to the chart and make some profits. ⚡️⚡️
#JASMY #Cryptocurrency #Breakout #DYOR
[JASMYUSDT] - on the verge of breakout!Consolidate a bullish pennant pattern in 3D chart and looks it attempt for huge breakout.
Upper side of bullish pennant and 0.618 fib is gathering together.. breakout meaning a 160% bullish from that point
We Appreciated for supporting us with your like and follow for more updates 🎯

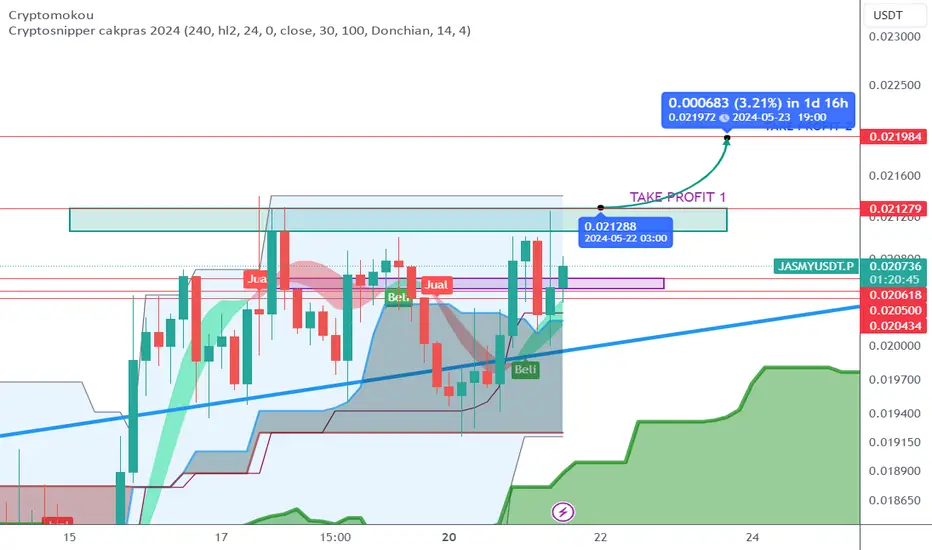
$JASMY will be go up If the price of SEED_DONKEYDAN_MARKET_CAP:JASMY reaches 0.021279, it is anticipated to rise to 0.021984. This forecast is based on technical analysis and historical price patterns, suggesting a potential upward movement following the attainment of this threshold.
JASMY coin
The JasmyCoin (JASMY) crypto displays a bullish pennant pattern and the coin has sustained gains above its key EMA’s.
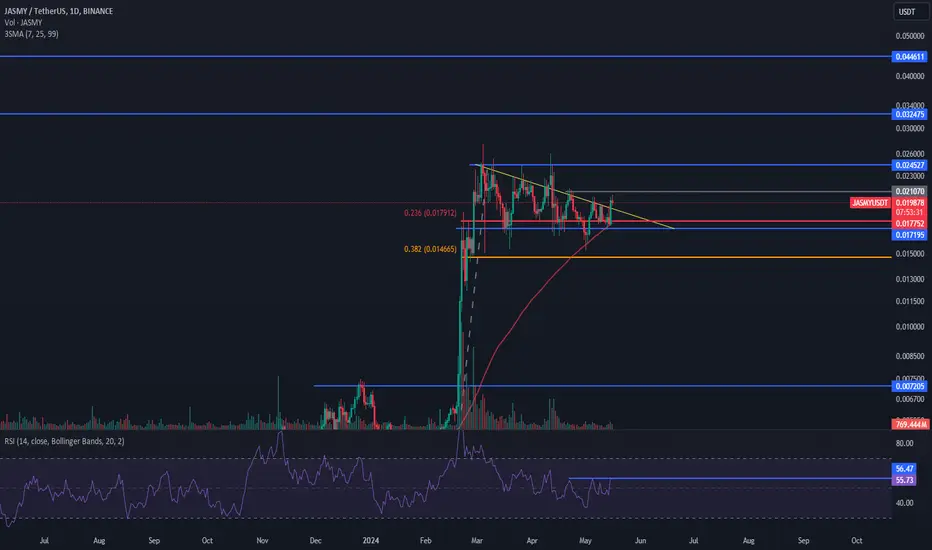
📈Daily Analysis: Exploring JASMY for Profitable Trades🎯🔍Yesterday, Bitcoin formed a strong bullish candle on the daily time frame, highlighting the importance of considering all scenarios to avoid being caught off guard by market movements. One of our scenarios suggested that a false breakdown of support could lead to an upward move. This indeed happened, with Bitcoin not only rising but also breaking through the $64,400 resistance and currently consolidating.Today, we will analyze JASMY, a coin that could offer good trading opportunities in futures markets. Let's identify potential entry points for profitable trades.
⚡️JASMY is currently in an uptrend on the daily time frame, making it suitable for long positions. However, the momentum has shifted as the SMA99 has caught up with the candles, indicating the possibility of short positions since the bullish momentum has waned, allowing for potential downward movements.
✅Support and Resistance: The price is consolidating between the 0 and 0.236 Fibonacci levels, with a support zone between 0.236 and 0.382 that has held despite significant selling pressure. A descending trend line was faked out once and has now stabilized above it, yet it hasn't triggered a decisive move.
📈The key trigger for confirming the continuation of the uptrend is at 0.021070, the previous high that led to a lower low. A candle closing above this level would suggest buyers are regaining control, making it a reliable entry point for long positions.
Main Trigger: The ultimate trigger for a long position is at 0.024527. However, this level may break with a large candle, leaving little room for a logical stop-loss. Thus, trading at the 0.021070 level is preferable.
📊For a more robust confirmation, look for increasing volume in green candles. Without this, the upward trend may show weakness. Additionally, an RSI stabilization above 56.47 would confirm the re-entry of bullish momentum into the market.
📉The trigger for shorting JASMY is at 0.017195. However, given the overall bullish structure and better shorting opportunities in other coins with more pronounced downtrends, shorting JASMY is not highly recommended.
📝In summary, JASMY presents a potential for long positions, given its current uptrend in the daily time frame. The critical trigger level to watch is 0.021070, with further confirmation needed through increased trading volume and RSI stability above 56.47. While short positions are possible, the coin's overall bullish trend suggests focusing on long positions or finding other assets with stronger bearish trends for short trades. Stay vigilant and manage your risks appropriately to capitalize on the market movements effectively.
🧠💼It's important to acknowledge the inherent risks in futures trading, with the potential for margin calls if risk management is neglected. Always adhere to strict capital management principles and utilize stop-loss orders, ensuring that the initial target offers a risk-to-reward ratio of 2.
$JASMY forming concomitant flagsTwo distinct flags can be drawn here and market is just waiting the breakout!
Targets are indicated by pink arrows!
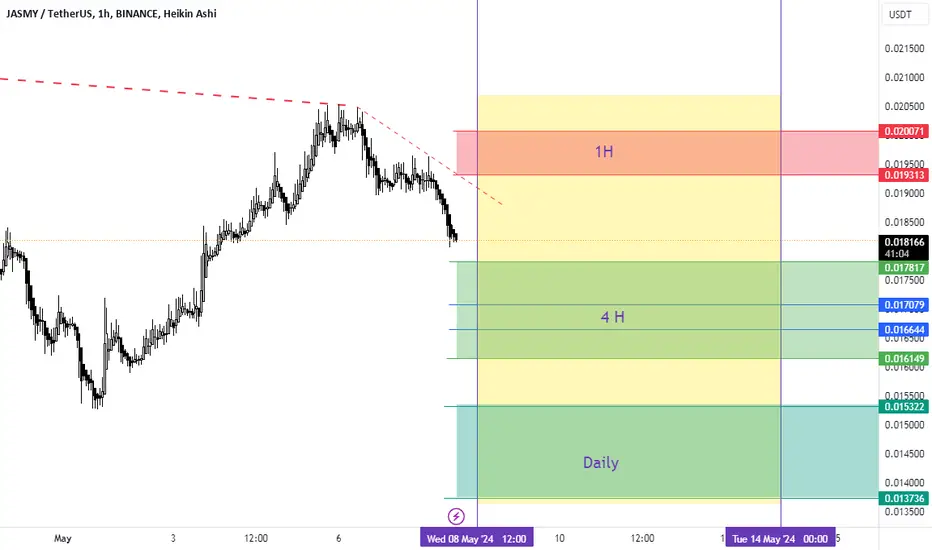
jasmyIn the time of the yellow box, I am waiting for a move. The important points we have are marked. So we will move forward with patience.
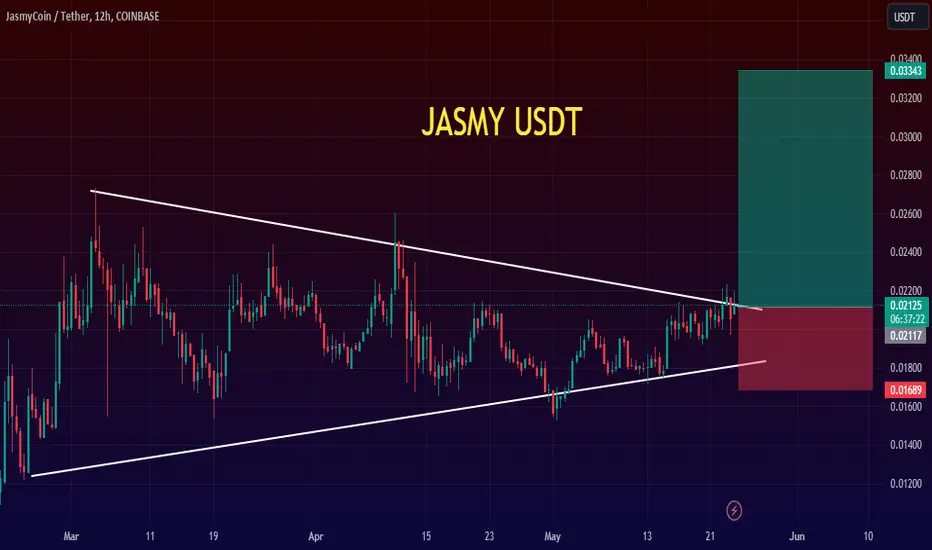
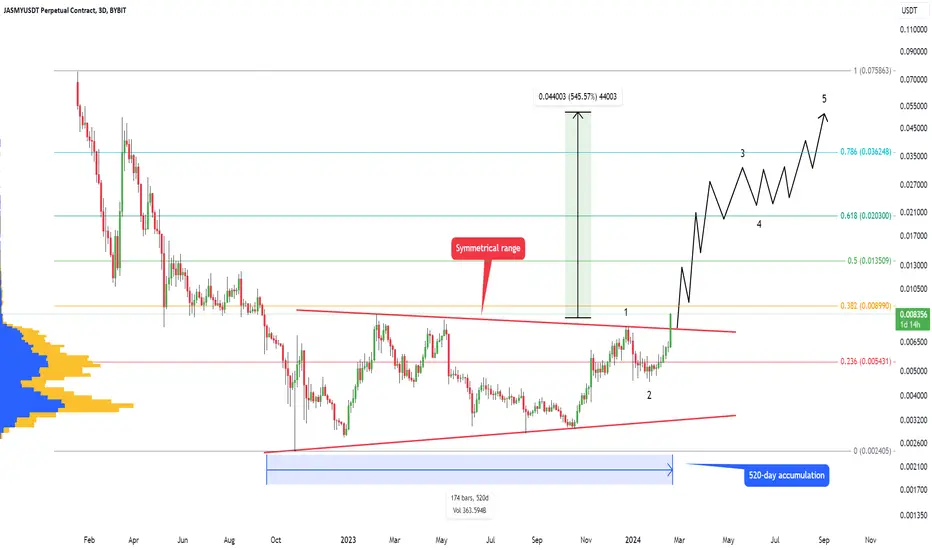
JASMY can 545% in a few weeks, buy now!Technical analysis
JASMY is breaking out of the symmetrical range after 520 days. It has been a long time, and this coin can make a 545% profit in a few weeks or days. It's best to buy the coin right now. Sometimes pumps are very fast and steep. I am expecting a strong Elliott Wave impulse wave to happen in the immediate short term.
Let me know what you think about my analysis, and please hit boost and follow for more ideas. Trading is not hard if you have a good coach! Thank you, and I wish you successful trades.
Fundamental analysis
What Is JasmyCoin (JASMY)?
JasmyCoin (JASMY) is a cryptocurrency project of a Tokyo-based Internet of Things (IoT) provider Jasmy Corporation. As a system, the Internet of Things includes mechanical and digital elements endowed with an identifier and the ability to transmit data. The IoT company Jasmy specializes in buying/selling data, and the Jasmy platform connects two categories: service providers and data users.
The Jasmy platform was built to restore and protect the sovereignty of individual data by combining IoT technology with blockchain technology and giving users full control over their personal information. The main goal of the project is to establish a secure environment on the platform where users can exchange data in a trustless manner between IoT devices (computers, cars, phones) and decentralized protocols.
The mission of Jasmy developers is to create an environment by shaping an infrastructure where users can easily, safely and smoothly use data. As a result, Jasmy aims to provide its users with a powerful infrastructure, an intuitive interface and a secure environment for storing and sharing data. In the Jasmy space, information can be transformed into personal assets.
Jasmy decentralizes the workflow with edge computing and storing data on IPFS (InterPlanetary File System). The philosophy of the project is based on the democratization of data using a decentralized model, where data is securely protected and owned by an owner, and service providers get the opportunity to promote their services/business using data (owned by users).
Let me know what you think about my analysis, and please hit boost and follow for more ideas. Trading is not hard if you have a good coach! Thank you, and I wish you successful trades.
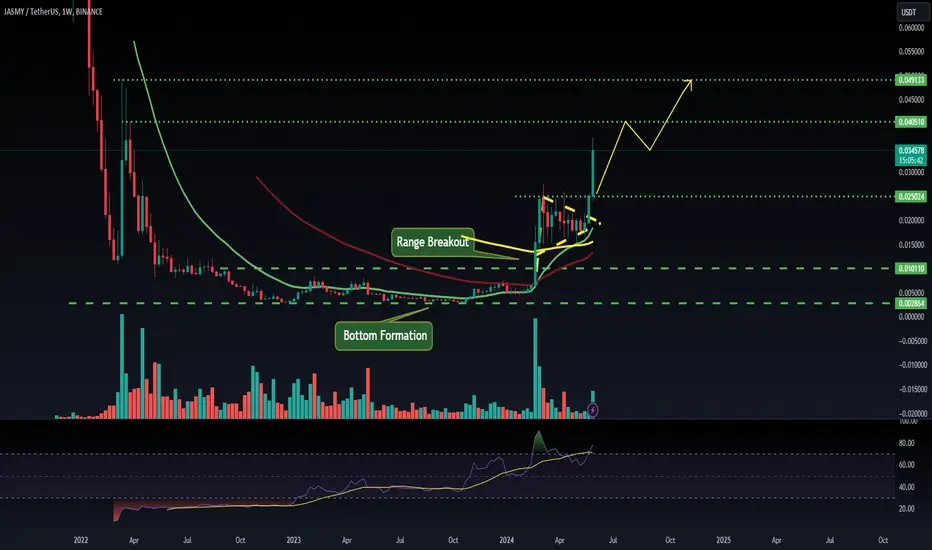
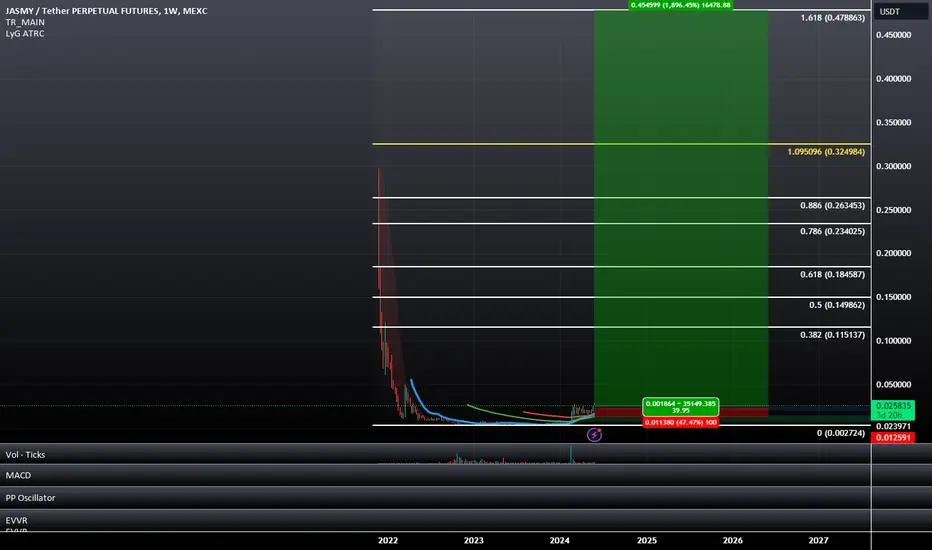
JASMY ANALYSISRisk warning:
This coin is included in the high-risk symbols of Binance and may be removed from Binance at any moment, usually the currencies that are removed from Binance have a heavy drop.
JASMY has created a large and time-consuming base, and then JASMY has left this base with a sharp move.
We have a big IFC move on the chart and there is also no pullback to the BASE range.
It is expected that a pullback to the base will be done with high volatility, and then the main and upward rally will be created.
The targets are clear on the picture.
This analysis will be violated if the weekly candle closes below 0.00440.
We are looking for buy/long positions in the green range.
For risk management, please don't forget stop loss and capital management
When we reach the first target, save some profit and then change the stop to entry
Comment if you have any questions
Thank You
