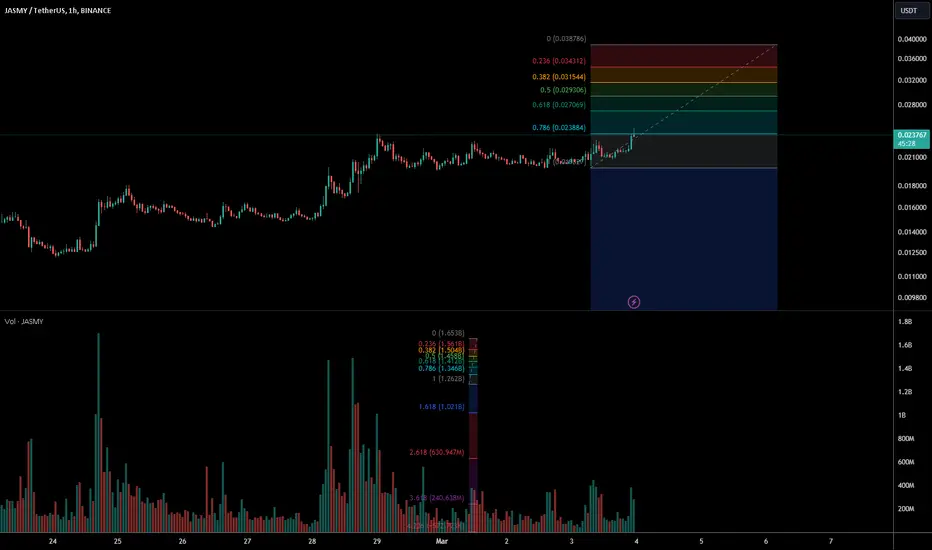
Jasmy USDT bullish scenario on 3Day timeframeReasons for Bullish:
1) Bullish Engulfing candle near golden fib ratio
2) Positive Reversal Divergence on 3 Day Timeframe
3) Already in Uptrend.
4) Above 20 MA
JASMYUSDT.P trade ideas

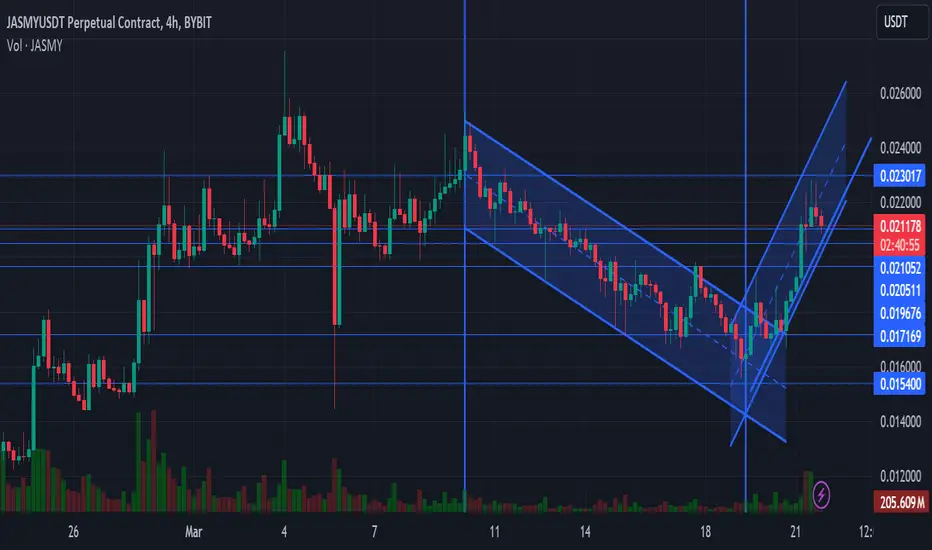
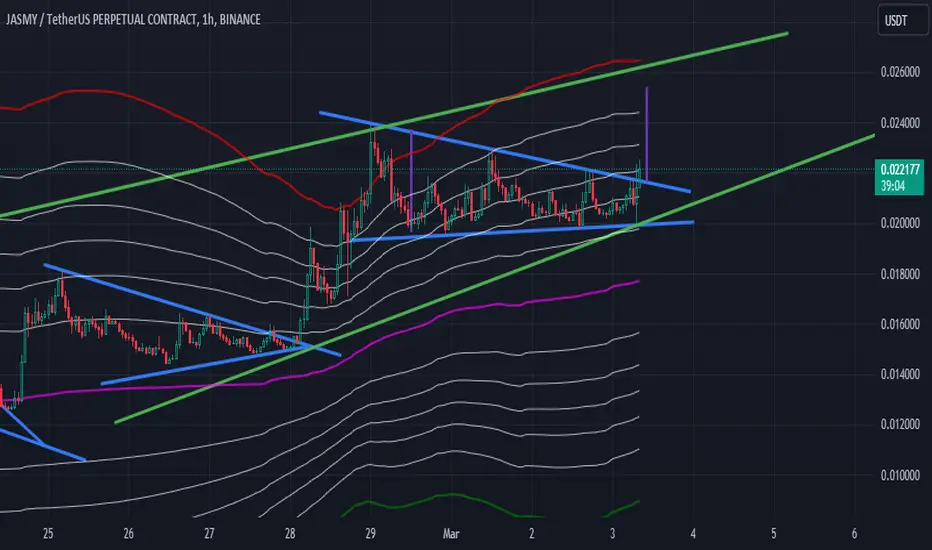
Jasmy Am bullish using Parallel channel
Jasmy trending up- You can set limit order at 0.020500 - 0.020511
TP When satisfied, trail SL
DYOR
Breakthrough in Play?JASMY is currently trading at $0.02150, capturing the attention of traders with a notable last day increase of over 15%. This surge in price is underscored by a substantial trading volume, suggesting strong market participation in this movement.
The technical indicators exhibit mixed signals: The Bollinger Bands indicate that the price is nearing the upper band, which can act as a resistance level. A breakout above this band could suggest continuation of the upward trend, but as the price approaches this upper band, traders should be cautious of potential pullbacks.
The MACD shows a bullish trend, with the histogram in positive territory and the MACD line above the signal line, indicating current momentum may carry forward. However, traders should look for continued positive histograms to confirm the persistence of this trend.
The RSI, while not in overbought territory, leans towards the higher end, suggesting that there may be some potential for upward movement before the market considers the asset overbought. Yet, caution is warranted as it approaches the 70 level, which is often interpreted as a sign that a pullback could be forthcoming.
The Stochastic oscillator (%K and %D lines) are not in the overbought zone either, but they are trending upward, which typically supports the bullish sentiment.
The chart annotations highlight a breakout with a need for confirmation. This means that while JASMY has pushed past a resistance level, traders should seek further bullish signs to confirm the breakout's sustainability, such as higher highs and higher lows, as well as support levels holding strong in case of a retracement.
In summary, JASMY shows promising bullish signs, but it faces a critical test as it encounters strong resistance levels. Traders should monitor these levels and look for confirmation before drawing conclusions about the continuation of the trend.

JASMY Still Bullish Based on the technical analysis of JASMY, the moving averages provide a strong buy signal across various timeframes. The oscillators suggest a mixed sentiment, with the RSI indicating a neutral market. However, the Awesome Oscillator and Bull Bear Power indicate potential bullish momentum. The pivot points provide levels to watch for support and resistance.
Recommendation:
Considering the overall technical analysis, it is recommended to buy JASMY within a 24-hour timeframe. The strong buy signals from moving averages and the presence of bullish indicators such as the Awesome Oscillator and Bull Bear Power indicate potential upward movement in the short term.
Traders should closely monitor the Fibonacci pivot levels for support and resistance. If the price breaks above the resistance level at 0.027730, it could indicate further upward momentum. Conversely, if the price drops below the support level at 0.008597, it may indicate a reversal of the bullish trend.
As with any investment, it is advisable to perform additional research and consider market conditions, news events, and risk management strategies before making any trading decisions.
Disclaimer: This article is for informational purposes only and should not be considered as financial advice. Trading cryptocurrencies involves risk, and readers should exercise caution when making investment decisions.

"Never cross the road before checking".If it crosses the green..Hey my dear community and consors, let's check if it crosses the green road, which is a very good sign. If it crosses, congratulations for thoses who took good opening positions as mentionned on my previous "long story short". We can see the Bollinger bands position is good. Let's check this out together but remember ! Always cross when it's green ;)

Jasmy/Usdt Exited at 0.0173 Amid BTC Uncertainty 📉Exited at 0.0173 Amid BTC Uncertainty 📉
I've made a move, exiting at 0.0173 amidst Bitcoin's potential drop to the 60K zone. Expecting alts to bleed, including JASMY, likely dipping back to the 0.015 zone.
Prepare to re-enter positions as this could be the final dip to that level. Stay tuned for further updates; next stop, 0.03 zone! 🚀
For more insights, check out previous idea in my profile.

Prepare to Rocket with JASMY/USDT Amidst Market Correction🚀 Jump on Board: Prime Entry Zones for JASMY/USDT 🚀
1st Buy Zone: 0.019835 (30% Dip) 🎯
2nd Buy Zone: 0.015602 🔍
Short to Mid-Term Target: 0.032-0.034 🎯
Get ahead of the curve and secure your position in JASMY/USDT! With strategic entry points identified, prepare for potential gains as the market corrects. Don't miss out on this opportunity!

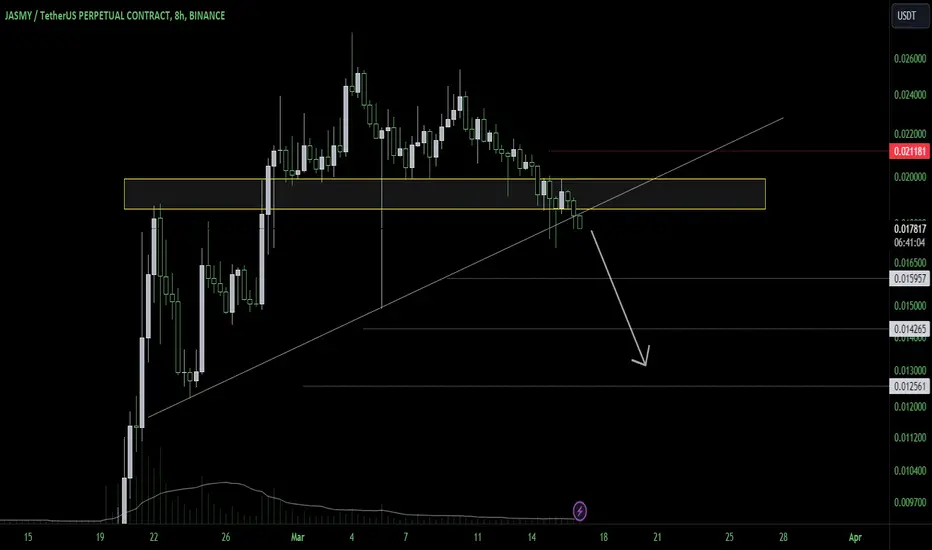
JASMY possible scenarioit's quite likely that JASMY will drop to lower levels as indicated in the picture
JASMY - 4hrs ( Pump 40 % Target After Break 0.0211 ) Dont miss Target Pump 40 % in Fast Run After Break
0.0211 Level - Dont miss the chance

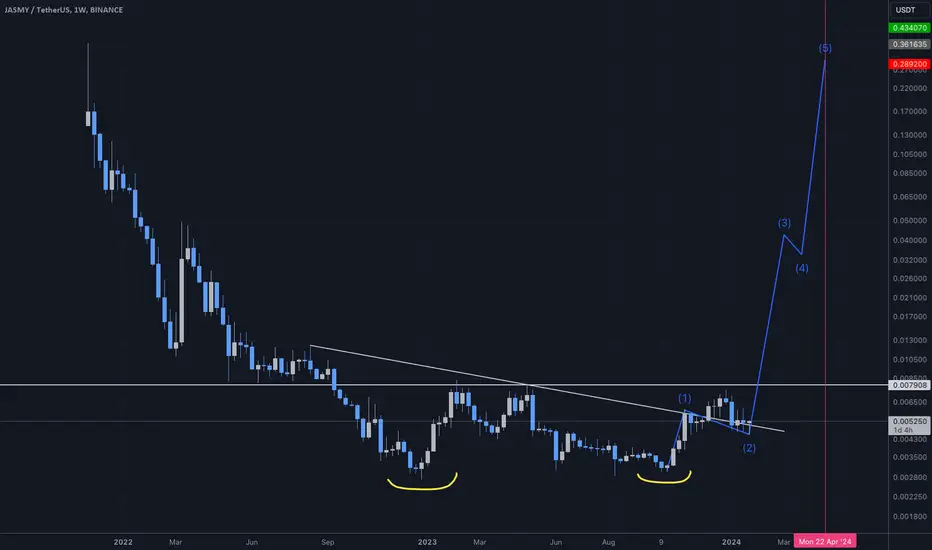
Jasmy Wave 5 will be gloriousJasmy consolidating nicely at $0.02.
Scam wick to 0.015 took out a lot of leveraged longs.
Stay in spots.
Buy dips.
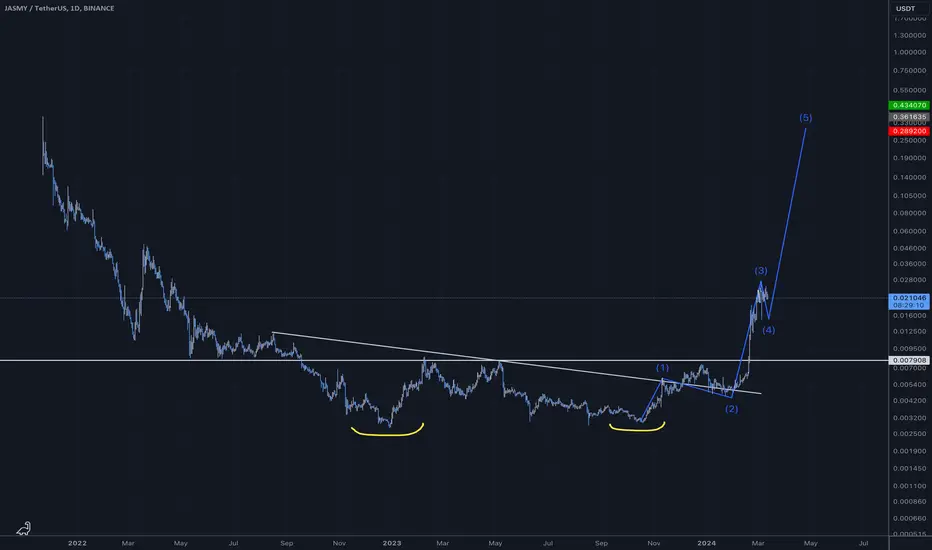
JASMY long term double bottom about to break outJasmy sufferred some serious diluation in 2022-2023. 10% circulatio supply increase to 99% circulation suppply. The tokens is now fully diluted.
Double bottomed.
If there is a crypto bull run in 2024 Jasmy has a great setup for for bullish strucutre.
Jasmy short ideaI've been watching jasmy for a couple weeks now. Breaking out and reaching its high of 0.028. It has presented a head and shoulder pattern: if it breaks the 0.020 again there will be draw down to liquidity below. Once we regain liquidity from below get ready for a retest of its recent high.
If head and shoulder is false, then we will see a next leg up in this uptrend. Not financial advice, just my analysis.
- CryptoJay

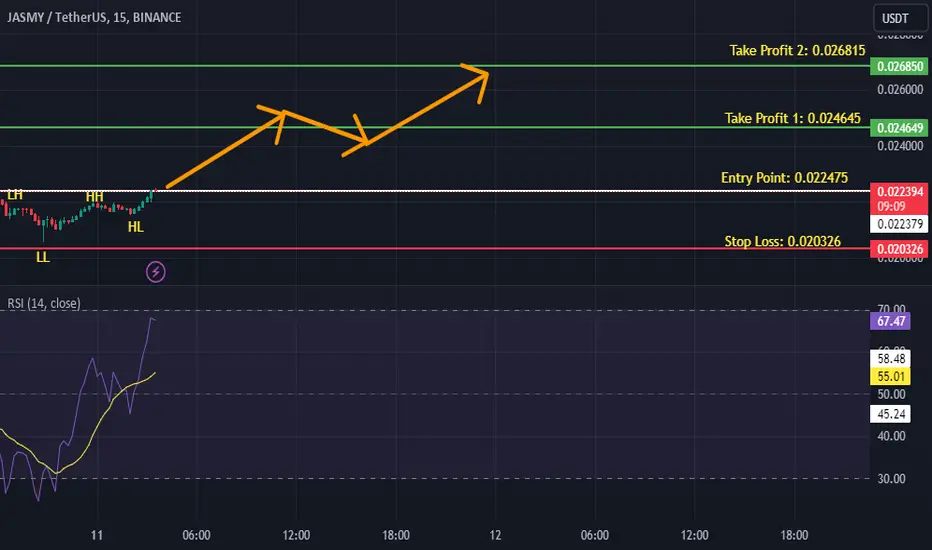
JASMYUSDT is BullishJASMY is currently looking good as it has broke the previous lower high and printed a new higher high followed by a higher low. The bullish momentum would take the price to print new highs. Targets are mentioned on the chart.
LONG STORY SHORT...Here are the main idea you need to keep in mind for Jasmy. I'm optimistic for long term holding but for short term trading I advice being careful. Not a financial advice.

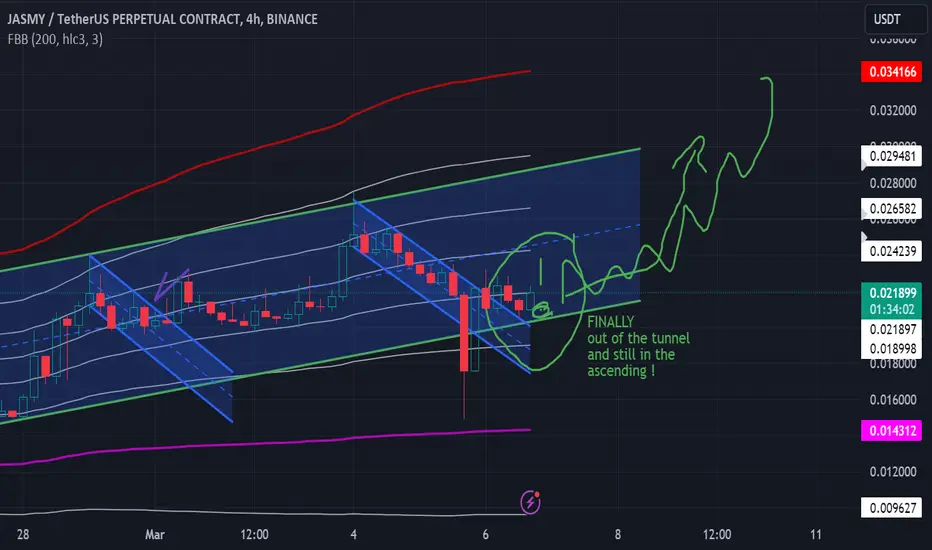
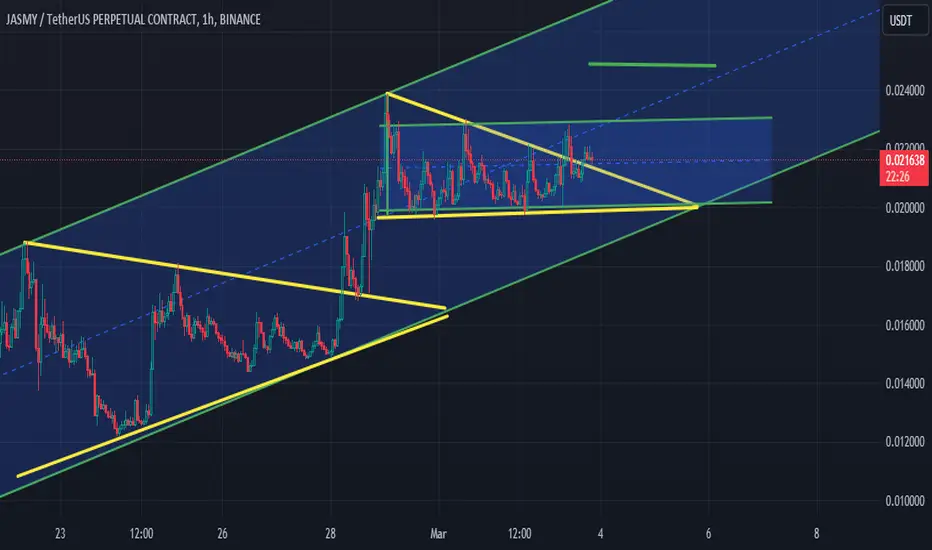
Finally out of the corridor !! and still in the ascending trendTomorrow should be a positiv day for jasmy. Of course stay tunned and avoid leverage to not be liquidated and lost all your money. not a Financial advice
Descending parallel channel confirmed, to decision is coming(Short term) The channel was confirmed and the music partition will go soon to the next chapiter. Will it be a sad or happy melody ? The answer is coming soon... (Not a financial advice)
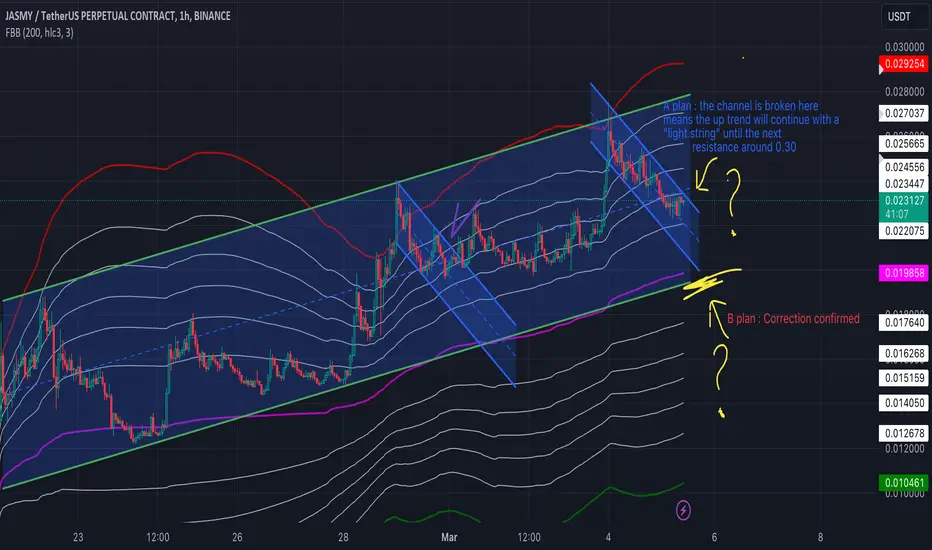
(short term) let the music play but continue to listen !(not a financial advice) We are going through a descending parallele channel which needed to be monitored to see if a correction is incoming or the continuation of the up trend until the next resistance around the red line fib

JASMY → still running!hello guys...
as you can see this coin break an ascending channel and touched the next level!
the last move was a sharp one and we can expect the next upward movement start from the blue area!
the next target is 0.028399
___________________________
💻📞☎️ always do your research.
💌📫📃 If you have any questions, you can write them in the comments below, and I will answer them.
📊📌❤️And please don't forget to support this idea with your likes and comment

Jasmy short term positions long into an ascending triangle Not a financial advice, showing a way to take a short term position LONG and an ascending triangle need to be monitored if it brokes up or down
Descending triangle became horizontal parallel channel pattern(Short term) Descending triangle became an horizontal parallel channel pattern to monitor for breakout !
Not a financial advice
Areas to retestThis coin has been manipulated by a sole trader using around 10 million USD to create order blocks in both directions to sustain price ranges, Price has also been propped with leverage trades. I expect liquidity to eventually seep out of this coin into other projects for pumps. Dont believe the hype.

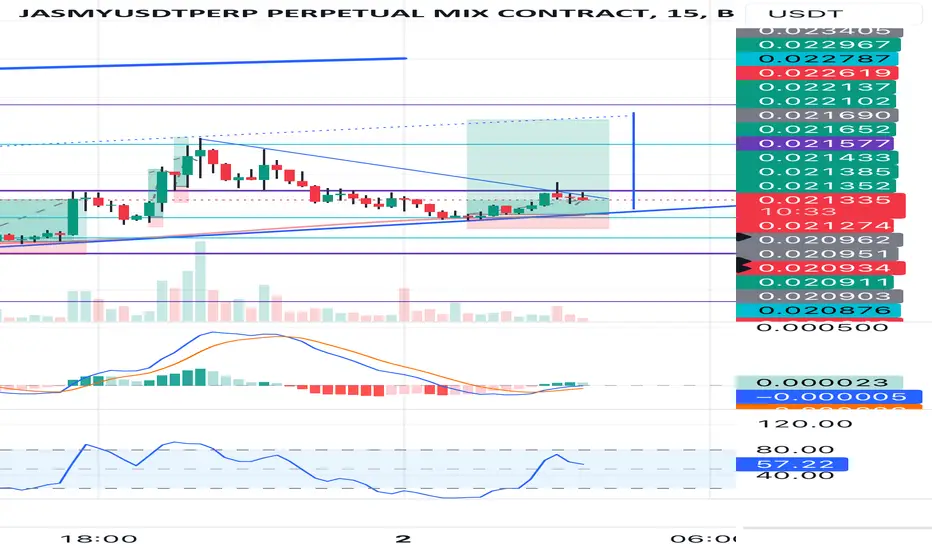
15m JASMY Squeeze into Breakout Daily and 4H trend continues to be upward.
A triangle is forming as a squeeze on 15m. Placed an entry at the bottom of the 1H support that coincides with the diagonal support as well as the 200MA. Stochastic also was in oversold region with a hook up into the blue zone as a potential sign of changing momentum. MACD cross also validates this hypothesis.
After entry there had been a false break/wick at the upper diagonal resistance. I’m expecting the wick as a sign of shorts’ stop losses being liquidated or triggered. This signals more potential up move after an expected follow up retracement.
Volume continues to be slow but the patterns seem to support an upward move after the squeeze and bounce off support as part of normal retracement.