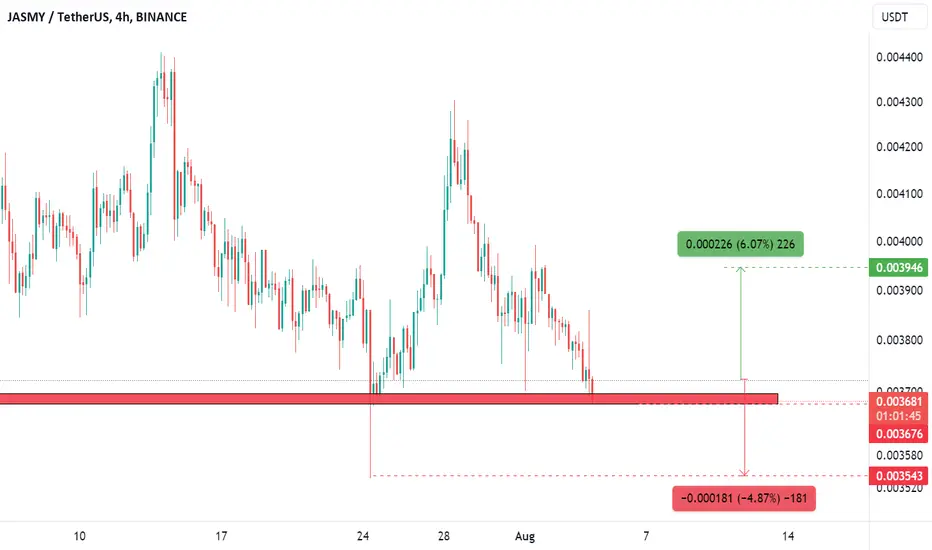
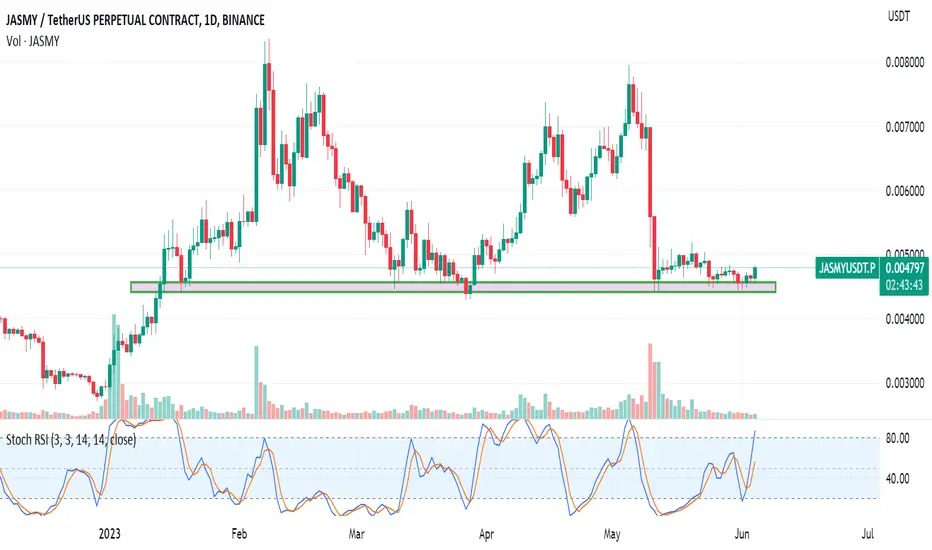
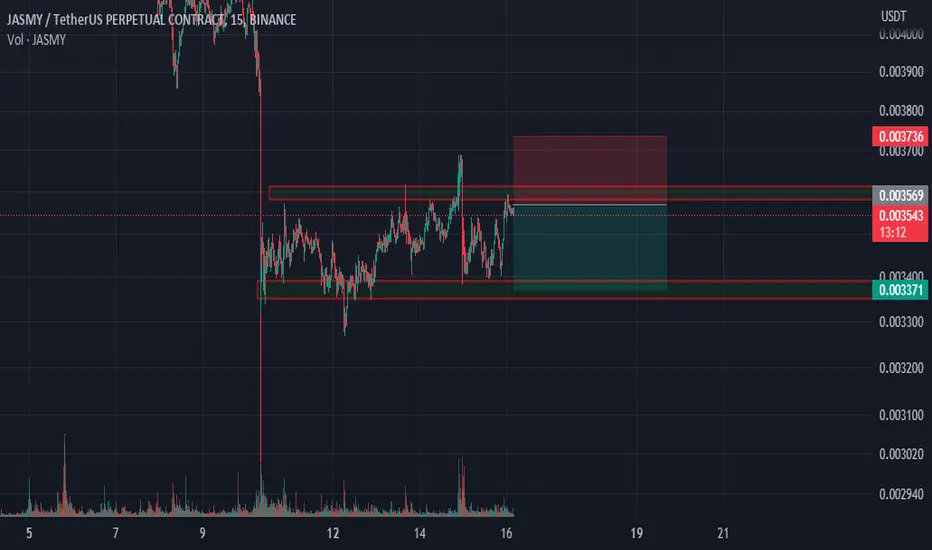
This currency is in an important support range◼️ This currency has reached its 50-day support and with the positive divergence that can be seen, the possibility of 6% growth to the price of 0.004000 is possible for this currency at this time.
◼️ The important support range of this currency is located at the price of 0.003676, there is a possibility of a breakfake for this range.
◼️ But the other range for support is located at 4% lower and at the price of 0.003543, which has already experienced a drop close to this price.
✔️ In general:
There is a possibility of a stronger 6% growth for this currency
JASMYUSDT.P trade ideas

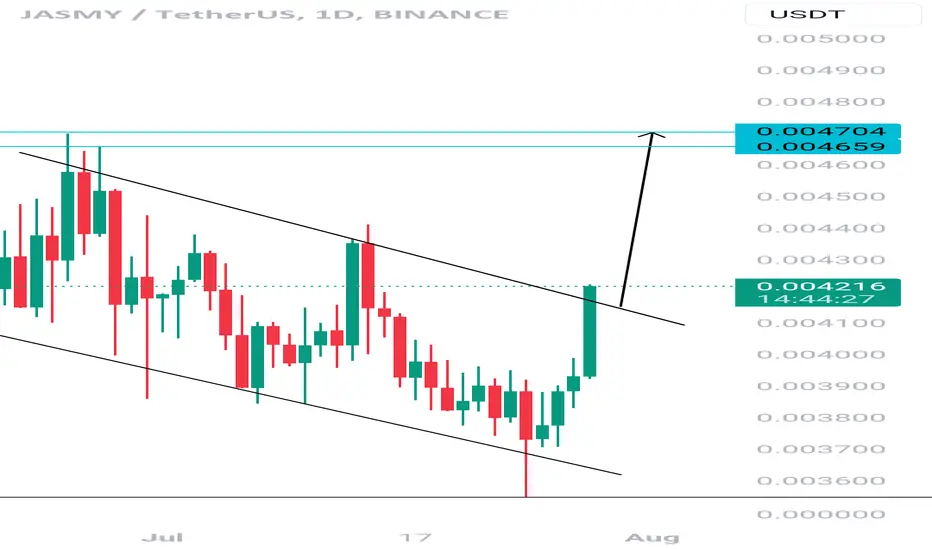
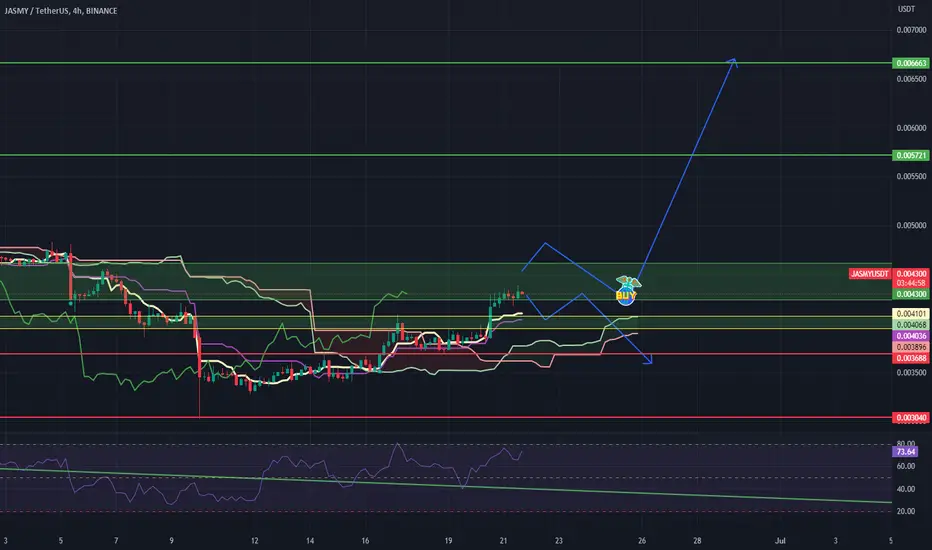
Jasmy Update Jasmyusdt
Chart is looking looking bullish on daily time-frame am expecting a bullish move atleast 15-20%
Note : This is just an idea , do your own research before taking any decision and yes if you are satisfied with our work kindly show your support
Happy trading
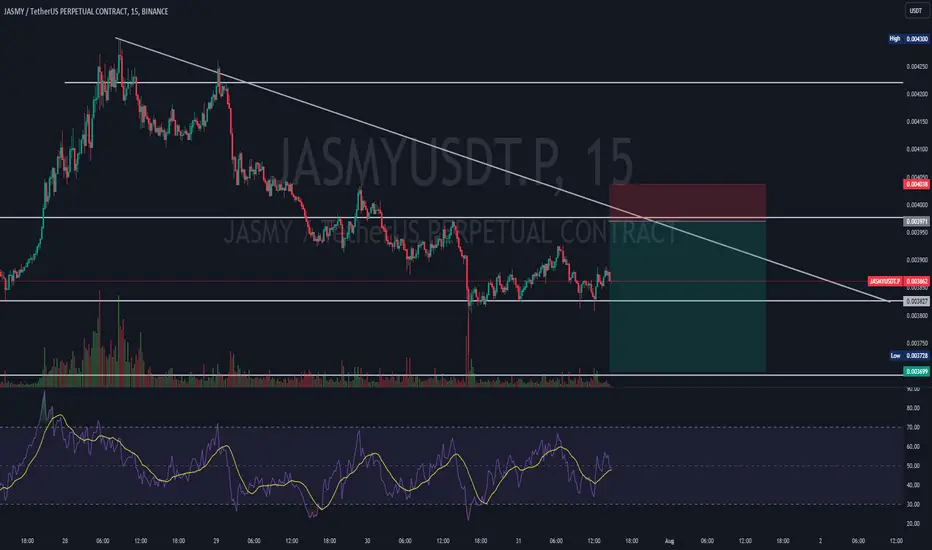
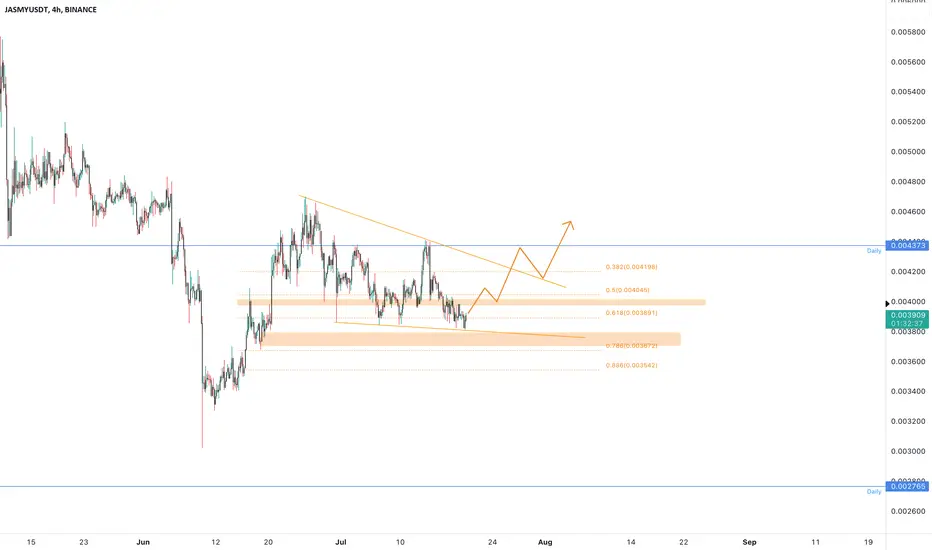
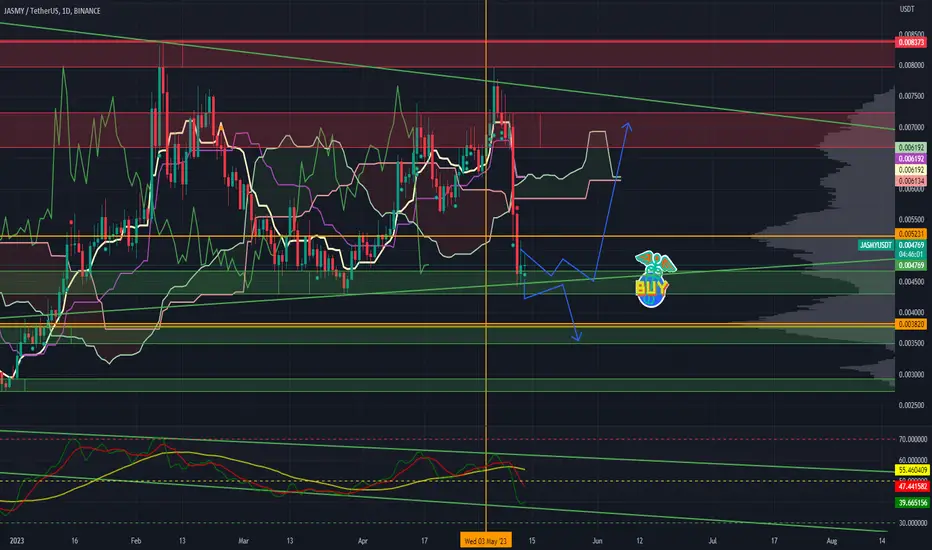
JASMYUSDT is testing the 0.618 Fibonacci levelJASMYUSDT is undergoing a crucial test at the 0.618 Fibonacci retracement level, which is at the 0.0040 price level.
In technical analysis, the Fibonacci retracement levels are commonly used to identify potential support and resistance areas based on the key Fibonacci ratios, with 0.618 being one of the most significant ratios. When the price approaches the 0.618 Fibonacci level, it often acts as a critical decision point for traders and investors.
According to Plancton's rules, a widely-followed trading strategy, a potential long (buy) opportunity is suggested if the price successfully creates a breakout above the current level of 0.0040. A breakout above this level would imply that the bulls have gained strength and are pushing the price higher, potentially leading to further upward momentum.
Traders should be cautious and wait for confirmation of the breakout. It is essential to see a clear and sustained movement above 0.0040, accompanied by significant trading volume, to ensure the strength and validity of the breakout.
–––––
Follow the Shrimp 🦐
Keep in mind.
🟣 Purple structure -> Monthly structure.
🔴 Red structure -> Weekly structure.
🔵 Blue structure -> Daily structure.
🟡 Yellow structure -> 4h structure.
⚫️ Black structure -> <= 1h structure.
Follow the Shrimp 🦐
JASMY Expecting new lows
My primary count suggests that JASMY is currently in an ABC correction. The lack of RSI divergence points to a new lower low soon.
In my trade plan, rallies to the upside are selling opportunities.

Another leap for JASMYThe reaction with the demand zone has been done well, now we have to wait for the pullback phase to support
You can make your purchase as soon as you react to this support in the time trigger
Don't forget to like

short for jassmythe bigger trend is bearish and the price is complete pullback to the FTR and the first leg of ther movment when we see a triiger we can get this short position
Are you agree whit me?

JASMYUSDT 😉 Trading PlansWe could potentially have 3 moves I could forecast.
Bullish scenario
First move would be a break above 0.0046 that would totally mean bulls are taking over but we could potentially see a second move that could be a correction towards previous resistance that has turned into support 0.0042 then the bull move would continue
Targets: 0.0057 - 0.0066
Bearish scenario
Third move we could see it's a bearish correction for that to happen we should see a double top and failed attempt to move higher at around 0.0043 and an impulse move down into the next key levels.
Targets: 0.0038 - 0.0036 or even 0.0030
Let's see how this plays out!
I'll update when I open a position
Regards,
Kina 😉
JASMY bouncing up from a daily demand zone The Daily time frame shows strong demand zone to act as a strong support.
Being confirming this it is highly likely that it will go up.
Make sure to get the details in the lower time frames for any potential entry, if you are planning to take this trade.
ALWAYS EXERCISE PROPER RISK MANAGEMENT BY PUTTING STOP LOSS
Let's see how it will go.
short positionwe recive to a daily base and have CHOCH and exit of the wedge
when the price pullback to break even we can get a short postion
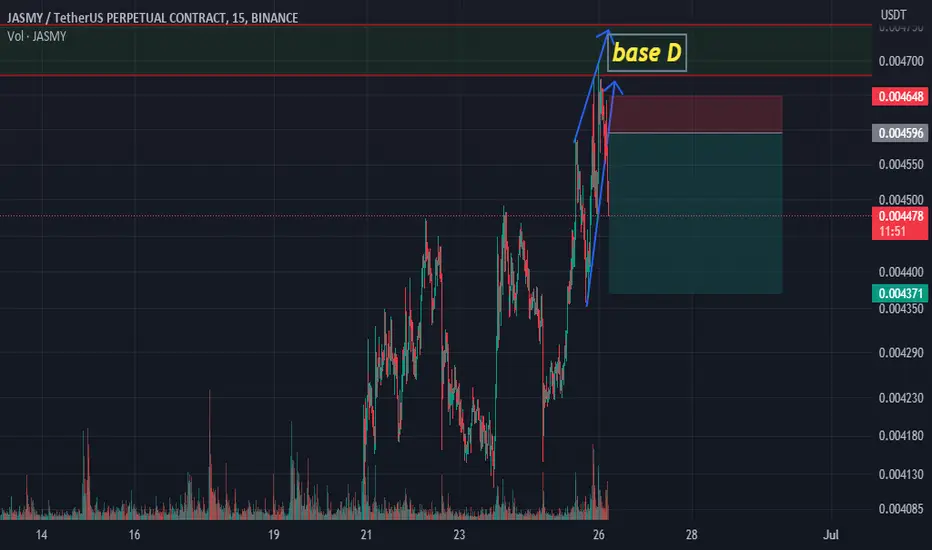
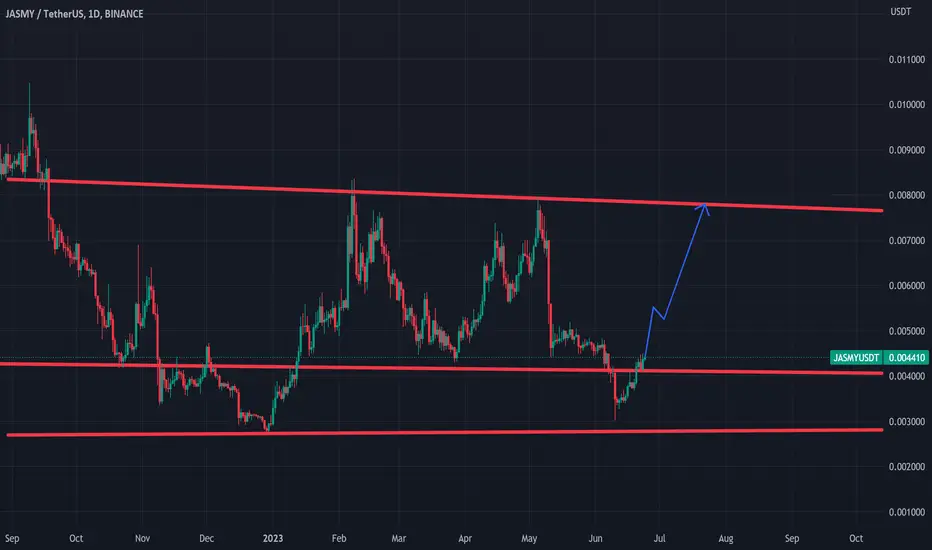
BUY JASMY/USDT NOW!!!!Looking at JASMY its moving towards the main resistance zone am buying from this point and holding up to 0.007 target join now....

buy positionthe TR is break and comlete the pullback and comlete second leg and we can get it for good buy position

Jasmy NEXT possible move here I will explain everything in Chart so please check out and also follow me

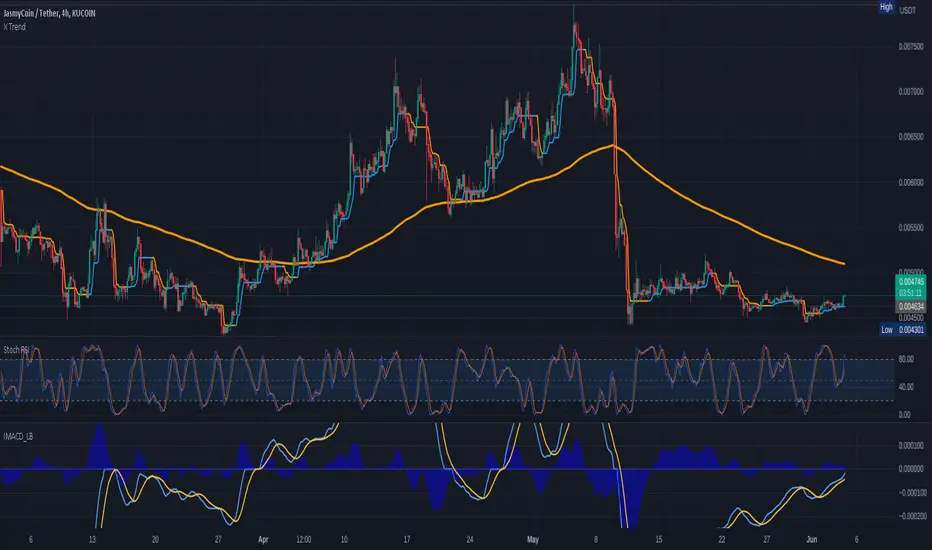
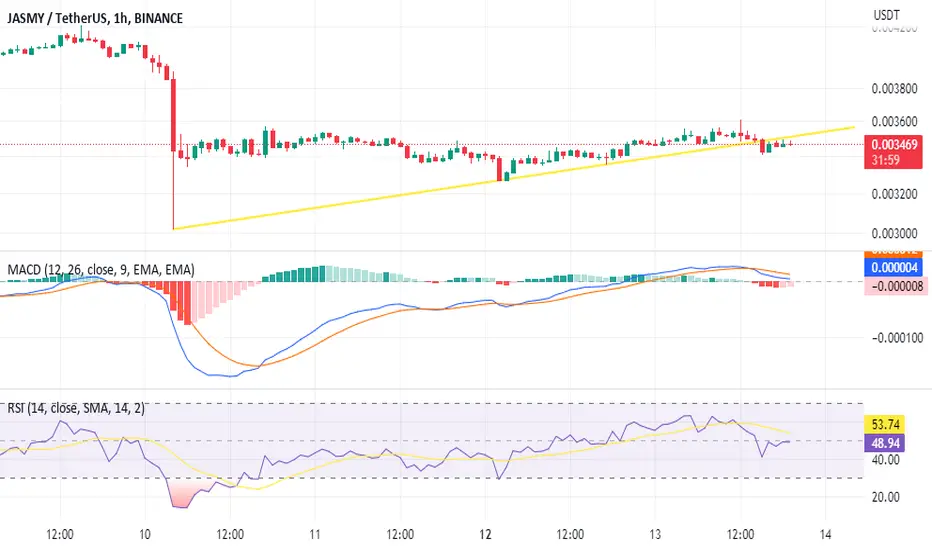
JasmyUsdt ShortThis pair broke through the trend line and came back to touch it from below, looking at the rsi and macd, one can see that it has also lost momentum. look to short the pair where possible.
another trade on JASMY {hight risk} These trades reflect my trading history
Trades will be updated on the same published chart such as Take Profit, Early Exit or Partial Exit.....
STOP LOSS 24H CLOSE
JASMYUSDT - 2 possible scenariosPrice has currently entered into a trading zone which we could try to predict 2 sides according to that it does in the next days or week.
Key zone we are analyzing here: 0.0046 - 0.0042
Bullish if:
Support holds and after a double bottom or inverse h&s, we get confirmation of a breakout from the pattern then we can go long.
Bearish if:
Breaks down the zone then it would go down to the next area which is 0.0034 - 0.0037
Please manage risk accordingly. I'll be updating and following this coin ♥
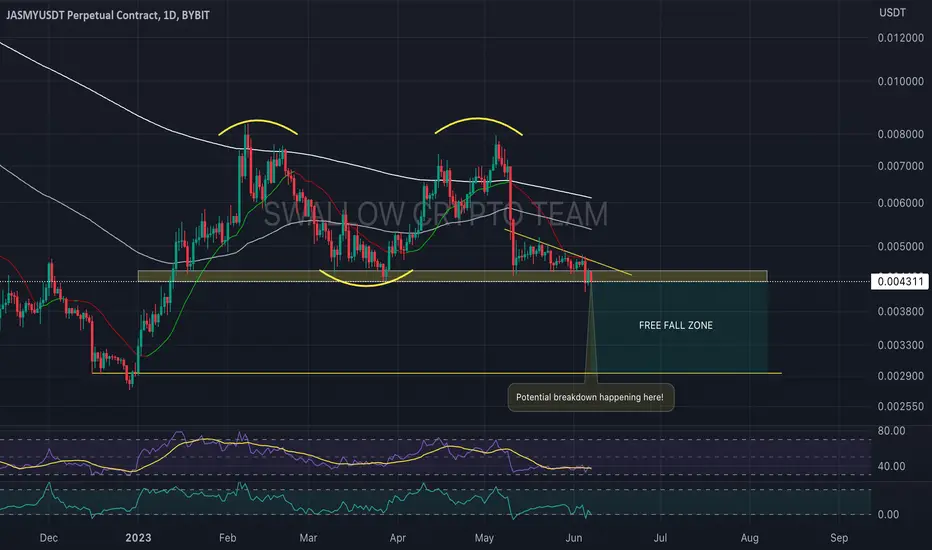
JASMY/USDT seems to be breaking downHey traders 👋
We will be keeping it short here, we see a good potential for a breakdown to happen on JASMY. Re-test has happened and now we need that last conformational breakdown!
If you like ideas provided by our team you can show us your support by liking and commenting.
Yours Sincerely,
Swallow Team
Disclamer:
We are not financial advisors. The content that we share on this website are for educational purposes and are our own personal opinions.
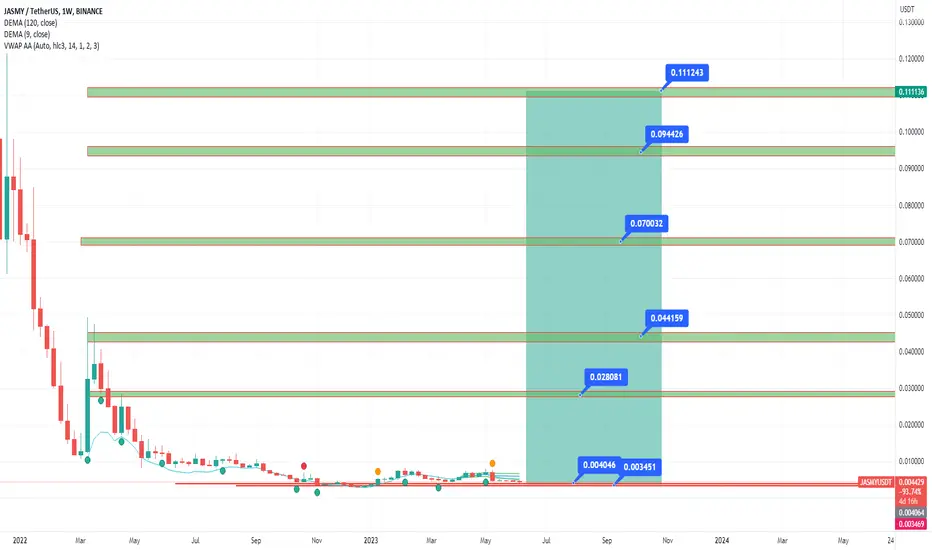
based on volume analysis this is agem buy jsamy usdtaccording to my analysis this token is highly profitable on long term buy with alittle money here and you will become rich in few months may be 10 month or less
JASMYUSDT a new trade idea on jasmyusdt (previous one ignored entry).. buying from the demand zone below the inducement.. see pics for details

jasmy coin :) Jasmy getting it in! bullish currently and rising but today with Bitcoin undecided it'll most likely be a very slow rise but it's good to see regardless after some previous drama ... good for them keep rising :)