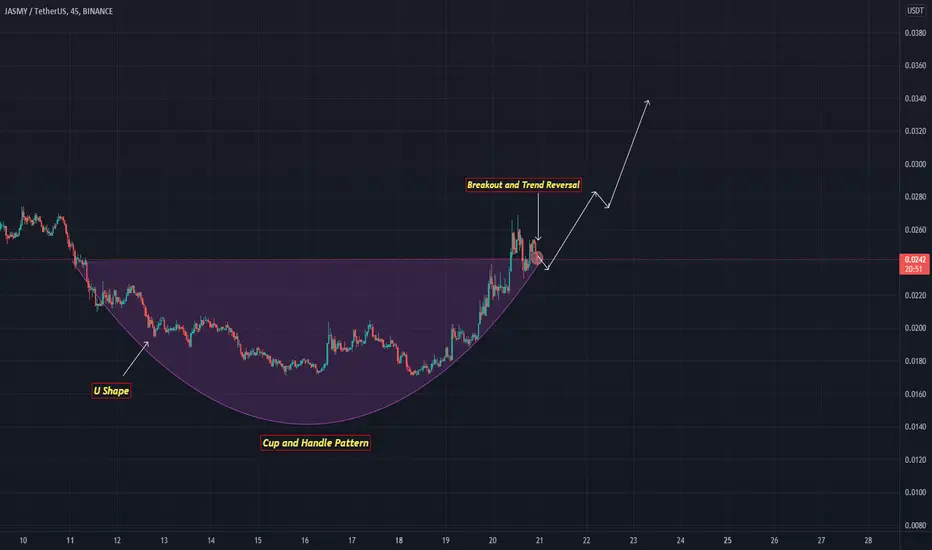
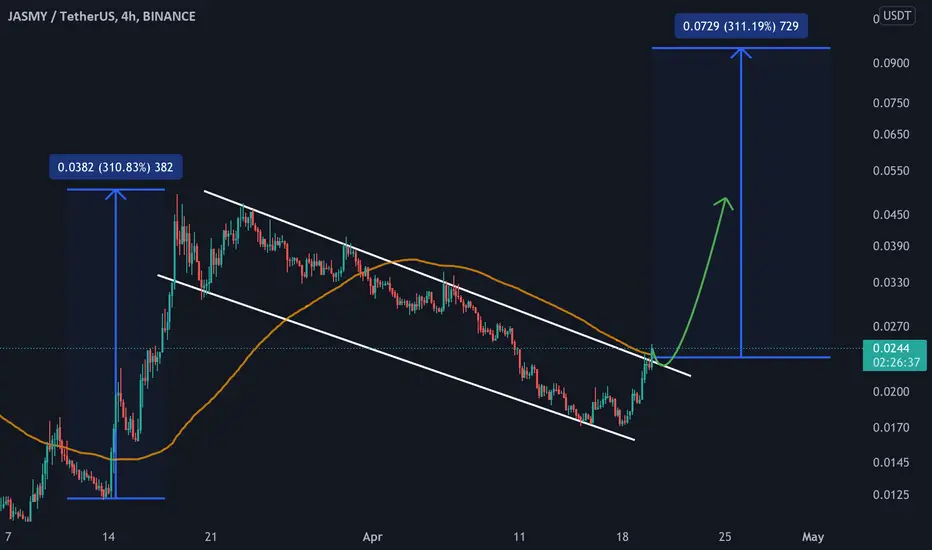
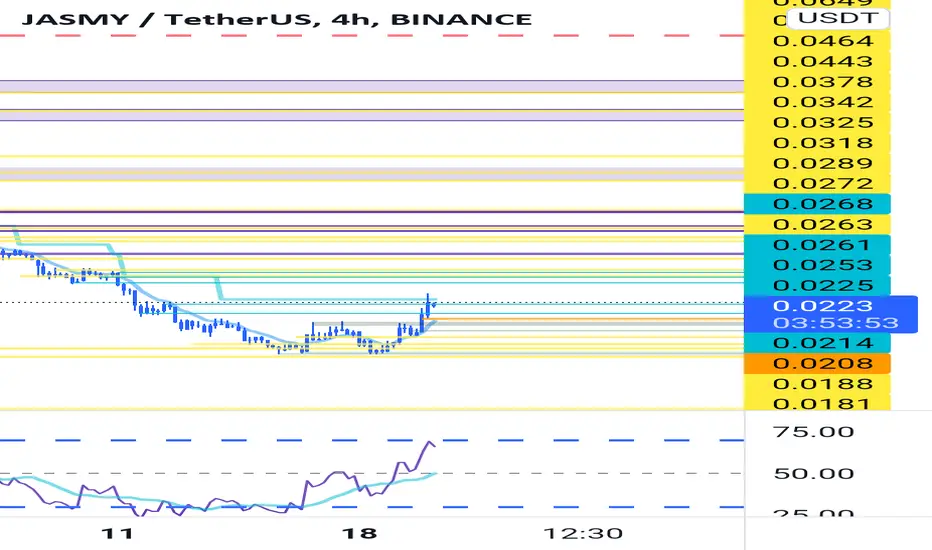
#JASMY BREAKOUT AND RETEST AND READY TO PUMP 350% !Hello, welcome to this JASMY/USDT 4hr chart update by CRYPTOSANDERS.
I have tried my best to bring the best possible outcome to this chart.
Show some support do hit the like button, follow and comment in the comment section. this motivates me to bring this kind of chart analysis on regular basis.
CHART ANALYSIS :
As we can see in the above-mentioned chart that JASMY just broke the channel pattern and currently moving down to retest so at the green zone or the upper trend line we can take a long position for almost 350% in the upcoming days.
Entry:- $0.0240,$0.0260
Traget:- 350%
Stoploss:- $0.02
Remember:-This is not a piece of financial advice. All investment made by me is at my own risk and I am held responsible for my own profit and losses. So, do your own research before investing in this trade.
Happy trading.
Sorry for my English it is not my native language.
Do hit the like button if you like it and share your charts in the comments section.
Thank you...
JASMYUSDT.P trade ideas

JASMY now doing AccumulationVolume more higher than previous high volume, but price can't go up.
I think price now doing Accumulation then make a more higher volume
What do you thinking about? Let me know at the comment. Thanks


We may see the JASMY coin in zones 0.31 DollerWe may see the JASMY coin in zones 0.31 Doller
to test the moving average

JASMY/USDT ways for tradeIntraday setup for purchase and sale of the EGLD asset. The transaction must be accompanied by a short stop, or the purchase should be made in parts at each of the levels.
The goals are minimal, you can carry some higher.
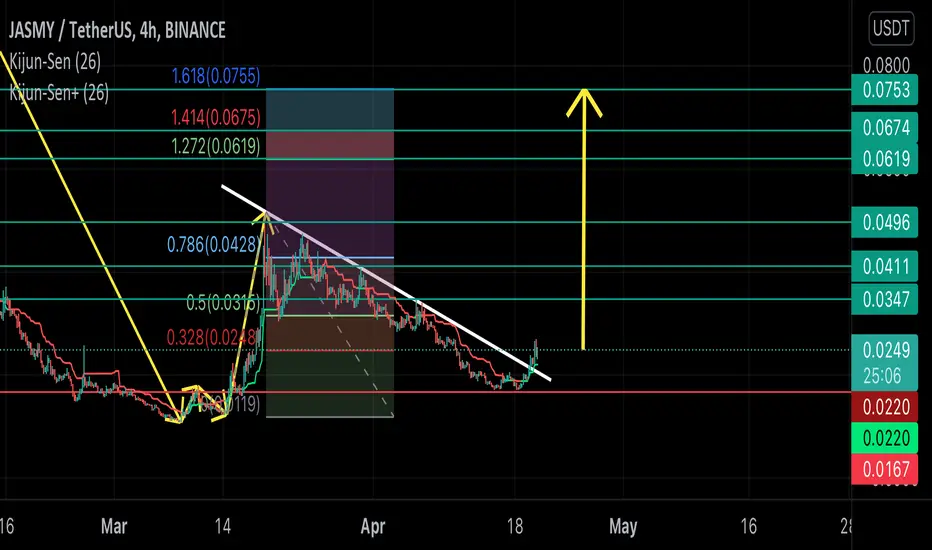
Jasmy Positive and respectful trend and its penetration leads to flight
TP1 : 0.0347
TP2 : 0.0411
TP3 : 0.0496
TP4 : 0.0619
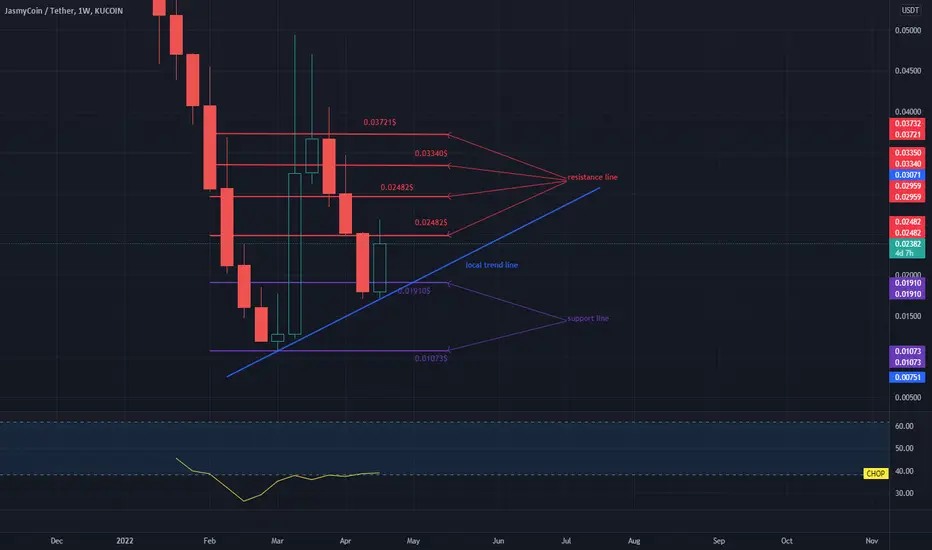
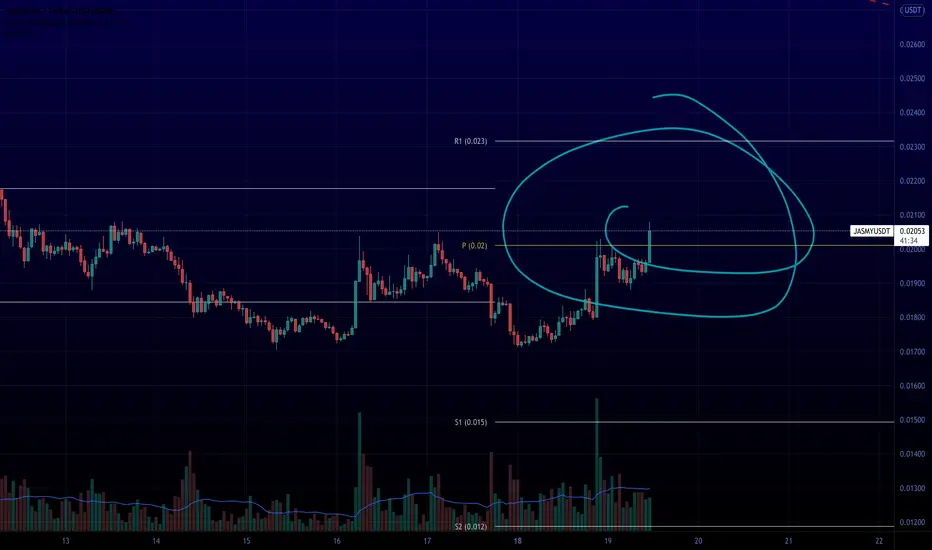
JASMY bounces off the resistance at $ 0.02482Hello everyone, let's take a look at the JASMA to USDT chart on intervale 1 weekend. As you can see, price is moving above the local uptrend line.
Let's start with the designation of the support line and as you can see the first support in the near future is $ 0.01910, if the support breaks, the next one is $ 0.01073.
Now let's move from the resistance line, as you can see, the first resistance is $ 0.02482, if you manage to break it, the next resistance will be $ 0.02482, another one is $ 0.03340 and the next resistance is $ 0.03721.
Looking at the CHOP indicator, we can see that there is very little energy in the 1 weekend interval.
JASMYUSDTJASMY is about to break trendline at H4 TF. It is also forming cup and handle shape which makes it bullish.

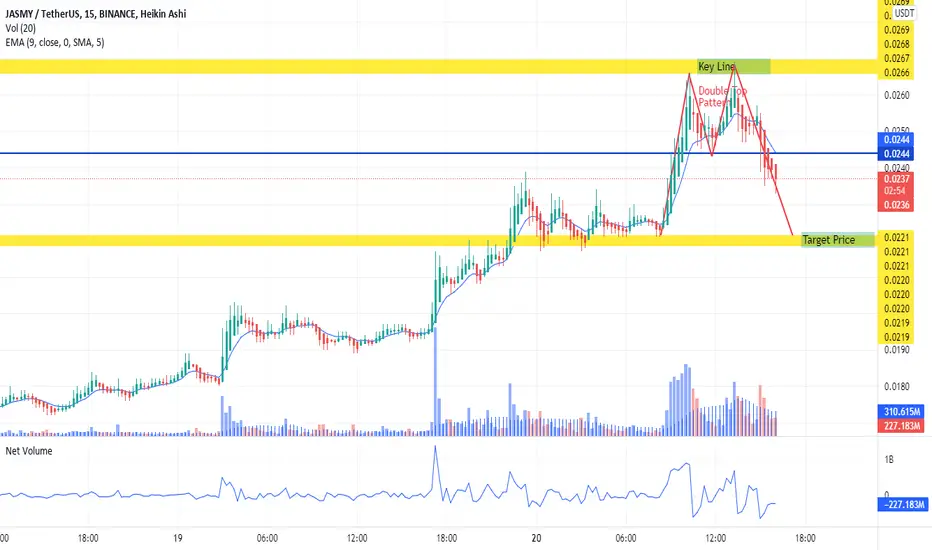
T.A on Jasmy Double top PatternWe have an upcoming dip on jasmy according to this Double top pattern; which is a bearish pattern. i hope you can catch up to this signal and take your profits. Goodluck!! P.S. not a financial advice
+48% profit in 2 days ✅jasmy-usdt
buy : 0.0182 $
sell : 0.0254 $
profit : 42 % done
Congratulations to our team

End of correctionAt this level I see an end of correction targets are on the graph, I will post the stop later.
JasMy possibilities Did saw the bottom and hype into it when everyone FOMO, that the game... Buy the fear and sell the greed!
Over 40% from entry @0.0175
Now currently, Jasmy about breaking the resistance @260, a possible break and close at @280...
We might see price moving to @322, which is the next resistance to contend with...
Generally volume looks pretty good, I see more upside.....
Pls, Not a financial advice....
Kindly DYoR...
If you like my content,
Kindly like comment and follow me to encourage more updates...
Thanks!

JASMY hit rock bottom! Potential long term uptrendIt is not a difficult task to draw a Fib Retracement on the daily chart and explore potential genesis understandings, specially on an asset that has a relatively short history.
Jasmy has clearly hit rock bottom, and now we know where we are and where we will never be again: 0.0100
At the current stage, we can consider a potential yet unclear double bottom. Daily chart is definitely bullish although I would suggest caution when trading Jasmy as Bitcoin does have more negative than positive effect on Jasmy trend lines.
Best trades are long term for maximum gains. Think quarterly at best.
In conclusion, JASMY is a long investment strategy at this point with significant opportunities for scalping.

$JASMY- Just Beginning to Fly NFA:
If you missed the bottom entry at .01,wait for the mini PB at those areas for re-entry because i believe $Jasmy is just starting(see Daily Time frame chart).
This is not a short trade so you have to be patient and wait to reap those resistance as profits.
Good Luck

JASMY BREAKOUT!! READY TO PUMP 300%!! Hi guys, This is CryptoMojo, One of the most active trading view authors and fastest-growing communities.
Do consider following me for the latest updates and Long /Short calls on almost every exchange.
I post short mid and long-term trade setups too.
Let’s get to the chart!
I have tried my best to bring the best possible outcome in this chart, Do not consider it as financial advice.
BUY JASMY/USDT ON SPOT
Entry range:- CMP and add more up to $0.0225
Target:- 300%
SL:- $0.02
This chart is likely to help you in making better trade decisions if it did consider upvoting this chart.
Would also love to know your charts and views in the comment section.
Thank you
JASMY SMALL PULBACK AND THEN MOON???Jasmy performed very well since I posted signal for it ,it went up by 40% and is still going. I think it will reach 3x in next weeks from the signal I posted.
UPDATE:
Jasmy had reacted very well from demand zone as I posted few days ago and had break of structure.
After some coins get in supply/demand zone on bigger tfs ,most of the times they break strucutre(which jasmy did) it pullbacks and retests new demand zone.
After this zone gets retested again, it will align with btc retesting its demand zone and whole crypto market will go insane in next few weeks!
I recommend you do not enter short or long untill it reaches demand zone drawn on chart because its risky in both ways.
After it reaches, you can pretty much go all in with sl below.
Dont use high leverage, you can get insane profits even without any leverage!!!
Chart I posted few days ago:
NOT FINANCIAL ADVICE,JUST MY OPINION!!!

JASMYUSDTPOSSIBLE SCENARIO is to retrace from one of the blue lines and rebound from there to hit the second target, this post just for fun
JASMY CONFIRMED 3X INCOMING!!!As I posted in one of my first charts on profile, jasmy reacted very well from demand zone on 4h tf.
Whats next?
Wait for pullback and retest on new demand zone on lower timeframes( 0.0179-0.0172 area)
This represents change of character on bigger timeframes and break of structure on lower timeframes.
Now price needs to pullback and retest new demand zone so it can continue to make new highs.
Drawn arrow is how I expect jasmy to move in next period. Dont short it at supply zone drawn on chart because it may be broken fast!!!
THIS IS NOT FINANCIAL ADVICE, JUST SHARING MY OPINION!!!

JASMY BREAKOUTNot much of anything in terms of my own charting and TA... I've purposely taken all that out for resolution reasons-
but needless to say-- JASMY IS BREAKING OUT!
♠️🤫🐿
Jasmy prediction jasmy the Japanese monster coin has a big potential to rise up
I'm definitely long
binance will list it soon in future trading so will help it to go up
good luck
