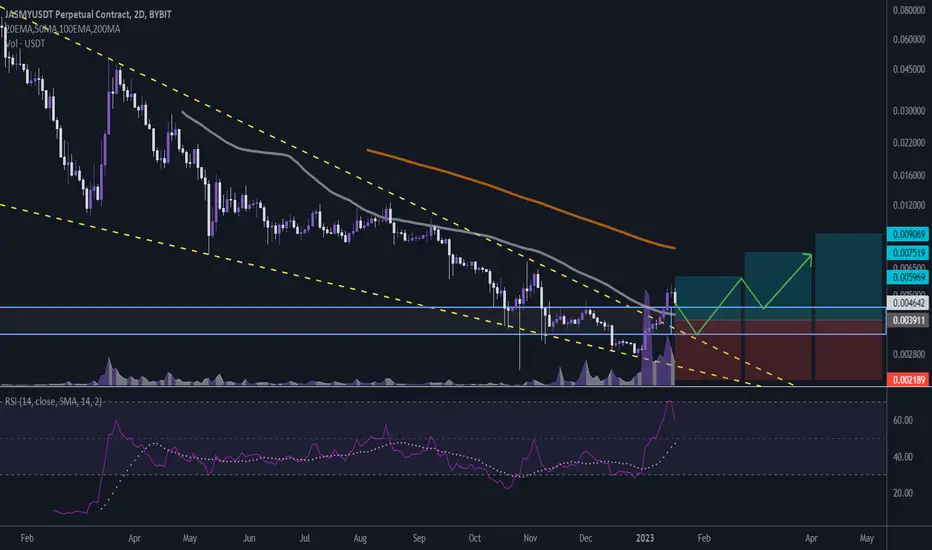
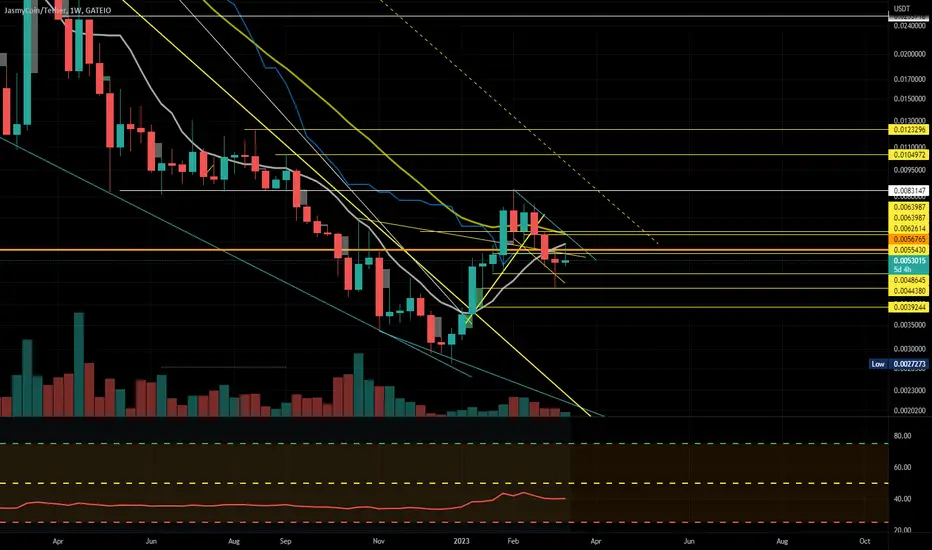
$JASMY/USDT 2D (#Bybit) Big falling wedge breakout & retestJasmyCoin finally regained 50MA support and downtrend seems over, let's swing long on demand zone, targeting 100EMA.
⚡️⚡️ #JASMY/USDT ⚡️⚡️
Exchanges: Binance Futures, ByBit USDT
Signal Type: Regular (Long)
Leverage: Isolated (1.0X)
Amount: 4.5%
Current Price:
0.004642
Entry Zone:
0.004420 - 0.003402
Take-Profit Targets:
1) 0.005969
2) 0.007519
3) 0.009069
Stop Targets:
1) 0.002189
Published By: @Zblaba
Risk/Reward= 1:1.2 | 1:2.1 | 1:3.0
Expected Proft= +52.6% | +92.3% | +131.9%
Possible Loss= -44.0%
JASMYUSDT.PS trade ideas
JASMY about to break Major Trendline JASMY Is again Breaking Major Trend line Which was acting Major Resistance once Reclaim it And we are Good to Test 0.008$ Price Mark Again
Things looking Good for JASMY But
And Incase fail to Break it We can See JASMY Below 0.005$ again
So Good luck

Jasmy Breakout Jasmyusdt
Breakout Confirmed, Expecting 25-40% Bullish Move
Remember: We only give ldea's from our
experience and knowledge, it does not
mean that it will be 100% correct, the
market is always unpredictable, anything
can happen anytime.
Always trade with your own research and
knowledge. If You Are Satisfied With Our
Work Then Join.
Jasmy ShortSHORT Opportunity on Jasmy just before a 0.0064 resistance. I will be going in 2.5% @ 25x with a 1:1 profit target

JASMY USDTJASMY USDT buy long idea
confluence of AST + EWT + Harmonic + SMC
Sequence and conditions of AST completed.
I expect the price will go down on my entries for long as corrective waves of my EWT,
to complete leg D of bullish harmonic, take orders from order blocks.
I expect it will develop HBLD sequence on my blue fib levels
to reverse and push the price up.
details on chart.

JASMY SHOOOOOORT!Some level of overbuying
SQZMOM shows that it won't take too long to go into decline
I think it could be a good quick short.
JASMY 4 HOUR UPDATE ( TECHNICAL )For more updates, please follow my TradingView page, and if you find the content useful, kindly hit the "thumbs up" button to show your support. If you have any queries regarding trading, please feel free to send me a direct message on TradingView. Additionally, please share this content with your friends who may find it beneficial.
Please note that any trading updates provided here are for educational purposes only, and it is always advisable to conduct your own research before making any investment decisions. It is important to ensure that all conditions are met before following any trade plan suggested in this update.

JASMY CAN GO UPPER VERY SOONHi, dear traders. how are you ? Today we have a viewpoint to BUY/LONG the JASMY symbol.
For risk management, please don't forget stop loss and capital management
When we reach the first target, save some profit and then change the stop to entry
Comment if you have any questions
Thank You

JASMY - Further upside expected
Jasmy broke the wedge from my last post with an impulsive wave which is now being corrected.
Higher probability is for another leg to the upside, targeting 0.0057 resistance.
We also have 0.0046 just below which could provide a shield for long trades.

RLinda ! JASMYUSDT-> Attempt 1. Trend change phase JASMY breaks through the resistance of the descending range. Price updates the 1-week high and forms a retest. What to expect from the bulls?
The coin breaks through the 0.0049 level and forms a consolidation above the level. There is a chance of decline to the previously broken resistance line, but the fact that the price is in the trend change phase already allows us to look for areas to open the deal.
Consolidation above the level of 0.0049 opens us the potential for growth. The medium-term target is the resistance level 0.0058, the long-term target is the liquidity zone 0.0068
Regards R. Linda!

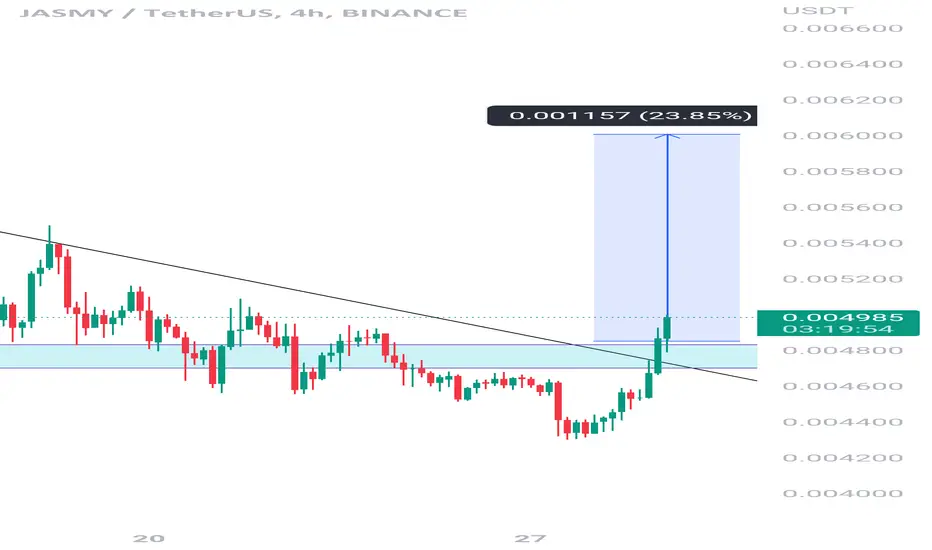
Jasmycoin Breaking descending Channel Breaking descending channel in h4 timeframe incase Of successful Breakout expecting 40 to 45% Bullish Move

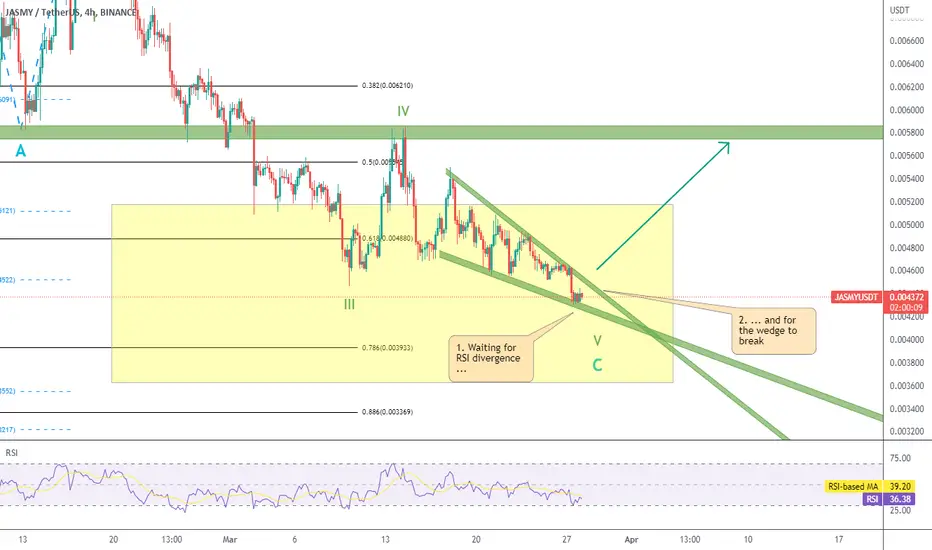
JASMY - Ending diagonal in playEven with prices falling since early February, I believe there is short-term hope for bulls.
Price is forming an ending diagonal (wedge formation), which in my primary count is wave V or wave C.
I'm waiting to see RSI divergence on the 4H chart, and a wedge breakout, for a long trade.
MOST MEN LIVE LIVES OF QUIET DESPERATION.We all know how price action works.
My message to you is look at the chart and see the patern.
We can see in this chart that there is volume and there is money in this coin.

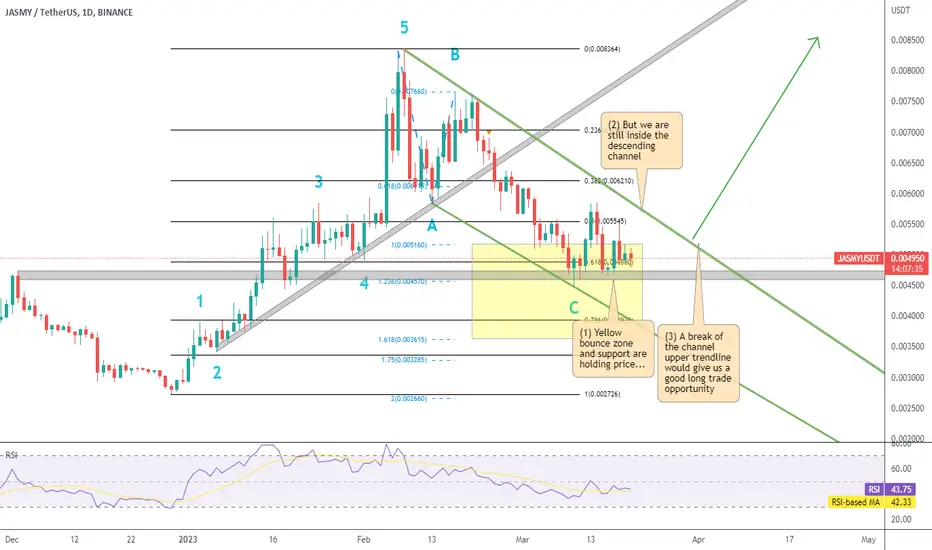
JASMY - Expected levels are holding price
JASMY price action has been sideways for the last 10 days, but I see the following key points to be noted:
Yellow Bounce Zone and Support: Price is being sustained by a yellow bounce zone and 0.0046 level acting as strong support. This prevents the price from falling further and provides a solid foundation.
Descending Channel: Despite the support, Jasmy remains inside a descending channel, indicating a prevailing bearish trend.
Break of the Upper Trendline: If the price manages to break through the upper trendline of the descending channel, it could signal a potential long trade opportunity, as the breakout might lead to a trend reversal or a significant upward move.
Jasmy Next ! stormy dayshi Jasmy can climb easily, I think if Bitcoin is green, maybe the first step is 0.01
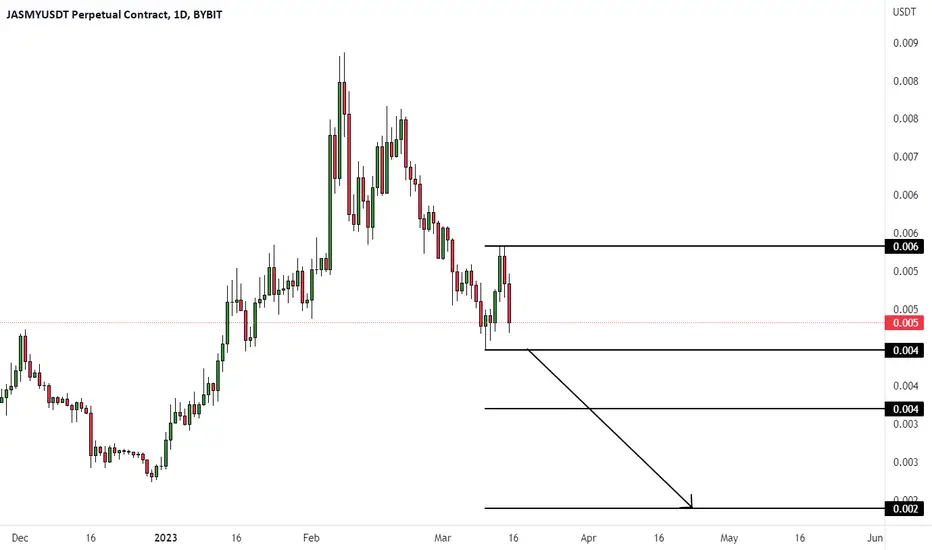
JASMYUSDT (Daily) - Bearish breakoutHi Traders
JASMYUSDT (Daily Timeframe)
The market is in a downtrend and we are waiting for an entry signal to go SHORT below the 0.0045 support level. Only the upward break of 0.0059 would cancel the bearish scenario.
Trade details
Entry: 0.0045
Stop loss: 0.0059
Take profit 1: 0.0036
Take profit 2: 0.0024
Score: 4
Strategy: Bearish breakout
Jasmyusdt BTC CRYPTO WAKANDAWhat i really wish for; in the coming days after cpi
Jasmyn protocol exponential growth ahead
Now we are all aware that we are accumulating liquidity both side of the market
I wish to stay Neutral But an Old WISE MAN ONCE SAID
GO SHOPPING WHEN THERE IS BLOOD IN THE STREET
LMAO WARREN
ICT STUDENT

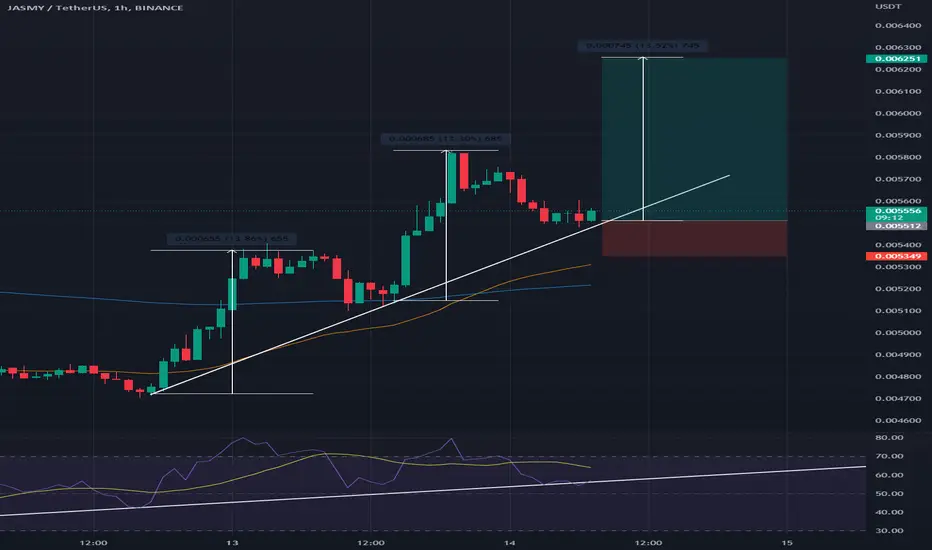
Jasmy looks delicious for a long Hi friends, I just checked out Jasmy Long and it looks very promising, respecting the trendline. The RSI is also indicating a potential pump from the trendline.
I'm expecting a 13% increase from here to .006251
Follow me for more charts
and please don't forget to like :)
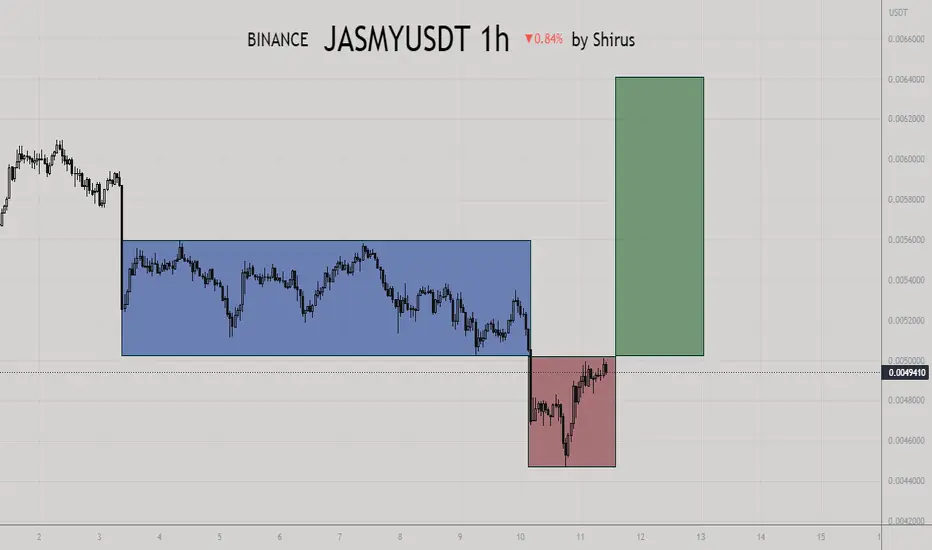
JASMYUSDT 1H: INSIGHTAnalysis:
ICT Power of 3 spotted in JASMY 1H timeframe. Not a signal, enter at your own risk; no confirmation, no entry.
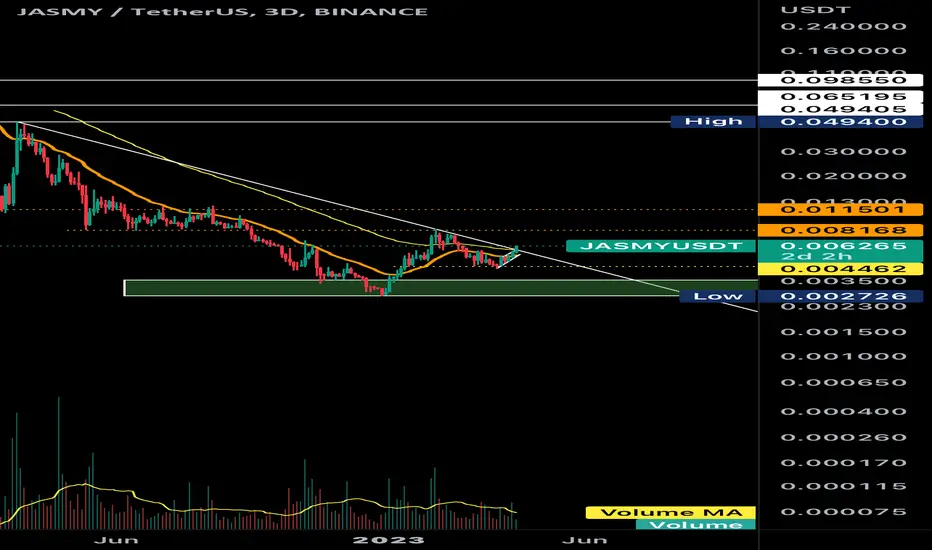
JASMYUSDT wants the bounce?JASMYUSDT is forming a falling wedge pattern on the 0.005 support area, which could potentially provide a bullish signal for traders.
A falling wedge is a chart pattern that occurs when the price of an asset forms a series of lower highs and lower lows, but the range between the highs and lows narrows over time. This creates a wedge-like shape on the chart, and is typically seen as a bullish reversal pattern.
In the case of JASMYUSDT, the falling wedge is forming on the 0.005 support area, which means that the price has been consistently testing this level but has not been able to break below it. This could indicate that there is strong buying pressure at this level, and that traders are looking to enter the market.
For a potential bullish breakout to occur, the price of JASMYUSDT needs to create a breakout from the 0.006 resistance level, which has previously acted as a key level of resistance. If the price manages to break above this level and confirm it as a new support level, this could provide a strong bullish signal for traders.
According to Plancton's rules, a set of technical analysis rules used by traders, a breakout from the falling wedge pattern combined with a confirmed breakout above the 0.006 resistance level could indicate a new long position for traders.
–––––
Follow the Shrimp 🦐
Keep in mind.
🟣 Purple structure -> Monthly structure.
🔴 Red structure -> Weekly structure.
🔵 Blue structure -> Daily structure.
🟡 Yellow structure -> 4h structure.
⚫️ Black structure -> <= 1h structure.
Follow the Shrimp 🦐

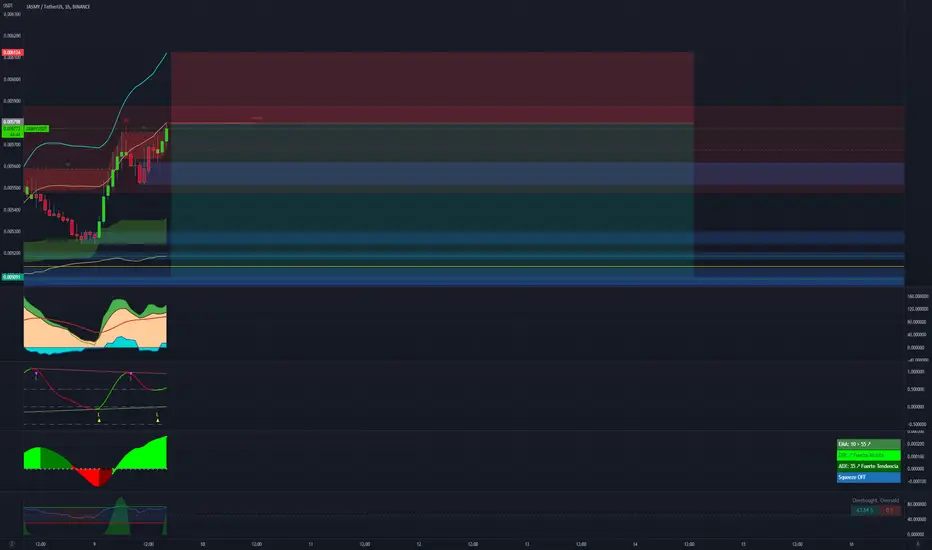
JASMYUSDTPERP LONGJASMYUSDTPERP 1H TF is in bullish trend creating higher highs and higher lows, we can take a long entry for this pair as Entry, SL & TPs are mentioned on the chart.
