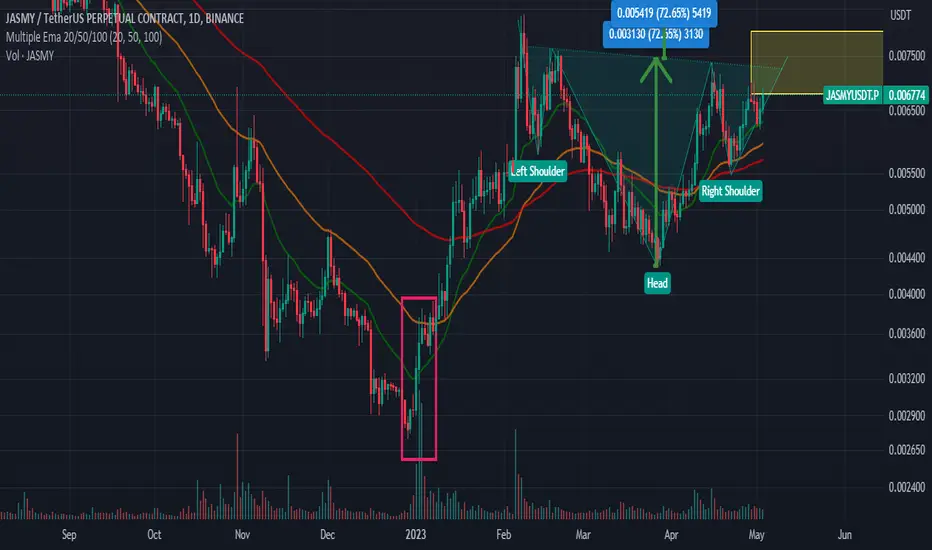
JASMY 1D LONGGreetings, I am drawing only for learning purposes, do not take into account, but it is useful to browse. If you comment, I will also learn, I am not capable of giving advice to anyone.
If you look at the volume in the area I marked with pink, it has a nice volume.
The area I have marked in yellow needs to be approved. Of course, if our locomotive BTC allows, I will set a target if the approval is completed.
JASMYUST trade ideas
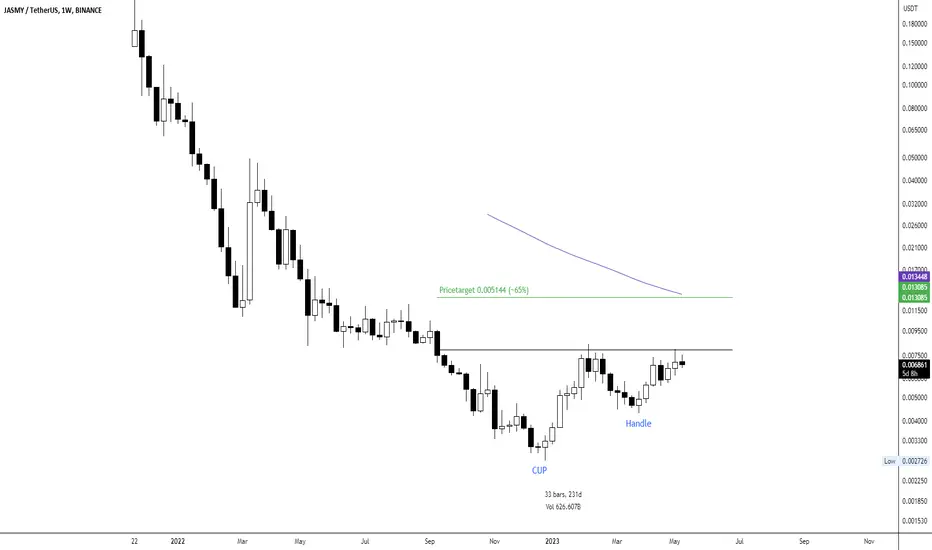
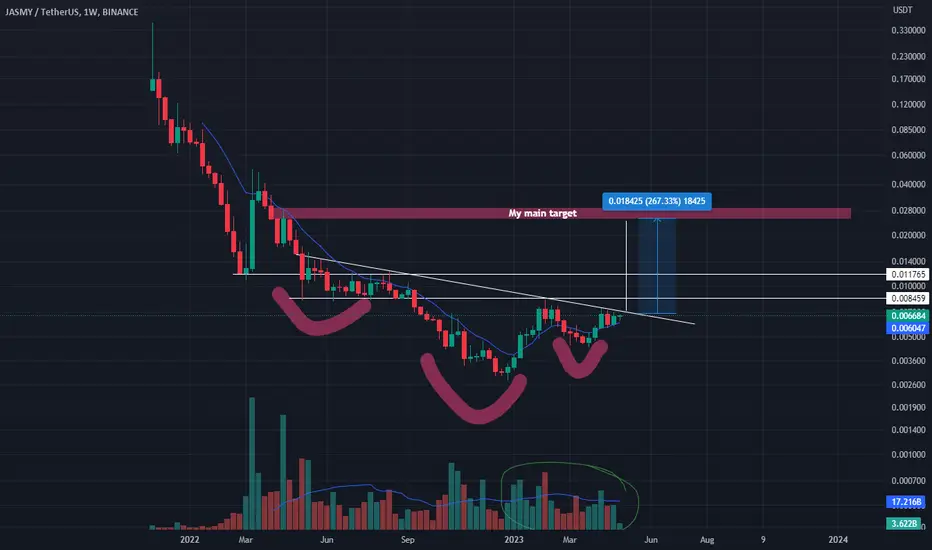
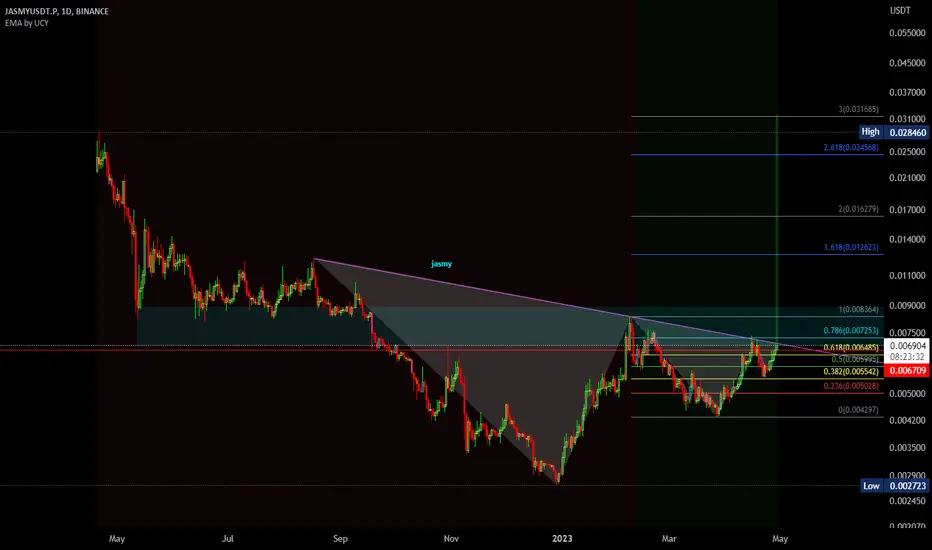
JASMY/USDT WCA - Cup and Handle Reversal PatternHello and thank you for taking the time to read my post. Today, we analyze the chart of JASMY/USDT on the weekly scale, focusing on an interesting price pattern known as the "Cup and Handle Pattern." This pattern suggests that JASMY/USDT could be signaling a potential bottoming and reversal after a downtrend.
Cup and Handle Pattern:
The cup and handle pattern is a bullish continuation or reversal pattern that occurs in both uptrends and downtrends. It is characterized by a rounded bottom, called the "cup," followed by a smaller consolidation, called the "handle." The pattern is completed by a horizontal line, known as the breakout level, which connects the high points of the handle. In a nutshell, the formation of the cup and handle pattern signals a potential continuation or reversal of the current trend.
Analysis:
Since 20/11/2021, JASMY/USDT has undoubtedly been in a downtrend. However, the cup and handle pattern on the chart could indicate a potential bottoming signal and reversal of the downtrend. As classical chart analysts, we can immediately recognize this pattern, with the rounded bottom forming the "cup" and the smaller consolidation forming the "handle." A horizontal line at 0.007931 serves as our breakout level, which we want to see surpassed.
It's important to note that the 50 EMA is still far from signaling a bullish environment. Therefore, it is crucial to carefully study and observe the price pattern. However, if a breakout occurs above the horizontal line, we can expect a price increase of approximately 65%.
Conclusion:
The JASMY/USDT chart analysis highlights the cup and handle pattern as a potential bottoming signal and reversal of the ongoing downtrend. Traders should closely monitor this pattern and the breakout level for any signs of a breakout. As always, it's essential to consider risk management and proper position sizing when trading based on chart patterns.
Please note that this analysis is not financial advice. Always do your own due diligence when investing or trading.
If you found this analysis helpful, please like, share, and follow for more updates. Happy trading!
Best regards,
Karim Subhieh
Jasmy Higher timeframe Jasmyusdt
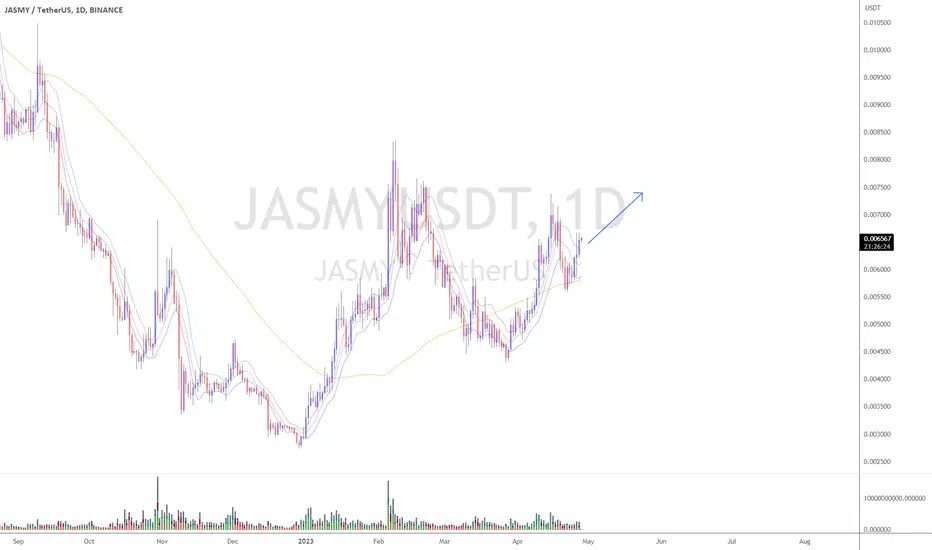
Chart look ultra bullish on higher time-frame
Breakout already confirmed retest is in process incase of succesful retest expecting massive bullish rally
Jasmy Getting Ready For Moon Jasmyusdt
As we mention in previous analysis jasmy successful breakout done retest is in process incase of succesful retest expecting massive bullish move

Breakout, retest. BullishAfter yesterdays breakout, we are witnessing healthy correction.
That’s the textbook pattern you will learn about in the first grade on your first lesson.
Bullish for traders and investors. $0.012 in play.
NFA

Jasmy retest of 0,0083Hello friends, so we are waiting to see what will happen with BTC, if it will be a rocket or a spectacular crash. Anyway, in my spare time I test Jasmy and long with higher LV.
Hold on to your hats it's going to be a ride.
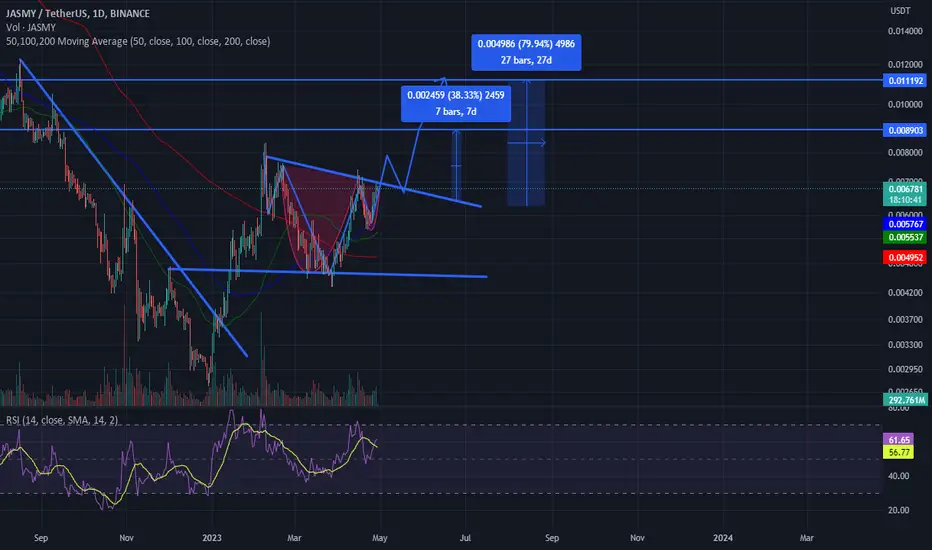
JASMYUSDT inverse head and shouldersJASMYUSDT broke through a dynamic resistance level, indicating that buyers have gained control of the market.
However, before a new bullish impulse can occur, it is likely that the price will retest a Fibonacci level, which is a technical analysis tool used to identify potential support and resistance levels based on the Fibonacci sequence. This retest would serve as a confirmation of the breakout and give traders an opportunity to enter long positions at a lower price point.
According to Plancton's rules, a well-known trading strategy, traders should consider going long on JASMYUSDT after the price successfully retests the Fibonacci level and reaches a static 4-hour resistance level.
n summary, JASMYUSDT has broken through a dynamic resistance level, and traders should be on the lookout for a potential retest of the Fibonacci level before a new bullish impulse. Following Plancton's rules, a long position may be considered once the price reaches a static 4-hour resistance level.

Jasmy/usdt Breakout Jasmyusdt
As we discus recently, jasmy is moving as expected
Breakout already confirmed we will wait for retest if retest will successful I am expecting 90-120% Bullish move incoming days
JASMYUSDTDisclaimer: This chart and analysis are not meant to be, and do not constitute financial, investment, trading, or other types of advice or recommendations. #DYOR

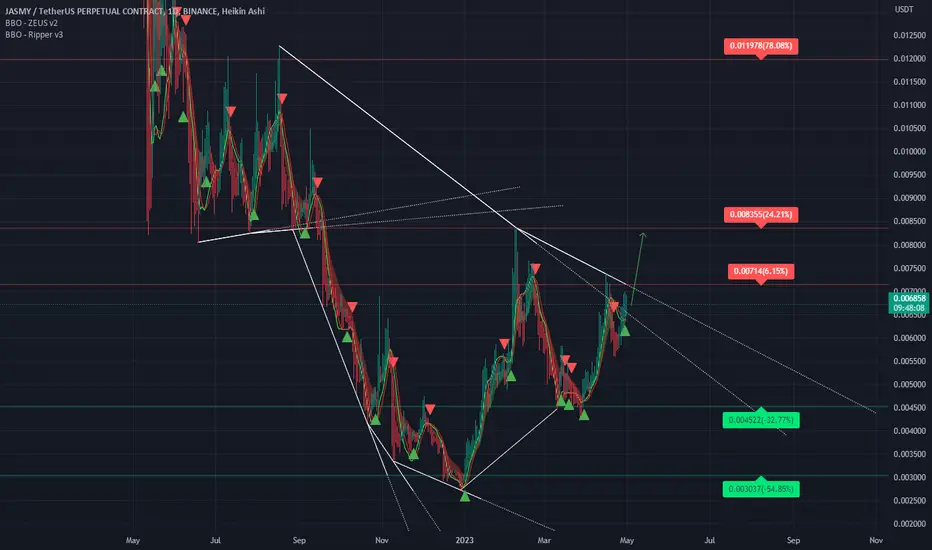
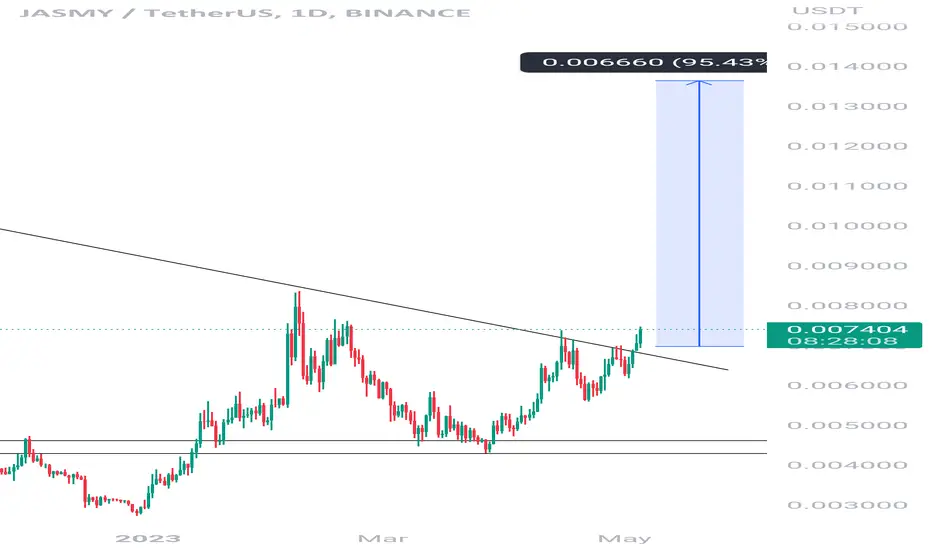
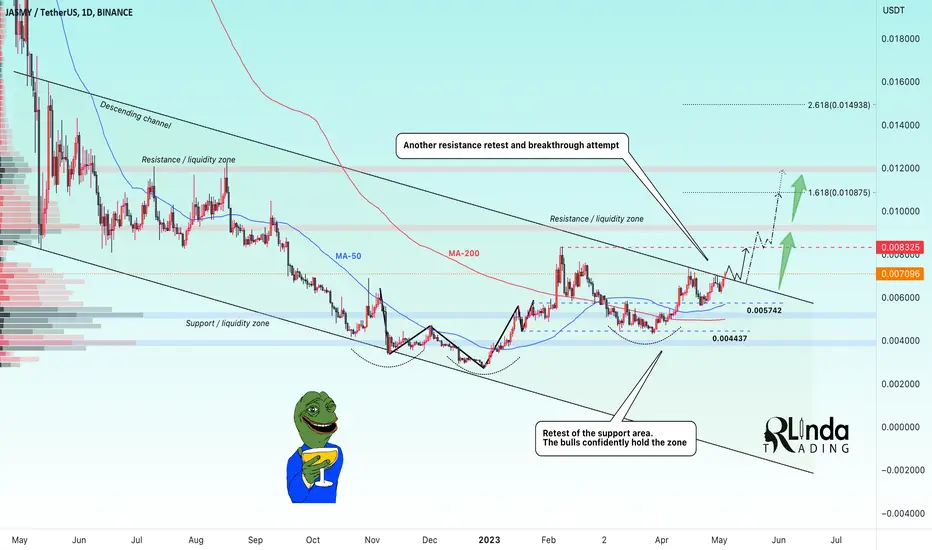
JASMYUSDT → Attempted breakthrough. A chance of success JASMYUSDT forms another retest of the strong resistance line. If the daily candlestick closes in the green zone, the growth is likely to continue with the subsequent achievement of our goals.
The previous attempt to break through the resistance resulted in the retest to the strong support at 0.005742.
If you pay attention to the forcing support, we can assume that the whales were actively gaining liquidity in these areas.
Another retest of resistance is formed (counter-trend movement) and there is an attempt to break through the resistance.
Strong support: 0.00675 and 0.00574.
Strong resistance: descending line (channel boundary), level 0.008325 .
I expect that this time the breakout attempt may be successful. Consolidation of the price above the resistance will form bullish potential with further growth to 0.008325 and 0.01200
Regards R. Linda!
JASMY READY TO FLIGHTVirtual money has high profits and high RISK. THIS IS NOT AN INVESTMENT PROPOSAL. My personal opinion.
If you find this useful and want more FREE guesses.
Please show your support.
Press the Like button.
Leave your feedback to us in the comments section!
Thank you very much for your support.
Let us know how you see this opportunity and forecast in the comments.

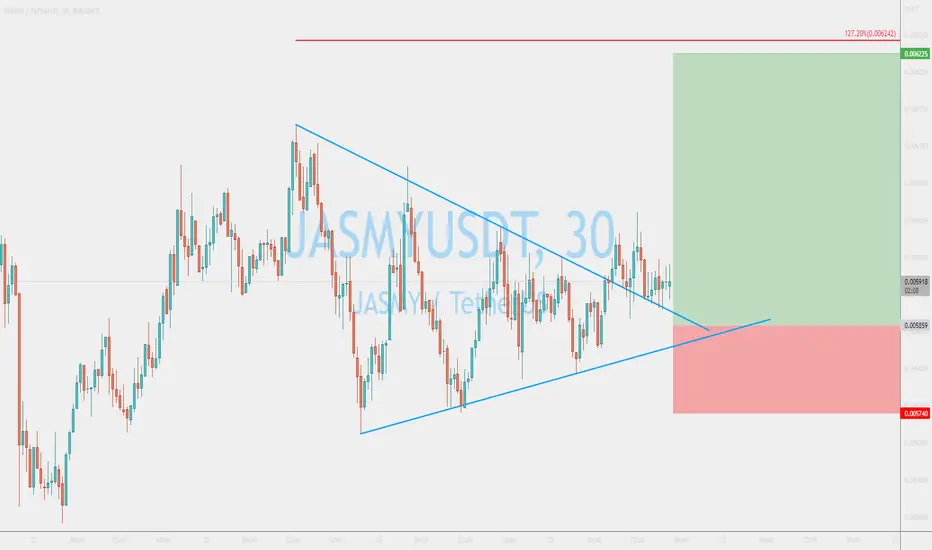
JASMY BREAKOUT Eminent Jasmy is Respecting this Symmetrical Triangle for More than 2 weeks And finally Price Reach to Certain Level where breakout is eminent in Next few days
Jasmy still Prime to Test 0.0083$ and then 0.012$ in case Breakout if break down first Major support 0.0058$ Good luck Guys

JASMY is ready for 200-300% short term pump!!Hi dear community and my loyal followers, as you see my RAD pumped more than 200% which I posted earlier. Now I think it's Jasmy's turn to melt faces. As you see I expect this Inverse H&S pattern to play out after breaking major trendline and pump 200-300% with huge green dildo candle. DOn't be surprised if Jasmy jumps 100-150% in a single day. BTW past 3-4 months interest in Jasmy has been increased which proves buying volume.
Time to Buy Jasmy 40-70 % profitJasmy is making Head and sholder and is going to give 40- 70 %profit in next two weeks
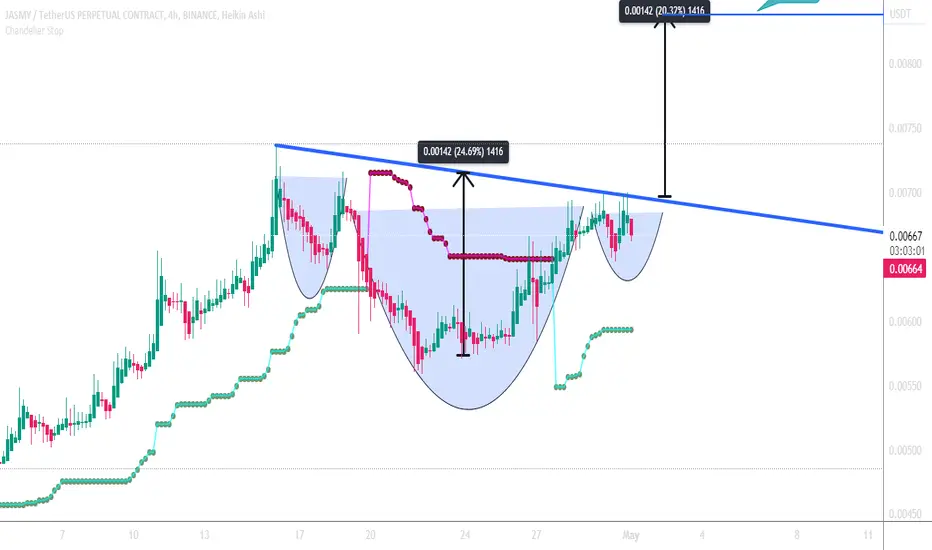
Jasmy 4 hr time frame H & SHellow foks
today i find jasmy four hour time frame INVERTED HEAD AND SHOLDER PATTEERN
IF BREAK THE TREND LINE TARGET 1 IS POSSIBLE TO ACHIVE
OR BELOW THE PRICE CONTINUE AGAIN WE GO TO SHORT ORDER TARGET HEAD SUPPORT LINE
TOMMOROW BTC MOVEMENT BASED ON THIS ORDER BLOCK
IF ANY THING I MISSED PLEASE PUT YOUR COMMENT BELOW
Thanks and regards
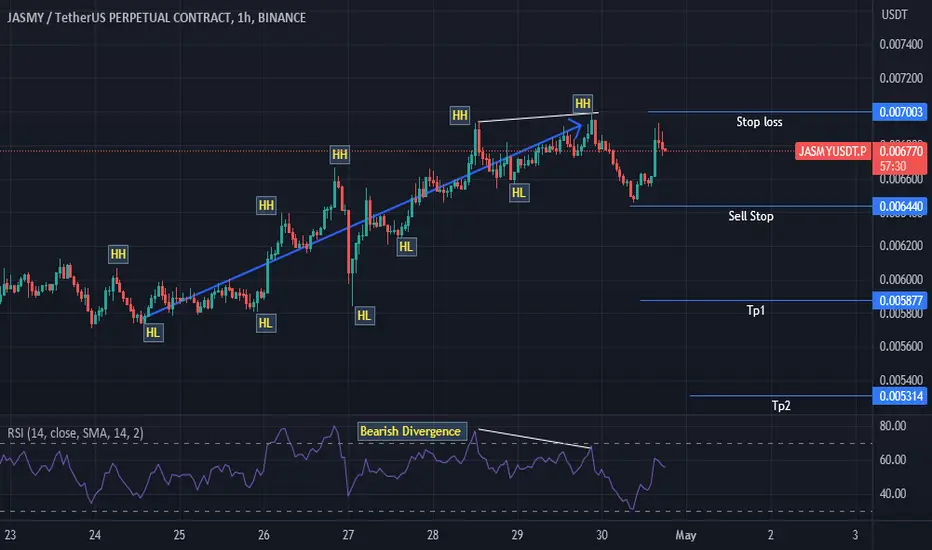
JASMYUSDTHello Traders,
Hope all are good, we can a recent bullish trend in here which is likely to come to an end as bearish divergence can be seen and unable break the last high and successfully broken last low. We can place an sell stop entry as per marking on the chart.
Cheers.
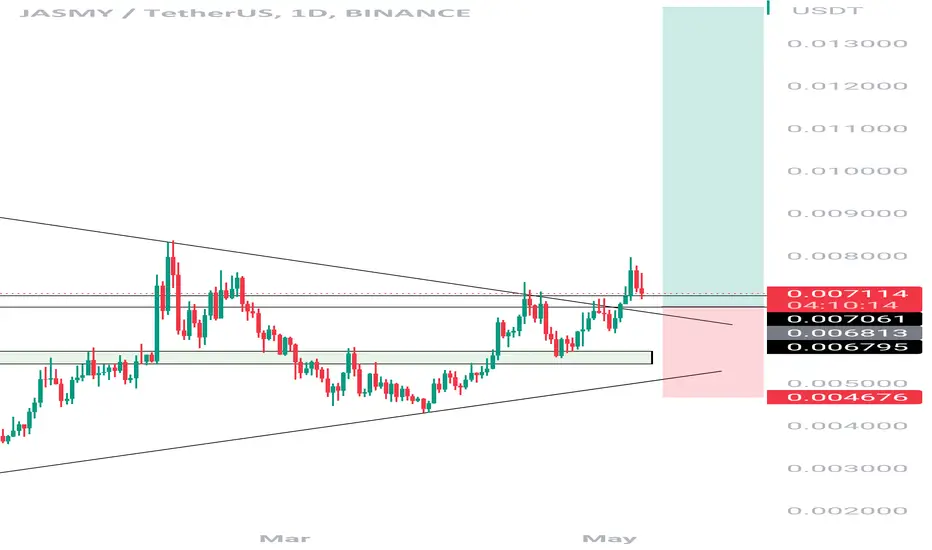
🔥 JASMY Triangle: Consolidation ExpectedJASMY has been trading inside this triangle pattern since the start of the year. In my view, it's more than likely that JASMY will continue to trade within this pattern.
However, the longer-term trend is still bullish, so a bullish break out is expected at some point in the future.
Ideally, we move back towards the bottom of the pattern for a potential bounce entry.

Crypto Jasmy (Will it go higher?)
View On JASMYUSDT (18 Apr 2023)
JASMYUSD is in
* Bullish in short term (Intraweek)
* Bullish in Mid term (1 to 3 months)
* Neutral in Long term (3 months onward)
We are seeing strong Bullish conditions start to emerge and soon it shall reach 0.007.
The next ultimate resistant will be the region of 0.0075~0.008.
DYODD, all the best and read the disclaimer too.
Feel Free to "Follow", press "LIKE" "Comment".
Thank You!
Legal Risk Disclosure:
Trading crypto, foreign exchange or CFD on margin carries a high level of risk, and may not be suitable for all investors.
The high degree of leverage can work against you as well as for you.
Before deciding to trade foreign exchange you should carefully consider your investment objectives, level of experience and risk appetite.
The possibility exists that you could sustain a loss of some or all of your initial investment and therefore you should not invest money that you cannot afford to lose. You should be aware of all the risks associated with foreign exchange trading, and seek advice from an independent financial advisor.
JASMYUSDT fast pushAfter breaking above the triangle, the probability favors the short-term uptrend. We have a buy limit order, slightly below the current price.
JASMY - Still Bullish
The upside expected from the previous post played out perfectly, with a test and break of green 0.57 resistance.
This resistance, now support, is holding price so far, and we have a valid count for green wave IV . As long as green wave I stays intact, I´m bullish for new short term highs.
