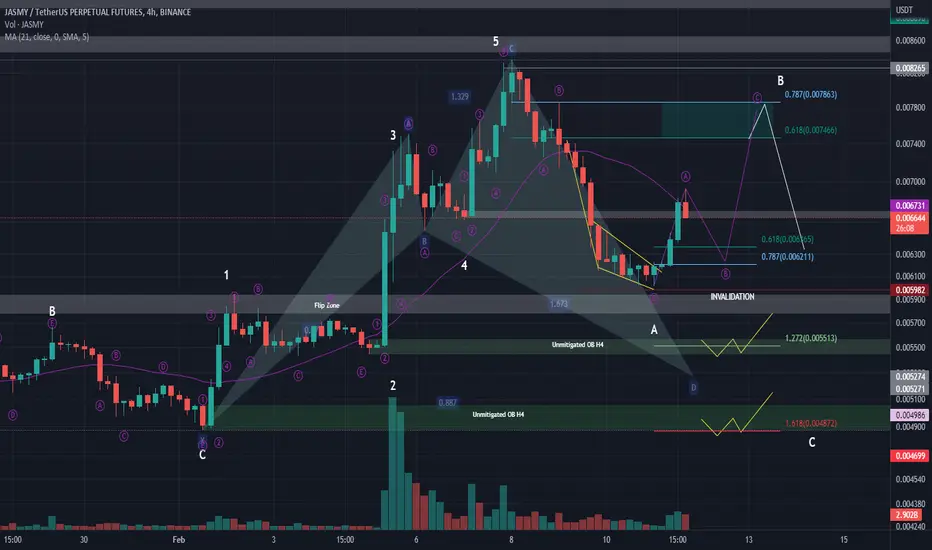
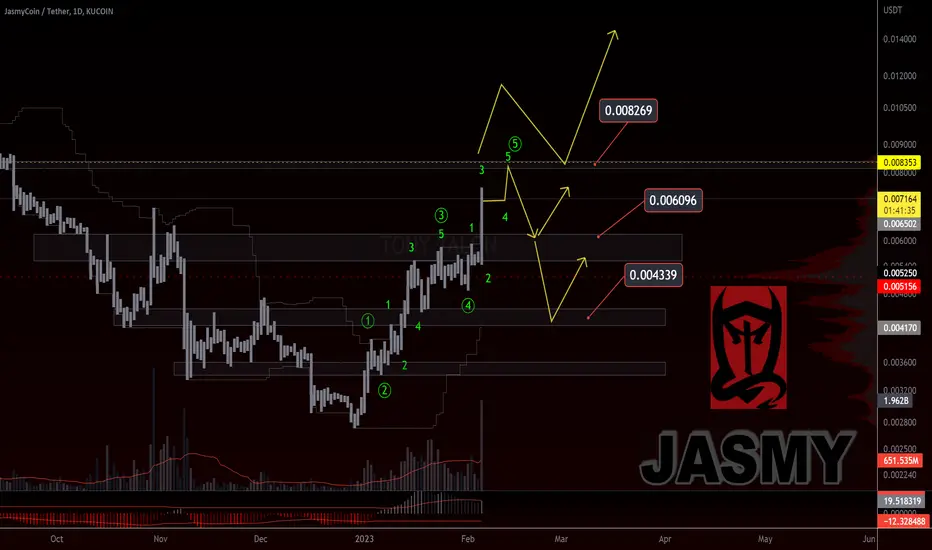
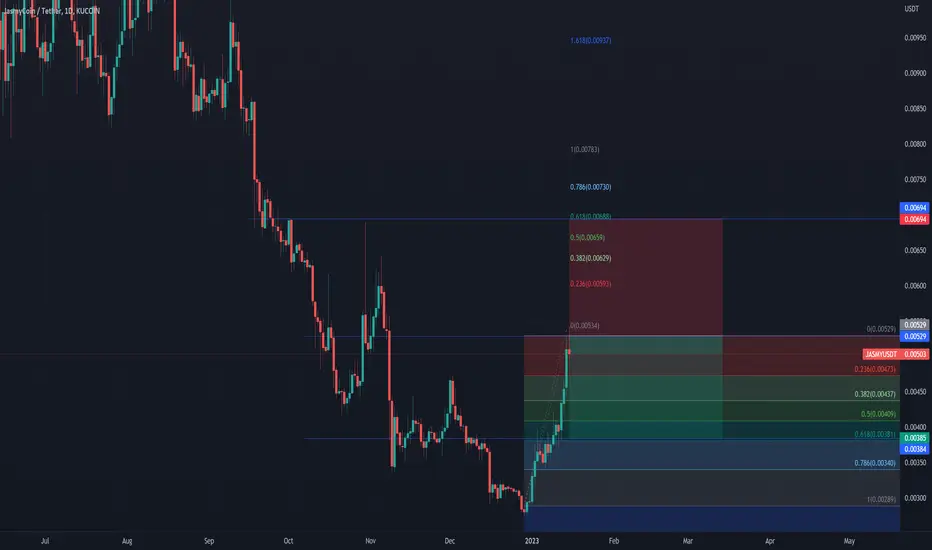
JASMY USDTAdditional confluence. ABCD harmonic. price possible to retrace only up to 0.006365 (0.618 fibo AB) then bounce till 0.007527 (1.272 fib ext of leg BC).
JASMYUST trade ideas

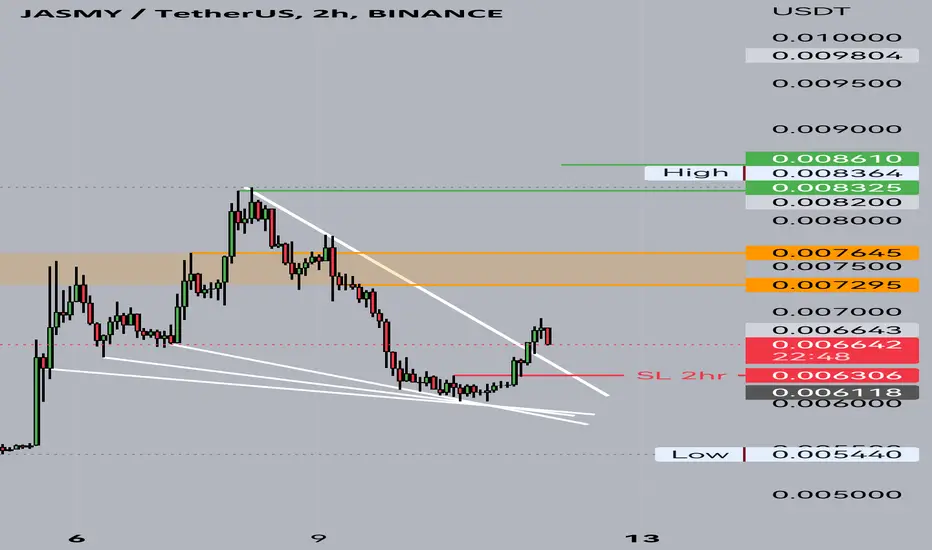
Jasmy 2hr bullish ifJasmy has a falling wedge pattern and it has to breakout from the orange area in order to achieve the green targets.
SL is 2hr below the red line
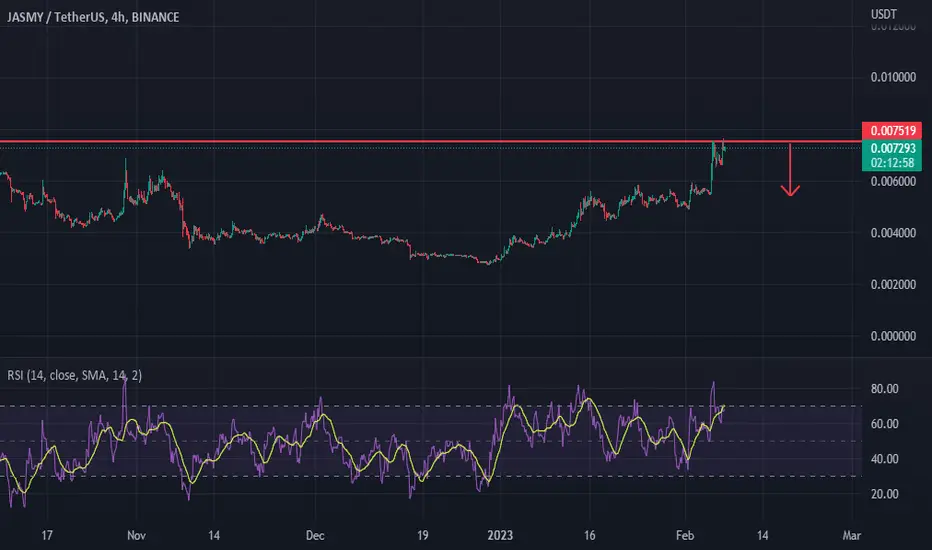
JASMY USDTJASMY buy/long => sell/short idea
elliott wave + SMC + Harmonic + price action
I will long from 0.006211-0.006365
Invalidation of this will be at 0.005982
my target will be the entry zone for my short 0.007466-0.007863
always observe before entry and manage risk!
Jasmy update, is it done retracing? If you find this info inspiring/helpful, please consider a boost and follow! Any questions or comments, please leave a comment! Also, check out the links in my signature to get to know me better!
Played out as the bearish Elliott Wave variant was laid out.
if it prints an impulse down the correction could just be beginning. If it prints a ZZ, could lead to continuation.
Cheers!

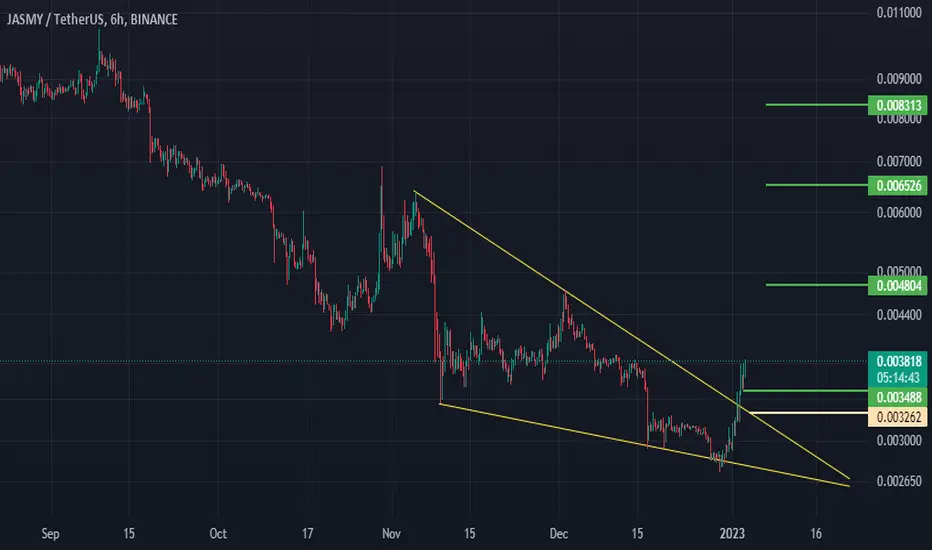
JASMYbroke major trend line , retesting now ,
may retest 0.0028 bottom , depends on btc !
not financial advice.

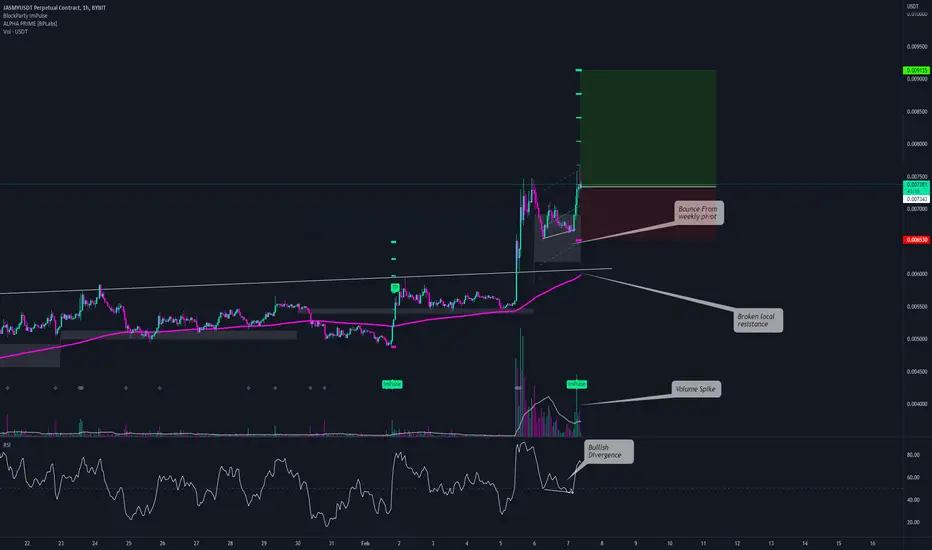
$JASMY - Long Swing Opportunity$JASMY - Long Swing Opportunity
Entry Conditions:
- Volume Spike and overall volume coming in
- Bullish Divergence
- Bullish Impulse Signal
- Bounce From Weekly Pivot
- Breakout of local trend
Jasmy jamminIf you find this info inspiring/helpful, please consider a boost and follow! Any questions or comments, please leave a comment! Also, check out the links in my signature to get to know me better!
This would probably be the most conservative Elliott wave impulse variant.
Got others, but want to see if it gives a retrace first.
Coming up and breaking .0082 and flipping it would have me considering more bullish alts.
Cheers!
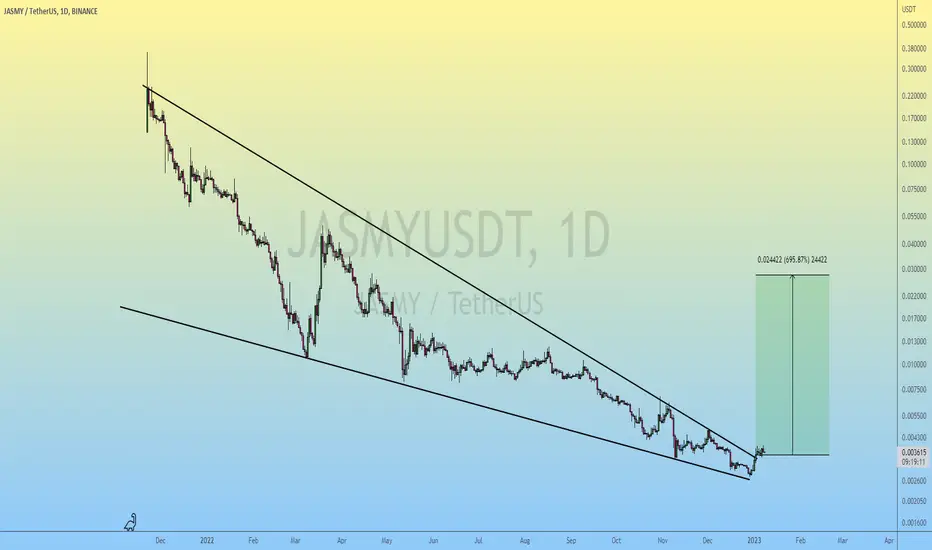
JASMYUSD long idea back to ATH 6400%Is it even possible, we can ask this question.
Everything is possible in crypto, we answer.
if we put $100 which we are always ready to lose, then 6400% will give us...
how much?
JASMYI gave analysis of jasmy when it was 0.34. Now it stayed very at the back. So, It needs to go 0.65 immedietly. But, After 0.65 there will be mega dump for jasmy. Be careful.
JASMY at support would like to see more volumeJASMY at support would like to see more volume
Market Cap: 237M
Category: IOT
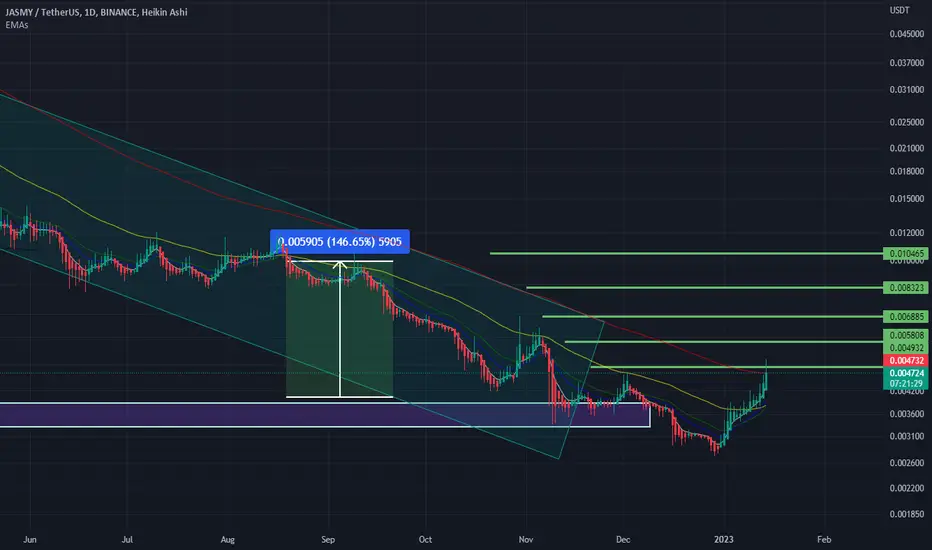
Target 1: 0.005813
Target 2: 0.006303
Target 3: 0.006810
Stop Loss: 0.004636
Manage Risk - have a stop loss in place
price movement prediction
Price Prediction
not financial advice
this is for entertainment purposes only
always DYOR


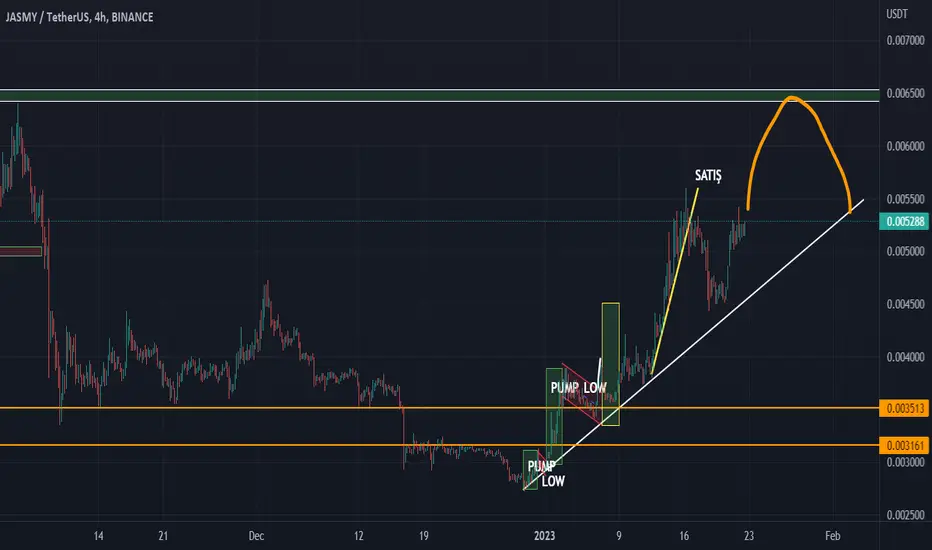
Shorting Jasmy after a consistent 6 days of uptrendJasmy is unsustainably overbought. We can observe a point of interest at 0.0053 where I believe we will see a change of character and a long squeeze KUCOIN:JASMYUSDT
Jasmy Set For Reversal! Jasmy is an IoT platform that aims to develop infrastructure that enables anybody to use data safely and securely.
Many dubbing this the Japanese BTC and it being on the most prominent Exchanges this is looking like a gem in the Deep!
Just now finishing up the releasing of the tokens and now is 95% of total circulating supply...
IMO Jasmy has bottomed and a Reversal is underway!
WHAT'S WRONG WITH JASMY ?There are many reasons for shorting Jasmy, but the biggest reason is that the supply of this token was unlocked recently. Will or how can it be stable. That's why I am shortening it

JASMY GO TO MOON VERY SOONHi, dear traders. how are you ? Today we have a viewpoint to BUY/LONG the JASMY symbol.
For risk management, please don't forget stop loss and capital management
When we reach the first target, save some profit and then change the stop to entry
Comment if you have any questions
Thank You

JASMYUSDT#JASMYUSDT
we shared this idea with you and gave right good profits
Target 1️⃣ : done✅
Price reached : 0.005198$ ✅
Profit: 28.53%🚀🤑
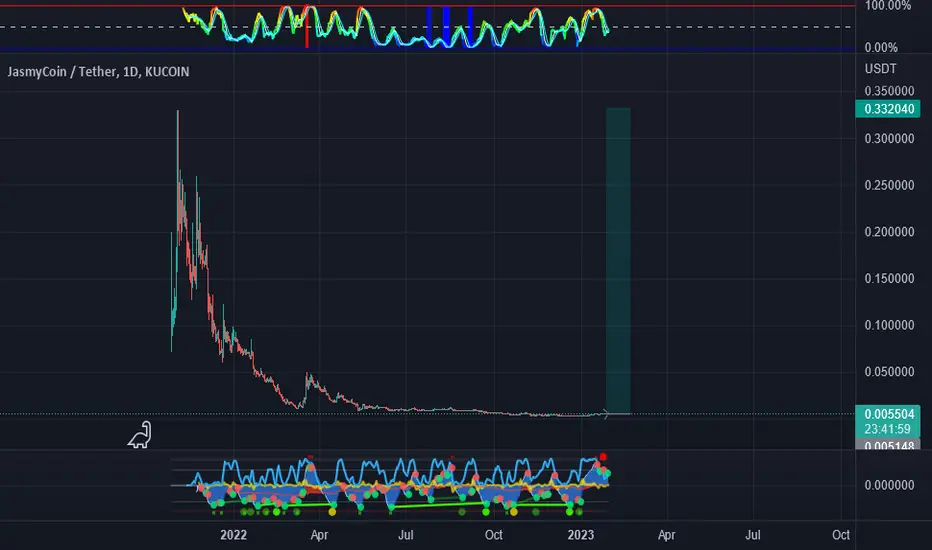
JasmyCoin Chart AnalysisThe thing about the altcoins vs USD/USDT is that most of them move just like Bitcoin and this is the case with JasmyCoin (JASMYUSDT).
I am doing this analysis on the request of @Jay3000, a precious follower of ours.
So, the chart is the same as Bitcoin.
Peak/All-Time High in November 2021 followed by a major downtrend.
Lower low with lower highs.
There is just one question possible here, is the downtrend over?
Is the bear market over?
Impossible to figure out from the chart.
We only know after the bottom is in.
We can only know when the bottom is in/confirmed when the downtrend is broken.
As long as the downtrend remains active, our bias remains with the trend.
We can expect lower prices until the downtrend ends.
What to expect?
It is likely we see another major drop as the bear market climax or the bottom can... This is just guessing ...
Here is what the chart says:
- Above $0.0065, the bulls can move ahead.
- Any trading below this level and the bear market hasn't end.
I hope that helps.
Namaste.
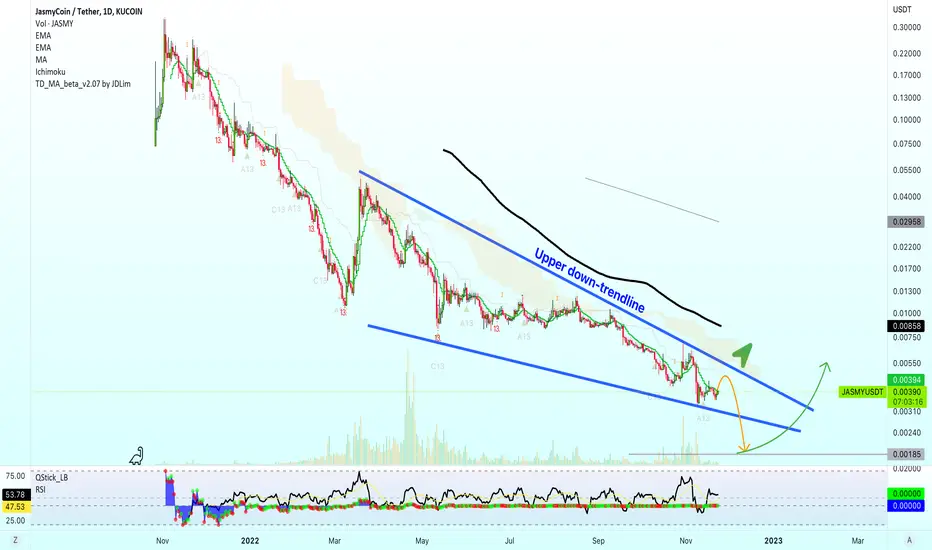
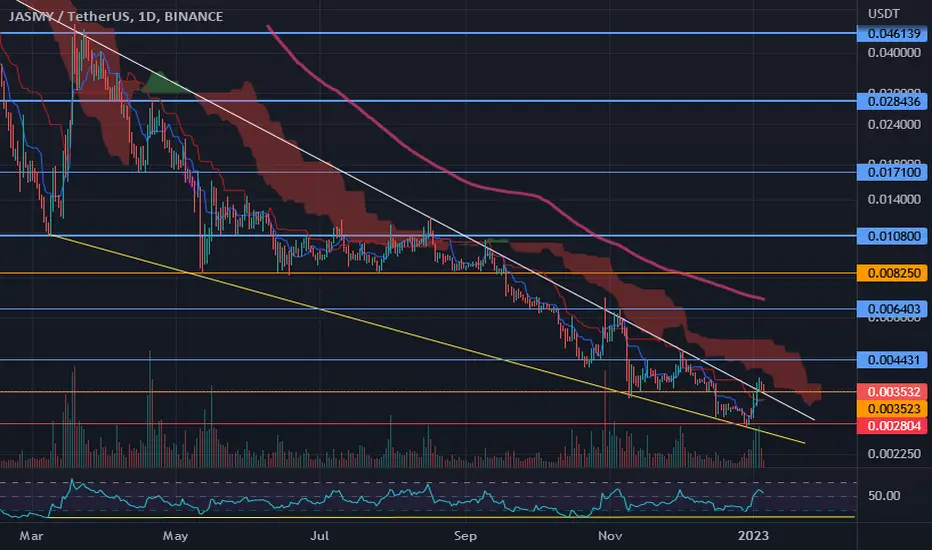
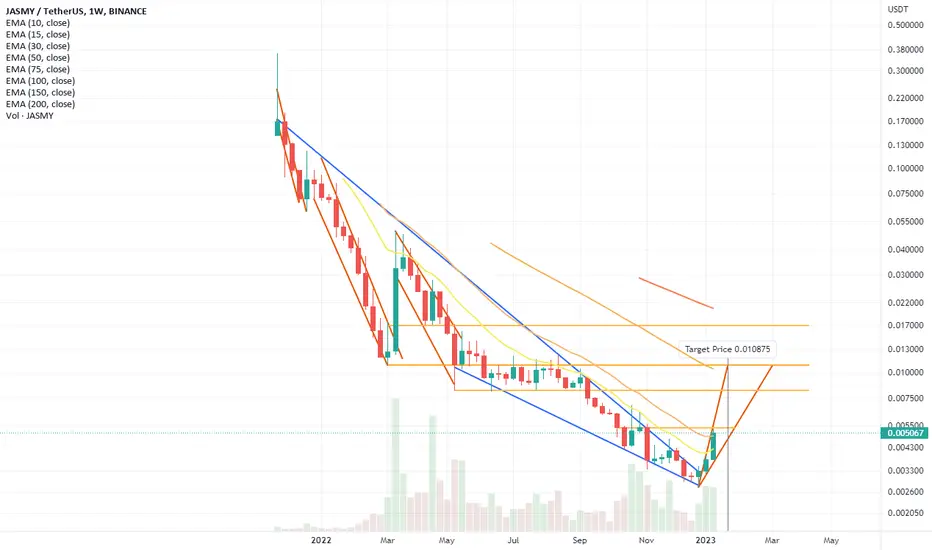
✴️ JasmyCoin Update by Request (350% Profits Potential)I see your interest in this altcoin pair and acknowledge it, so here is the update as requested.
We look at the chart fresh/new, even though the last trade idea was good.
We have the major downtrend taking place for JasmyCoin (JASMYUSDT) since November 2021, here we are looking at it since March 2022.
Since March 2022 a long-term bullish divergence has been building up on the RSI.
A stronger bullish divergence came in again from October 2022 vs the current December 2022 low.
JASMYUSDT hit a strong lower low between these two dates while the RSI hit a strong higher low.
So the yellow cup on the chart is the 'liquidity hunt'/stop-loss hunt move by the market.
A new low is hit but prices quickly recover and this is marked with a bullish divergence on the RSI, which confirms that JasmyCoin is not due to go lower but instead the market was looking for needed liquidity.
Now that this has been taken care of, the trend can change... Or so the signals are saying.
We have a very strong RSI at 60.
A strong RSI near support/low prices is a heavy signal, it is worth a lot.
JASMYUSDT is also now trading above EMA50, another very strong signal.
And the major down-trendline here marked as a falling wedge pattern has also been broken.
All this opens the door to higher prices.
Knowing this, reading these signals one would be tempted to take action.
Here is how a professional or experienced trader would go about using this information:
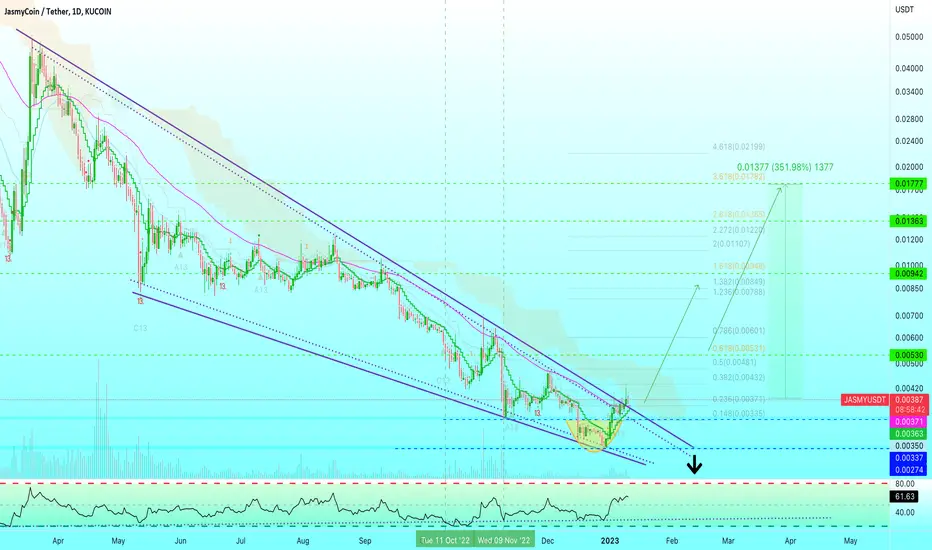
1) Buy with a bullish bias (anticipating prices will grow).
The targets are on the chart, if it grows then sell according to his/her own system/strategy.
2) Control risk/define risk.
A short-term stop-loss can be used around 0.00335.
(If prices move and close below this level, close the trade).
A stronger stop-loss can be used around 0.00273.
(If prices move and close below this level, close the trade).
This experienced trader did the job.
He bought with the right signals and defined his risk in case things go wrong.
If there is a bullish follow up, then we are green and the rest is to enjoy the ride on the way up.
This is not financial advise.
I am sharing my experience, views and opinion.. Initial, I was just reading the chart.
Thank you for your continued support.
Namaste.

JASMY/USDT | looks Bullish here..!!
#JASMY Looks Bullish here..🏄♂️
Finally, Falling Wedge Breakout has Confirmed in Daily timeframe Chart..
RSI is Printing Bullish Divergence.
Pretty Decent Buying Volume Coming in..
Grab Some with Low Risk & Hold with Patience..
Please like the idea for Support & Subscribe for More ideas like this and share your ideas and charts in Comments Section..!!
Thanks for Your Love & Support..!!