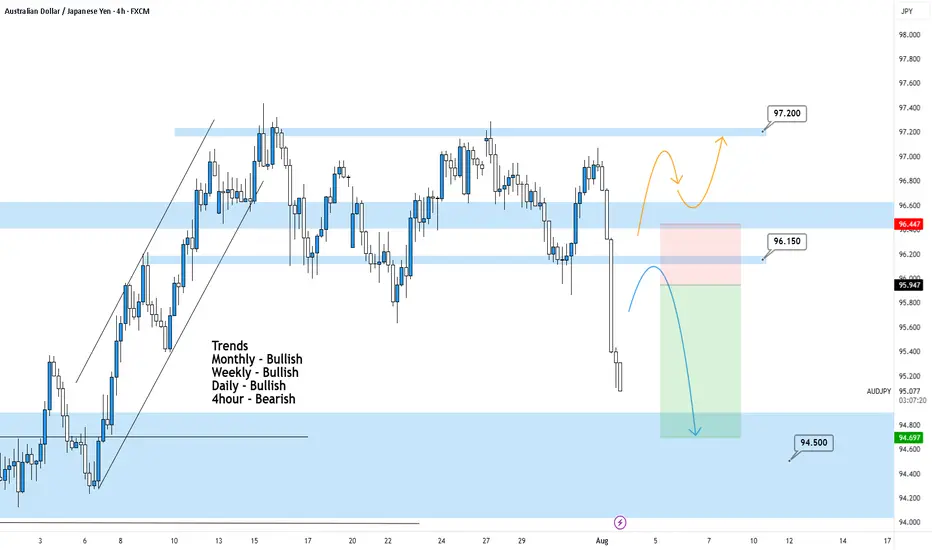
AUDJPY 4Hour TF - August 3rd,2025🟦 AUDJPY 4H Analysis Bearish Idea
📅 August 3rd, 2025
🔹 Top-Down Trend Bias:
• Monthly – Bullish
• Weekly – Bullish
• Daily – Bullish
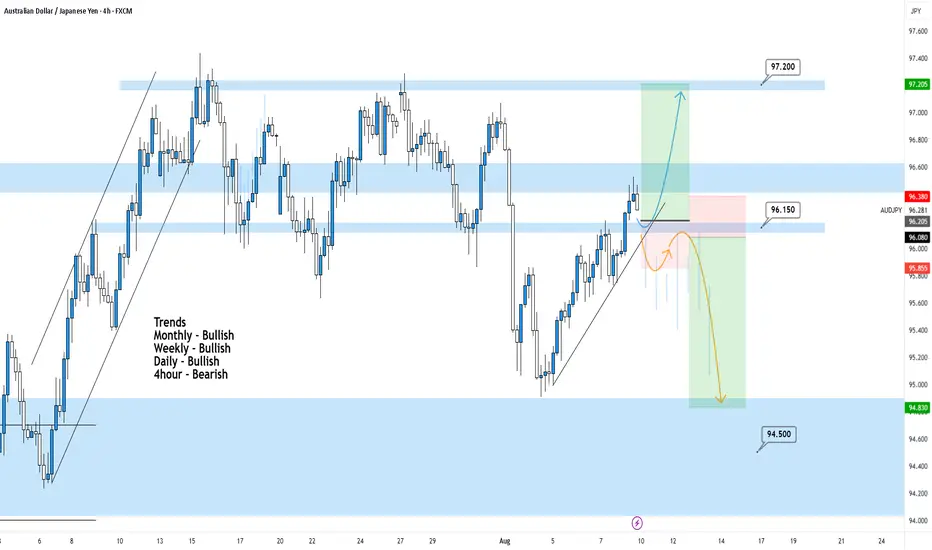
• 4H – Bearish
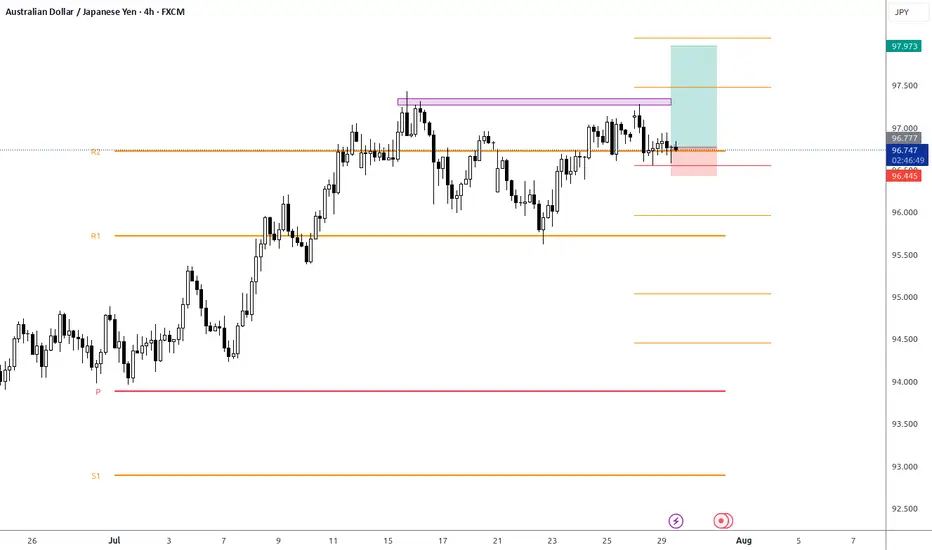
AUDJPY has broken cleanly below prior structure around 96.15, signaling short term bearish momentum within a higher timeframe bullish environment. Price is currently approaching key decision zones.
🔍 Key Zone: 96.15 – 96.45
This former support zone may now act as a bearish retest area and new resistance. This offers a potential entry for continuation plays if structure holds below.
✅ Scenario A: Bearish Continuation (Blue Path)
1.If price retests and rejects from 96.15–96.45
2.Look for bearish confirmation (rejection wicks, engulfing, LTF structure shift)
Target: 94.50
This setup is trend aligned with current 4H momentum and offers a clean structure based downside.
⚠️ Scenario B: Bullish Reclaim (Orange Path)
1.If price breaks and holds above 96.45
2.Could signal a shift back toward higher timeframe bullish continuation
Target: 97.20 resistance zone
This is a counter-trend idea on the 4H and requires confirmation
🧠 Final Notes
• Short-term bearish bias while price remains below 96.45
• Let the retest confirm the direction
• Clean structure = clean setups
JPYAUD trade ideas
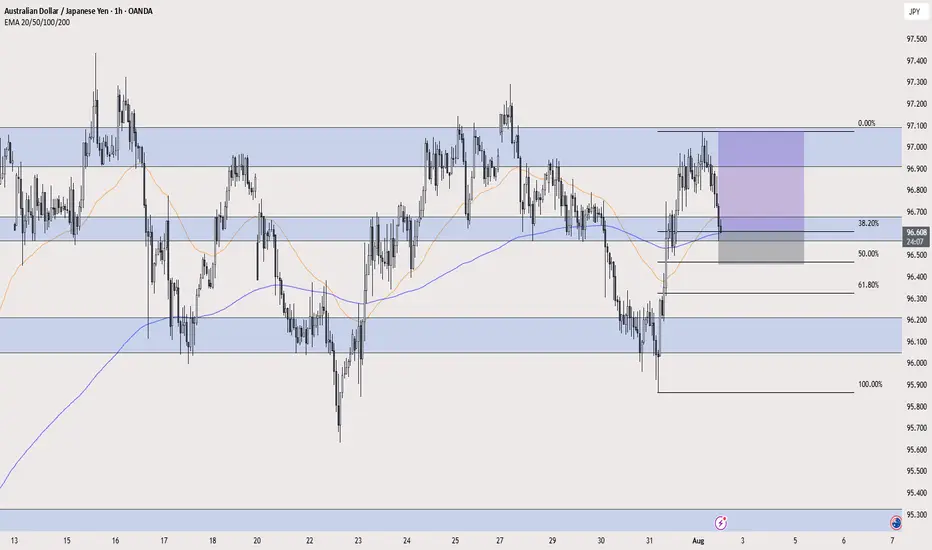
AUD/JPY LONG AUD/JPY LONG " break of a resistance area and retest it + 38.2% fib retracement + 50 and 200 ema dynamic support + risk on environment "
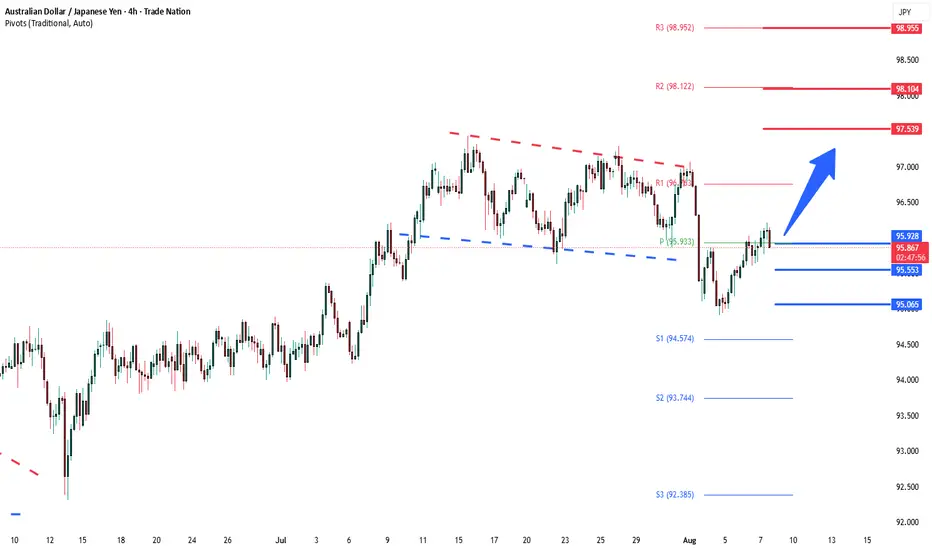
AUDJPY Bullish Continuation Key Support and Resistance Levels
Resistance Level 1: 97.527
Resistance Level 2: 98.091
Resistance Level 3: 99.00
Support Level 1: 96.00
Support Level 2: 95.574
Support Level 3: 95.060
This communication is for informational purposes only and should not be viewed as any form of recommendation as to a particular course of action or as investment advice. It is not intended as an offer or solicitation for the purchase or sale of any financial instrument or as an official confirmation of any transaction. Opinions, estimates and assumptions expressed herein are made as of the date of this communication and are subject to change without notice. This communication has been prepared based upon information, including market prices, data and other information, believed to be reliable; however, Trade Nation does not warrant its completeness or accuracy. All market prices and market data contained in or attached to this communication are indicative and subject to change without notice.

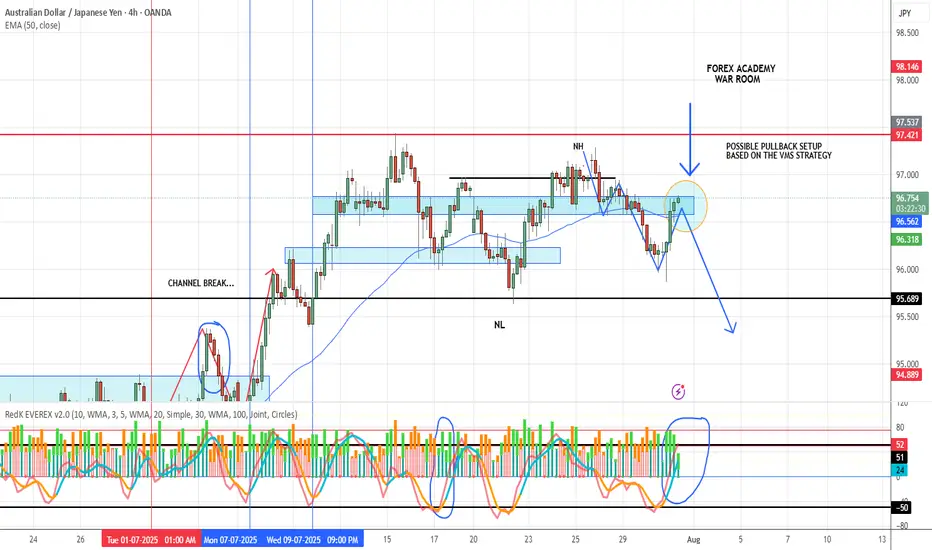
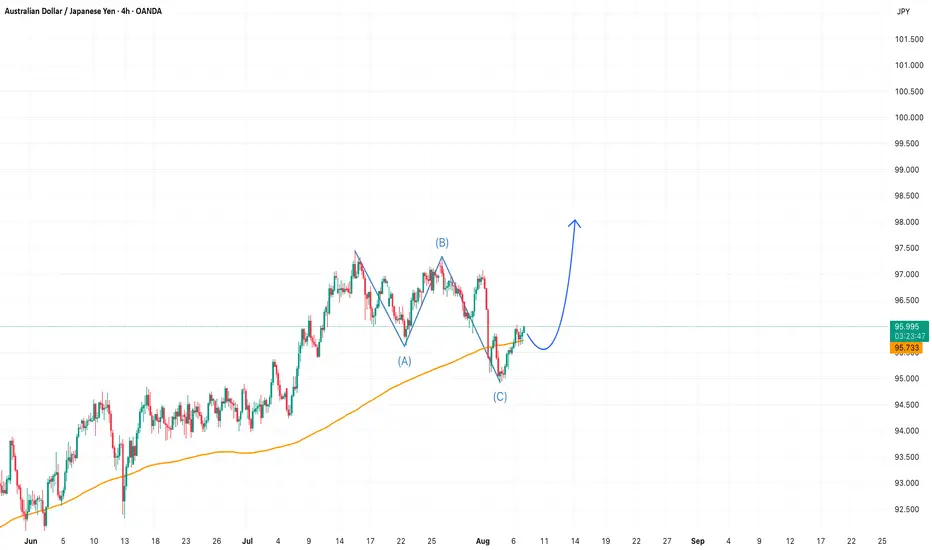
AUD/JPY POSSIBLE SETUPThis pair has made a clean 3-leg pullback into a solid resistance zone.
Price action is now near the 50 EMA — a key area we watch closely.
From here, we’re waiting for confirmation:
✅ Strong volume
✅ Aligned momentum
✅ A clear engulfing candle
If all of that lines up, we’ll drop to the 1-hour chart and look for a precise entry trigger using the VMS strategy.
Patience first. Execution second.
Let the setup come to you.
AUD/JPY bulls eye 99, 100The yen is broadly weaker, which is even allowing a weaker Australian dollar to rise. And with a decent bullish trend on the daily chart, I am now seeking dips within a recent consolidation range in anticipation of a move to 99 or even 100.
Matt Simpson, Market Analyst at City Index and Forex.com

Trendline BreakThe price has broken out of a bullish trendline, followed by a pullback and now the price looks to make a lower low and go short
WE ONLY TRADE PULLBACKS
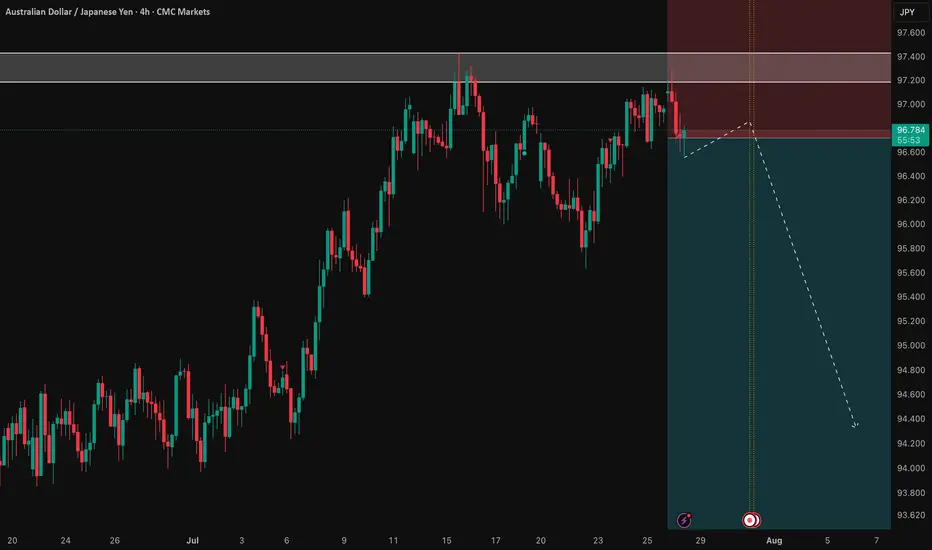
AUD/JPY: Fading the Rally at a Major Resistance ZoneWhile AUD/JPY has been in a clear uptrend, the rally is now approaching a significant technical ceiling where sellers have previously stepped in. We see a compelling opportunity for a counter-trend short, betting that this resistance level will hold and that the current bullish momentum is showing signs of exhaustion.
This trade is for those watching for a market turn, offering a well-defined risk-to-reward setup for a swing position.
🤔 The "Why" Behind the Short Setup
📰 The Fundamental Risk
The Australian Dollar is a "risk-on" currency, meaning it performs well when global markets are optimistic. The Japanese Yen, however, is a classic "safe-haven" asset that strengthens during times of uncertainty. With the upcoming high-impact Australian CPI data, any sign of economic weakness could disappoint the market, increase pressure on the RBA, and trigger a "risk-off" move that would benefit the Yen and send AUD/JPY lower.
📊 The Technical Ceiling
The chart tells a clear story. The price is currently testing a major resistance zone. Attempting to short near a strong ceiling like this provides a strategic entry to capture a potential trend reversal. We are essentially betting that the trend's multi-week momentum will stall and reverse from this key technical juncture.
✅ The High-Clarity SHORT Trade Setup
📉 Pair: AUD/JPY
👉 Direction: Short
⛔️ Entry: 96.716
🎯 Take Profit: 92.080
🛑 Stop Loss: 98.907
Rationale: This setup plays for a significant swing move. The wide stop loss is designed to withstand volatility from news events, while the deep take profit targets a full reversal back to major support levels seen earlier in the year.
Bullish for AudjpyLiquidity chase towards the highs🚀
Buyers are bias will take continuous hold in the market for the week
The highs is a potential target due to liquidity
Bullish for Audjpy Liquidity chace toward the highs 🚀
Buyers are bias will take a continuous hold in the market for the week
The highs it a potential target due to liquidity

AUDJPY 4Hour TF - August 10th,2025🟦 AUDJPY 4H Analysis
📅 August 10, 2025
Top-Down Trend Bias:
• Monthly – Bullish
• Weekly – Bullish
• Daily – Bullish
• 4H – Bearish
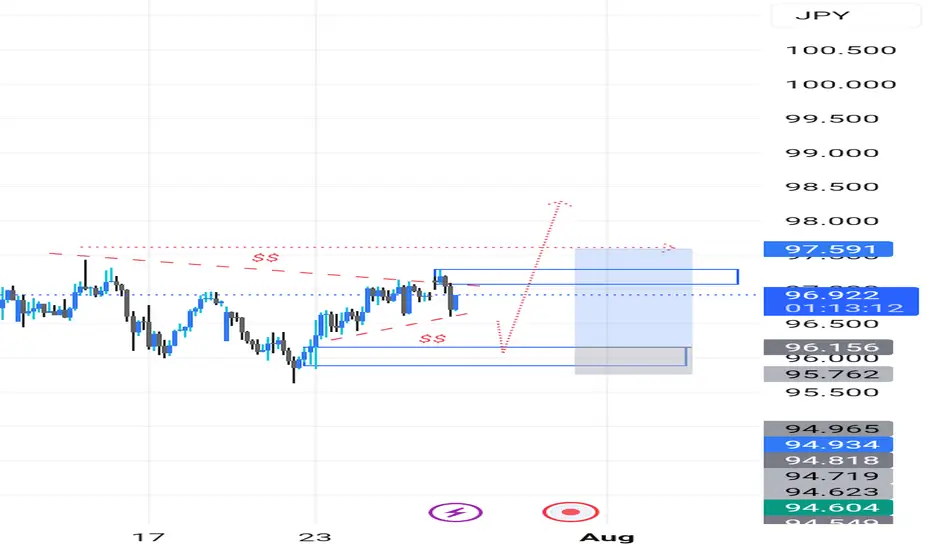
AUDJPY pushed above 96.15 resistance zone after a short term bullish correction. Higher timeframes remain bullish, but the 4H could still show signs of further bearish movement.
🔍 Key Zone: 96.15
This zone has acted as support and resistance in the past and will be the deciding area for the next directional move.
✅ Scenario A: Bullish Breakout (Blue Path)
1.If price holds above 96.150 area
2.Look for continuation into 97.20 support
This would align with the higher timeframe bullish bias
⚠️ Scenario B: Bearish Rejection (Orange Path)
1.If price breaks and holds below 96.150
2.Watch for bearish confirmation (engulfing, LTF BOS, rejection wicks)
Target: 94.50 support zone
This would maintain the current 4H bearish structure despite the bullish HTF backdrop.
🧠 Final Notes
• 96.15 is the short term decision point for both buyers and sellers
• HTFs favor longs, but sellers may control the 4H
• Confirmation at the zone is key before taking either direction
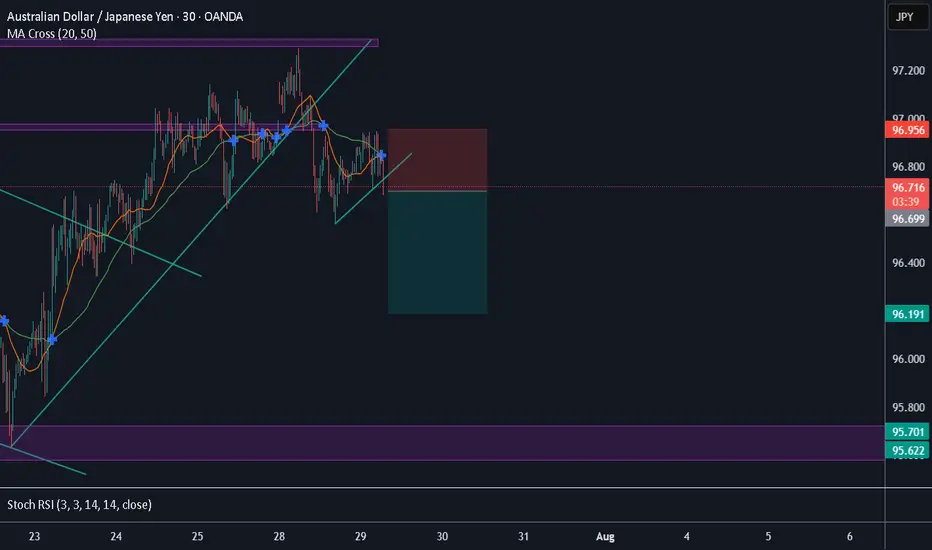
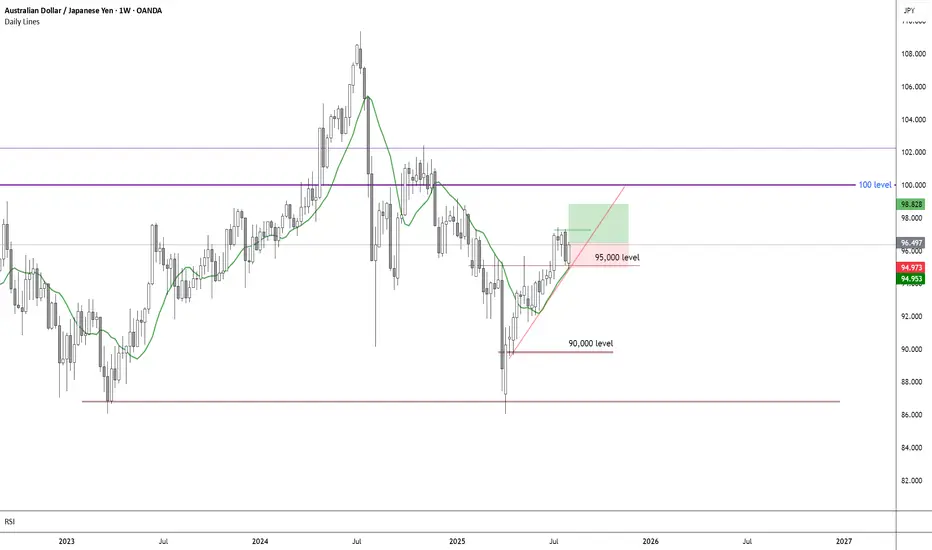
Long ideaBeautiful setup with such nice price action but News next week RBA Rate statement!
50 day moving average, bounce on round 95,000 level nice 45 ° trendline .
That is 3 confluences in my book.
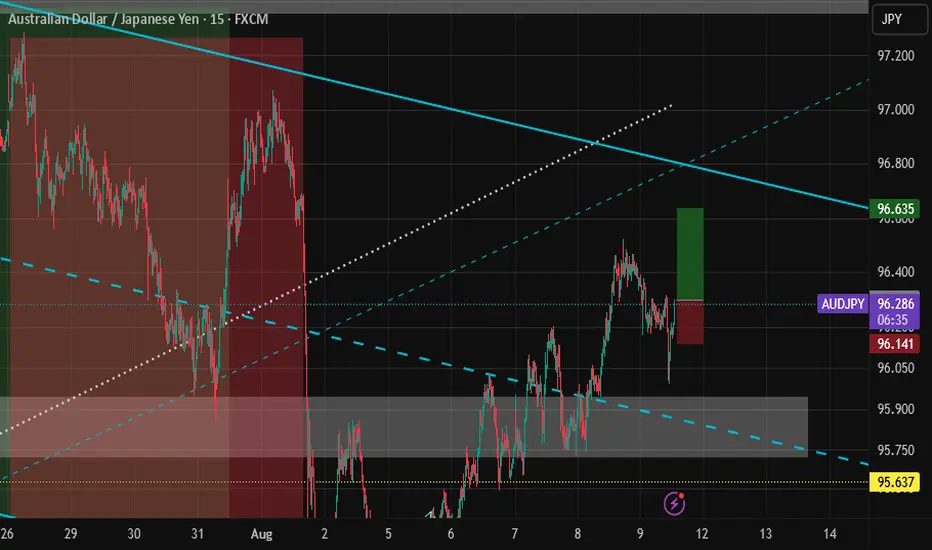
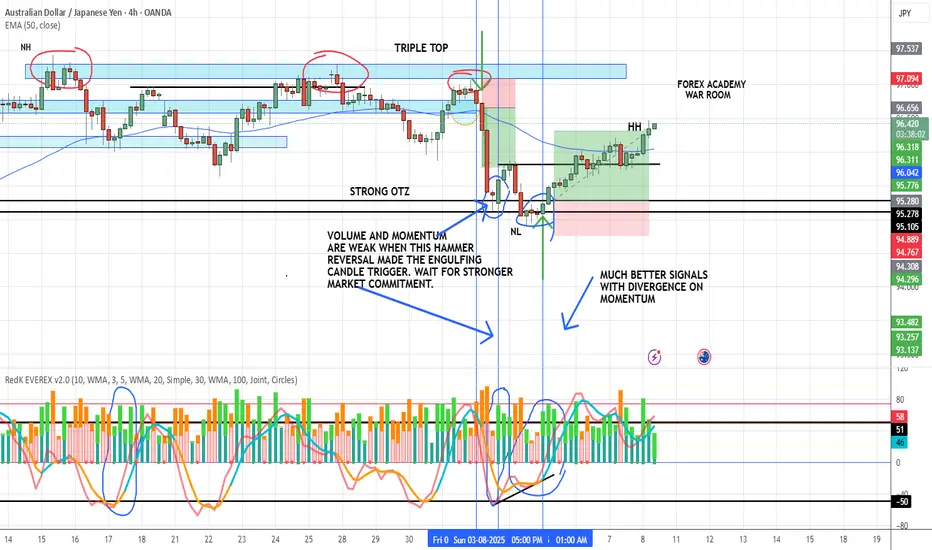
Why the VMS Strategy Works – A Live Example using AUDJPY 4HHere’s a perfect example of why following the rules matters.
The first setup was a strong hammer reversal right after an impulsive move to the downside (which we also traded). We got a clean engulfing candle and volume was decent…
But — both momentum lines must be hooking in our favor for confirmation. In this case, one was and one was not.
Daily chart was also in a downtrend but hitting support
So not bad, but not great
✅ Discipline says: Pass.
The very next day, we got a better setup:
All VMS rules met (Volume, Momentum, Structure)
Bonus: Momentum divergence in our favor
That’s the power of combining volume and momentum with structure — it filters out the “almost” trades and keeps us focused on the high-probability setups.
Disclaimer: This is for educational purposes only — not financial advice. Always do your own research, practice extensively, and use proper risk management before trading live.
AUDJPY SELLAUDJPY SELL
trend Line is brake.
lower lower is accepted.
I think this is good for today may be it will be profitable for next week.
have a good weeked.
AUDJPY SELL SETUP SHOOOOOOOOOOOOOORTTHE Price now on resistance level
and it shaped head and shoulder on time frame 2H and take inducement so i expect shoort

AUDJPY Key tarding level retest at 96.00Key Support and Resistance Levels
Resistance Level 1: 97.527
Resistance Level 2: 98.091
Resistance Level 3: 99.00
Support Level 1: 96.00
Support Level 2: 95.574
Support Level 3: 95.060
This communication is for informational purposes only and should not be viewed as any form of recommendation as to a particular course of action or as investment advice. It is not intended as an offer or solicitation for the purchase or sale of any financial instrument or as an official confirmation of any transaction. Opinions, estimates and assumptions expressed herein are made as of the date of this communication and are subject to change without notice. This communication has been prepared based upon information, including market prices, data and other information, believed to be reliable; however, Trade Nation does not warrant its completeness or accuracy. All market prices and market data contained in or attached to this communication are indicative and subject to change without notice.
AUDJPY continues its upward trend after a brief correction.The pair has resumed its bullish momentum, suggesting further upside potential in the coming sessions. Traders may look for buying opportunities as long as the current trend structure remains intact.

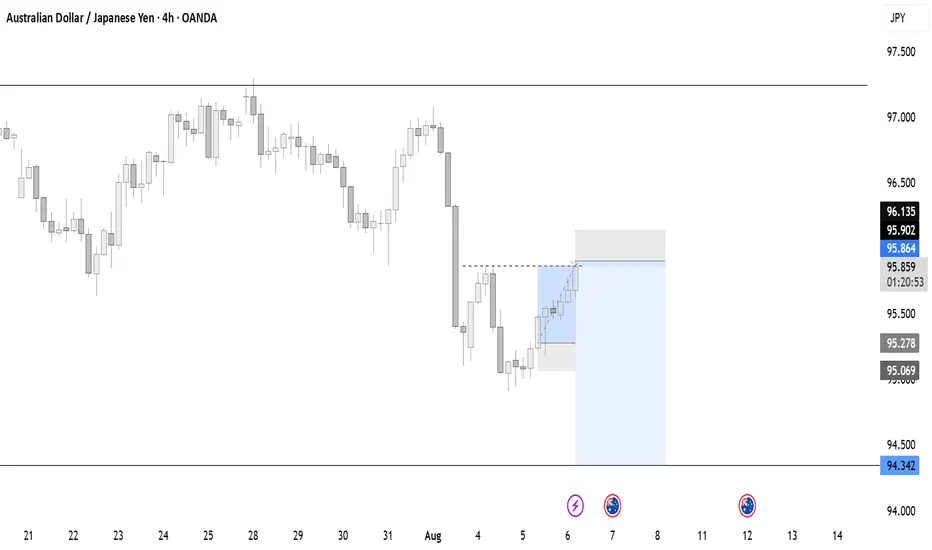
Sell AUDJPYAUDJPY buy will quickly turn around and start shorting in the next few hours. Price will test the support at 94,342 soon. Price was already on a downtrend, yesterday we saw a bullish retracement to trigger sell orders.
AUD/JPY – 4H Technical & Fundamental AnalysisAUD/JPY – 4H Technical & Fundamental Analysis
AUD/JPY is currently hovering around the 95.00 psychological level. A decisive break below this level could open further downside potential. The Japanese Yen is gaining traction amid a global risk-off sentiment, acting as a safe-haven currency. Meanwhile, the Australian Dollar is under pressure as speculation grows about potential rate cuts by the Reserve Bank of Australia (RBA).
In addition, AUD is highly correlated with commodities. The recent decline in commodity prices is dampening investor appetite for the Aussie.
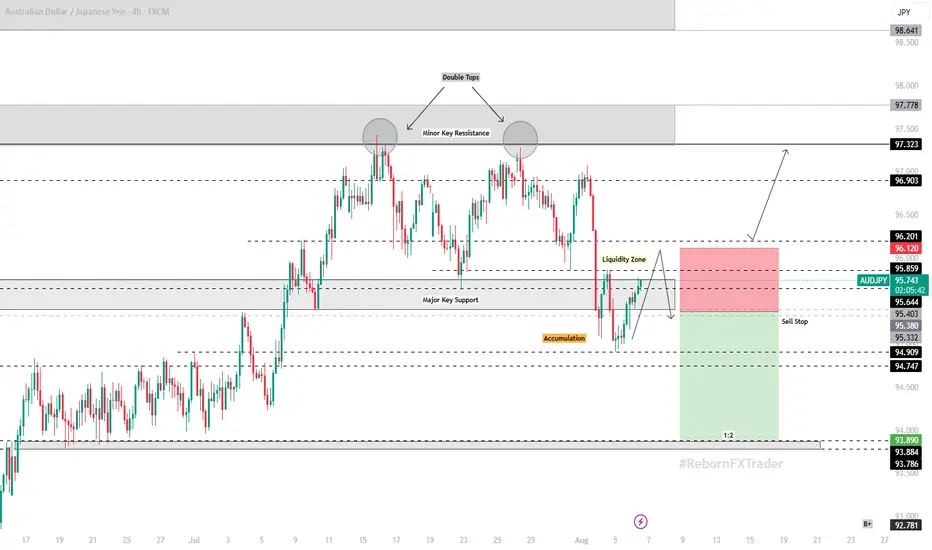
From a technical perspective, the pair recently formed a double top near the 97.300 resistance zone, signaling a potential trend reversal. Price then broke below a major support level at 95.500, followed by a period of accumulation, indicating sellers entering the market.
However, we are still waiting for clear signs of liquidity to form. Our plan is to wait for a liquidity grab near the zone, then execute a Sell Stop strategy once confirmation is present.
🔽 Sell Setup Plan:
Entry (Sell Stop): 95.380
Stop Loss: 96.120
Take Profit: 93.890
We remain cautious but biased toward bearish continuation upon confirmation of liquidity and key level rejection.
📌 Disclaimer:
This is not financial advice. Always wait for proper confirmation before executing trades. Manage risk wisely and trade what you see—not what you feel.
AUD/JPY LONG FROM SUPPORT
Hello, Friends!
The BB lower band is nearby so AUD-JPY is in the oversold territory. Thus, despite the downtrend on the 1W timeframe I think that we will see a bullish reaction from the support line below and a move up towards the target at around 96.130.
Disclosure: I am part of Trade Nation's Influencer program and receive a monthly fee for using their TradingView charts in my analysis.
✅LIKE AND COMMENT MY IDEAS✅

AUDJPY Love Story: One Last Red Candle and I’m GoneWe had a beautiful connection between 97.06 and 95.10 —
our special place, our Sell Range of memories. 💑
But then came a small pullback… from 95.10 to 95.81.
Just when I thought we were falling together, AUDJPY pulled away (retracement) — classic mixed signals. 😢
Now, I’m patiently watching...
If AUDJPY sends me a clear sign — a bearish candle closing below 50EMA —
I’ll know it's real.
No more mind games, no more confusion. I’m in. 💔➡️📉
If it's a strong Marubozu, I’ll give it my full trust — SL just above it.
TP? Back to where it all began… 95.10.
That’s where I’ll let go — and close the chapter. 📘
WHAT IF IT WONT CROSS?
This is day trading setup. While watching 15m candle to bear below 50EMA also I glance 1hr chart. This setup will be valid as long as 1hr chart is still in bearing range.
Wish me luck… and a big bearish Marubozu kiss! 😈📉
